This research is about machine learning based decision support tools for portfolio risk analysis to help investors in stock selection. Machine learning-based decision support tools for portfolio risk analysis have great potential in stock selection.
Introduction
Introduction
Problem statement
The news they receive may be fake news and investors will lose a lot of money because of it. In the stock market, anyone who can make an accurate prediction, and then he will be the one who gets a lot of money.
Objective
Research Objective
Bayesian network is used to determine the opening price for the shares in the next seven, fourteen and also twenty-one days. The reason you get results after seven, fourteen, and also twenty-one days is that investors need time to take action, whether to sell out or buy the stock.
Research Tasks
The core feature of Machine Learning based decision support tools for portfolio risk analysis is the Bayesian network.
Scope
Literature Review
System that normally use for portfolio selection
This trivial point can cause investors to lose their money because they choose the wrong brokers or fund managers to invest for them. Different portfolio equity investment companies may use different methods or different systems to assist brokers or fund managers in selecting stocks.
Investment strategy
- Long term investment in stock market
- How to find out which long term stocks to buy
- Short term investment in stock market
- How to find out which short term stocks to buy
- Risk in stock market
- Type of market risk
Business will continue to grow and if the CEO of the company is competent, the company will grow rapidly, indirectly causing the stock prices to rise faster. If they cannot repay the interest, the company will face bankruptcy because of the debt.
How fund manager select stock
- Value at risk
- Stress testing
- Scenario analysis
- Historical simulation
- Monte Carlo
- Delta-Normal method
The scenario analysis is used to analyze the risk for the share which may happen in the future. Historical simulation uses past data which means historical data to predict the stock price of that stock tomorrow.
Artificial Intelligence systems for portfolio selection
Bayesian Network
For a particular portfolio that gets the sources saying that the percentage of the stock will increase its value up to 50% (which equals 0.5), another source says the stock will increase its value up to 70% (which was equal to 0.7) ). If the results returned are between the parameters, the experiments will be repeated to recalculate the stock prices.
Neural Network
To create an accurate neural network, developers need a lot of money to purchase the data to feed the neural network program. The result may not be accurate if the data given to the neural network program is only a small amount of data.
Compare Artificial Intelligence systems for portfolio selection
If the data provided to the neural network is not "enough", the result returned by the neural network will not be an accurate result. A neural network is much more unreliable because the term "enough" is an unknown value.
Research Methodology
On the other hand, the Bayesian network can trace back why the program would return such a result. The return result for three outputs with higher accuracy than the other two Bayesian networks.
Contributions
Artificial intelligence technology can help a lot in the portfolio risk selection fields because it can run the system automatically and the fund managers do not need to look at the data daily or from time to time to select the portfolio stock. The more important things are, the experience of the artificial intelligence system will be improved based on the amount of data fed or trained to it.
Machine Learning-based decision support tools for portfolio risk analysis
Data Module
Prepare data for Bayesian Network
At the end of the day, inventory data will be processed into consumable data for Bayesian Network. Data will be converted into Bayesian Network consumable data so when consumed, the Bayesian Network by Visual C++ program will be faster.
Results that are generated by Bayesian Network
The results that are generated by the Bayesian Network will be multiplied by 100 to get the percentages for the results. The data used for testing the Bayesian Network will also be discretized using 4 bin counts.
Technical Module
Bayesian Network
PHP
Daily data or historical data used to test or consume the Bayesian network through Visual C++ will be processed and the data will be fitted into the area where it belongs. This is the process data used to test the Bayesian network through Visual C++.
Visual C++
Visual C++ for Bayesian Network consumption coding is almost similar to Visual C++ for Bayesian Network test. To save the result to a text file, Visual C++ will definitely require a location to save the text file for the purpose of using Bayesian Network.
Testing Module
Stock name will be stored in a text file so users can know which of the results it belongs to. The return results will show the possibility of the share price falling in the future in which range. The higher percentages, which means that the stock price will have more chances to fall into the particular price range.
The score is generated using 30000 historical portfolio stock data processed by PHP. The use of 30000 historical data of portfolio stocks, but not all historical data, is because it was used to test the accuracy of the Bayesian network and the connection between Visual C++ and Bayesian. So there is no need to use all historical data as 30000 historical data will be more than enough.
Results and Analysis
Bayesian Network with only today data without learning parameter (without
Bayesian Network with only today data without learning parameter
Bayesian Network with only today data with learning parameter
Bayesian Network with only today data with learning parameter (include price
Bayesian Network with seven days data without learning parameter
Bayesian Network with seven days data with learning parameter
Bayesian Network with seven days data without learning parameter (without
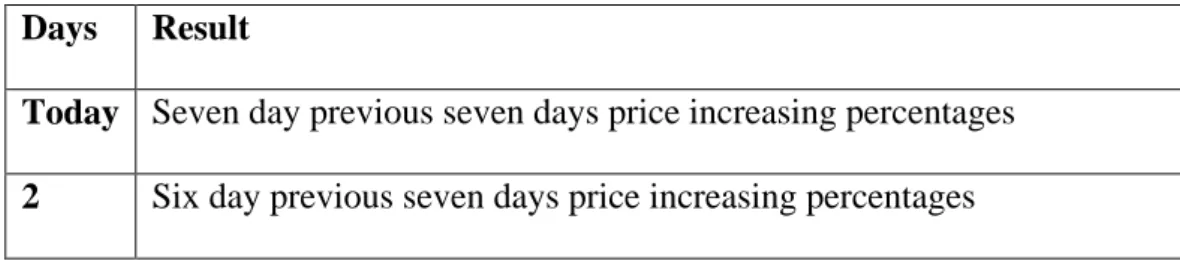
7 days prior 14 days price increase % 7 days prior 21 days price increase % 6 days prior 7 days price increase % 6 days prior 14 days price increase % 6 days prior 21 days price increase % 5 days prior 7 days price increase % 5 days previous 14 days price increase % 5 days previous 21 days price increase % 4 days previous 7 days price increase % 4 days previous 14 days price increase % 4 days previous 21 days price increase % 3 days previous 7 days price increase % 3 days previous 14 days price increase % 3 days previous 21 days price increase % Yesterday 7 days price increase % Yesterday 14 days price increase % Yesterday 21 days price increase % Today 7 days price increase % Today 14 days price increase % Today 21 days price increase.
Bayesian Network with seven days data without learning parameter with 4
Bayesian Network with seven days data without learning parameter with 3
Results Explanation
- Comparison between Bayesian Network result with only a day stock data
- Comparison between Bayesian Network result with seven days stock data
- Comparison between Bayesian Network result with only a day stock data
- Comparison between Bayesian Network with seven days of stock data
- Comparison between Bayesian Network with seven days of stock data
- Comparison between Bayesian Network with seven days of stock data
- Comparison between Bayesian Network result with background
Based on the results of the experiments, the Bayesian network will increase the accuracy of the Bayesian network with the learning parameter. The results for the accuracy of the Bayesian network with only daily inventory data are 47.6264%, and the results of the Bayesian network with seven days of inventory data are 42.4998%. Based on the experiment, the result of the Bayesian network with inventory data of only one day has higher accuracy compared to the result of the Bayesian network with inventory data of seven days.
The table above shows comparison between Bayesian Network results with three return results and four return results. Bayesian Network with seven days of stock data with four output accuracy is actually the same with the Bayesian Network with only three outputs. So it can be included in Bayesian Network with seven days of inventory data as an input data.
Overall result comparison
Based on the overall result, the Bayesian Network excludes seven days of data without learning parameter with 3 results and 4 four results because some of the input data is invalid. Moreover, I explained it about the input data for Bayesian Network with seven days data, the highest average accuracy is the Bayesian Network with only today data with learning parameter. Bayesian Network with only today data with learning parameter 4 return result has a higher average accuracy because it includes today price rising percentages.
Comparison
My portfolio risk analysis decision tools provide results after seven days, fourteen days and twenty one days so that investors have enough time to make decisions. Even if they want to sell their shares or buy shares, at least they will have time to raise money to buy or to find new buyers for their shares in hand.
Confusion matrix for the ANN model
Confusion matrix for the ANN_RS model
Confusion matrix for my Bayesian Network
Seven days price increasing percentages confusion matrix for the most
Fourteen days price increasing percentages confusion matrix for the most
Twenty one days price increasing percentages confusion matrix for the
Based on the confusion matrix above, for both systems, the Dhaka Stock Exchange timing decision tools provide higher accuracy than my portfolio risk analysis decision support tools. But as I mentioned earlier, although the accuracy is higher in daily forecasting, it is useless for these investors because the daily period is difficult to make decisions, sell and buy stocks. Also, the network used in their systems may be different, so the accuracy of the results may vary compared to the results I obtained from my system.
Conclusion and future improvement
Average opening price over three days = ((((previous 2 days opening price + opening price yesterday + opening price today) / 3) - opening price today) / opening price today) * 100. Percentages average opening price over seven days = (((opening price previous 6 days + opening price last 5 days + opening price last 4 days + opening price last 3 days + opening price last 2 days + opening price yesterday + opening price today) / 7) - opening price today) / today opening price) * 100. Fourteen day average opening price percentages = (((( previous 13 days opening price + previous 12 days opening price + previous 11 days opening price + previous 10 days opening price + previous 9 days opening price + previous 8 days opening price + opening price previous 7 days + opening price previous 6 days + opening price previous 5 days + opening price previous 4 days + opening price last 3 days + opening price last 2 days + opening price yesterday + opening price today) / 14) - opening price today) / opening price today) * 100.
Then divide the opening price by today and multiply by 100 to check the percentages of price increases outside the market. Then divide by today's opening price and multiply by 100 the current price increase percentages. Then divide today's opening price by the opening price and then multiply it by 100. This yields price-increasing percentages after seven days.
Then divide by today's opening price and multiply by 100 will get price increase percentages after 14 days. Then divide by today's opening price and multiply by 100 will get price increase percentages after 21 days. Average percentages of seven day opening price for network = 2 } else if (Average percentages of seven day opening price >.
