I certify that this project report entitled "OPTIMIZATION STUDY OF WATER-COOLED PV SYSTEM" prepared by YIP WEI HAO has met the required standard of submission in partial fulfillment of the requirements for the award of Master of Engineering (Electrical) at Universiti Tunku Abdul Rahman. The copyright of this report belongs to the author under the terms of the Copyright Act 1987 as qualified by the Intellectual Property Policy of Universiti Tunku Abdul Rahman. Due acknowledgment must always be given to the use of material contained in or derived from this report.
Lim Boon Han for their invaluable advice, guidance and his enormous patience throughout the development of the research. This project demonstrates a method to optimize a water-cooled PV system through software simulation to obtain the best design and then construction of the design.
General Introduction
Importance of the Study
Problem Statement
Aims and Objectives
Scope and Limitation of the Study
Contribution of the Study
Outline of the Report
Introduction
Literature Review
Water cooling
In Taiwan, Kuo et al. 2014) attempted to improve solar energy efficiency using a combination of concentrator photovoltaics and water cooling system. They chose a water cooling system because it was readily available and saves a significant amount of energy. A neural network was also created to predict when the water cooling system should be started or stopped by predicting the future photovoltaic output.
In 2015, Irwan et al. an indoor test performance for PV panels using water cooling. They found that there was a reduction of 5 – 23 ºC in the operating temperature, while increasing the power of the PV system by 9 – 22% compared to that without cooling (reference). The greatest increase in power was found to be analyzed the performance and effect of water cooling on a microgeneration system of solar energy in Brazil.
It was found that using the cooling system at a high radiation level caused a 12.26% increase in power and a 12.17% increase in efficiency. The water flow path was found to be random, however a valve solved the problem. Another method of water cooling is called evaporative cooling and was demonstrated by Haidar et al.
Water was led to the back of the PV panel using gravity in the system. In the same year, a jet collision system was applied directly to the back of PV panels using water as demonstrated by Abdulrasool et al. They tried to increase the efficiency of PV panels using a spray cooling system with a geothermal heat exchanger.
It was found that the UBHE system gave better results at comparable solar intensity conditions than the system without cooling and the cooling system without UBHE. The average net power and conversion efficiency for the panels without cooling system, with cooling system without UBHE and cooling system with UBHE are 33W at W at 6.87% and 35.8W at 7.38%, respectively. These results prove that a cooling system is important for a PV system to improve power and efficiency.
Nanofluid cooling
Another method of water cooling is called evaporative cooling and was developed by Haidar et al. up to 14% increase in electric power generation efficiency. The water used for cooling in their research was excessive, so an intermittent supply of water was suggested for future works. Despite the results, this system is unlikely to be practical due to the high price of water jets in the market.
The results could also be controversial because the sunlight was simulated and the heat of the sun and the simulated sunlight used would probably be different. These results prove that the cooling system is important for the PV system to improve its power and efficiency. higher PV cell output power at 37.9 W compared to water and cooling. It was also found that the power output increases as the volume flow rate increases.
This proves that the increase in nanoparticle concentration and flow rate would lower the PV surface temperature. In the same year, Abdallah et al. 2018) attempted to perform a performance analysis for a hybrid PV/T system using Multi Walls Carbon Nano Tubes (MWCNT) low concentration (water based) nanofluid. They achieved a 12°C temperature drop for the PV panel at 0.075% V of MWCNT and also at maximum incident radiation.
Pure water and different concentrations of MWCNT mixed with water were used for data acquisition. From this analysis, it was found that pure water performed weaker than MWCNTs at any concentration. They used ultrasound to atomize the working fluid available in the tank and transfer the cold vapor to the back of the PV module at different flow rates.
By atomizing 0.8 (w/v) nanofluid, the module's average surface temperature was found to drop to 57.25% while increasing the maximum power to 51%. Through their research, it was found that atomized nanofluid was more effective than atomized pure water. Other than that, increasing the nanofluid concentration will increase the cooling efficiency as well as the maximum power generated by the PV module.
Summary
This proves that nanofluids can be used as a substitute for water as coolants in PV systems, although more research should be done.
Introduction
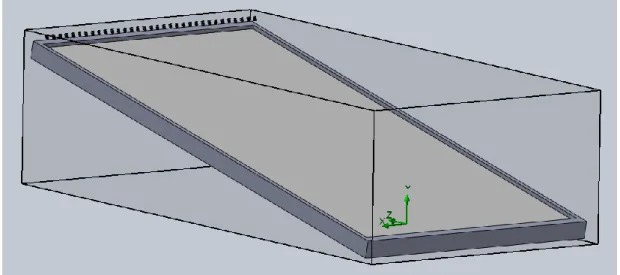
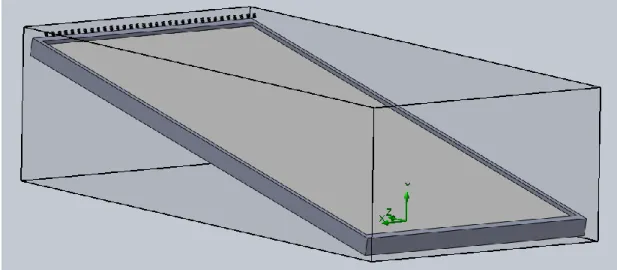
Simulation
Each hole (or slot) had to have its own flow rate determined based on a formula. For each case, the minimum, maximum, average temperature for the plate and the flow of water across the plate were taken.
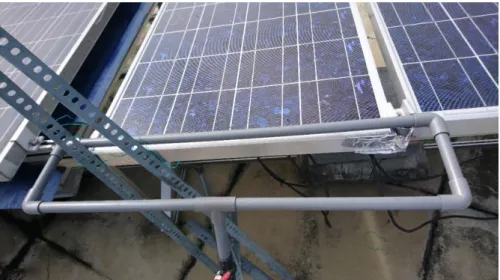
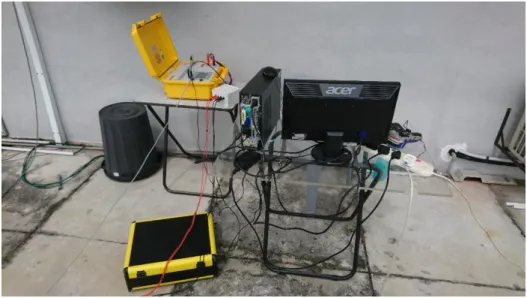
Construction
Simulation results
- Water outlet width while maintaining same number of water outlets
- Water outlet width while maintaining the same total outlet area
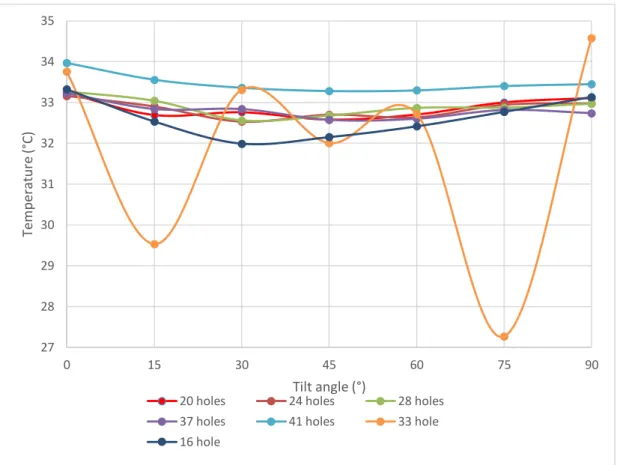
- Number of water outlets
- Water outlet height from the solar panel
- Choosing the setup for pipe fabrication
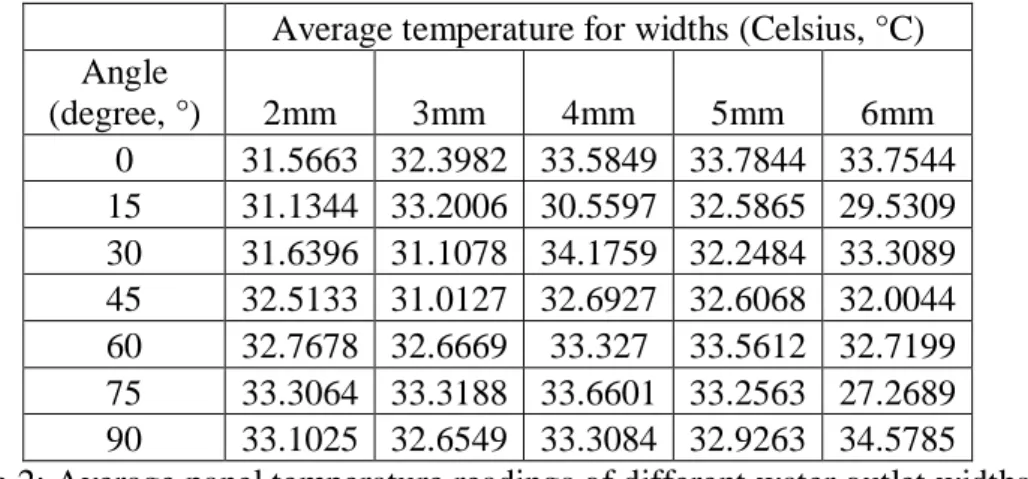
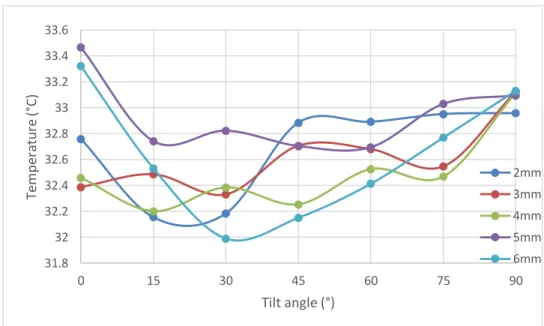
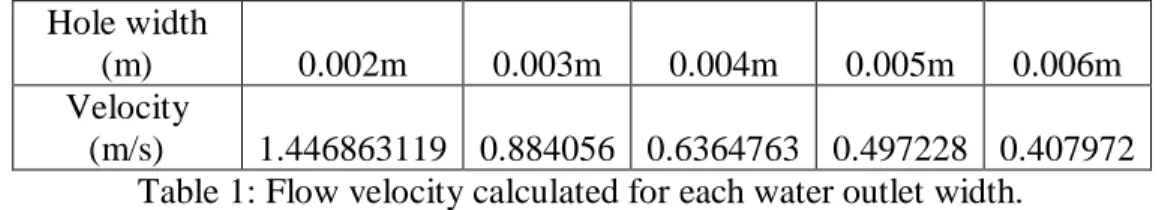
V vA, the following speed values have been determined for each outlet width and are shown below. The speed values are then used for the simulation and the following temperature values are obtained from them. Based on the graph, it has been found that the change of the temperature measurements at different tilt angles is not affected by the width of the water outlet.
This part of the study aims to match the inlet (15 mm diameter, which equates to m2) and outlet surfaces to maintain a constant flow. Increasing the width while maintaining the outlet area does not shift the graphs proportionally, as shown in the figure above. This part of the study looks at the effect of increasing the number of holes.
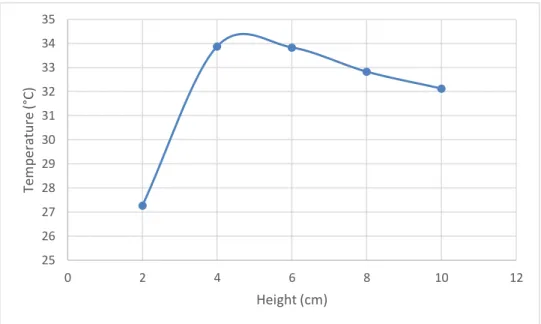
Since the best design for the previous two cases was 6mm wide, the hole widths would be the same here as well. The water outlet was increased at different heights (originally 2 cm from the panel) to the values shown in the table below. Based on the graph above, it appeared that the 2 cm increase produced the best result.
However, more data should have been taken at different heights to better understand the effect of the water outlet height on the cooling effect. Based on the several subsections above, the lowest temperature was 27.2689 ºC, which was achieved using the 33 hole 6 mm wide outlet tilted at 75 degrees. Thus, this design will be used in the construction of the setup of the solar panel system.
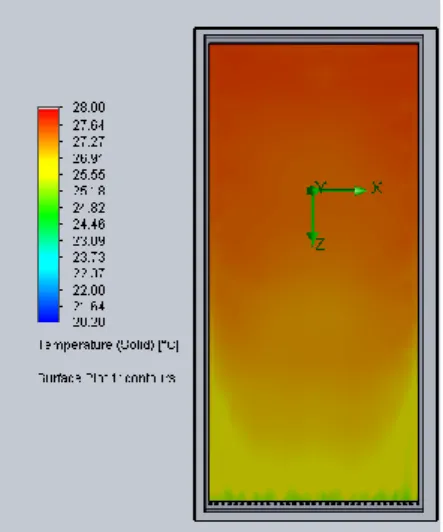
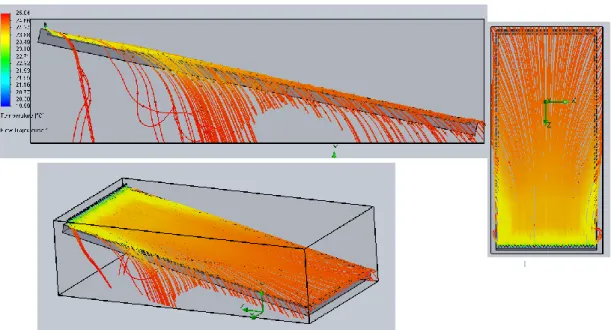
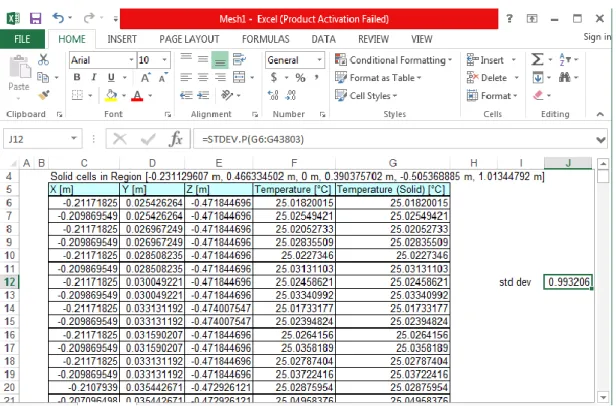
A mesh survey of the panel and water outlet was performed to determine the temperatures in each part of the panel and the results were exported to an excel file as shown below.
Construction of the PV system
Efficiency of cooled PV Efficiency of uncooled PV Temperature of cooled PV Temperature of uncooled PV. The power collected on day 1 shows a slight improvement of 90.16 W on the uncooled PV panel and 93.05 W on the cooled one. The average efficiency for the cooled and uncooled PV panel was found to be 10.165% and 8.4967%, respectively.
The graph of efficiency and temperature over time shows a correspondence where the warm temperature (uncooled panel) lowers the efficiency of the panel and vice versa. The graph of irradiance and temperature over time shows a relatively stable temperature, although the irradiance decreases over time. The graph of irradiance and power over time shows a proportional increase and reduction of power as the irradiance increases or decreases.
During this day the cooled panel produces more power than the uncooled panel, but in the afternoon the opposite is the case due to the bad weather. Time efficiency of cooled PV. Efficiency of uncooled PV. Temperature of cooled PV. Temperature of uncooled PV. The efficiency and temperature versus time graph shows that efficiency varies with temperature, where a higher temperature would cause a dip in efficiency.
A graph of power versus temperature over time shows that power is directly affected by temperature, at which a cooled PV panel performs better than. Based on the graph of power vs. temperature versus irradiance, it was found that cooling has a better effect when the irradiance is higher, producing more power than an uncooled PV panel. The graph of power over time shows only a slight increase in power on the cooled plate, while efficiency had about an average difference of 1%. A graph of efficiency versus temperature over time shows that the PV panel cooled at a lower temperature achieved higher efficiency compared to the uncooled one.
This will directly affect the output power as shown in the graph of power and temperature over time. This will affect the temperature of the panels as well, although the cooled one will usually have a lower temperature.
Conclusions
Recommendations for future work
Improved efficiency of photovoltaic panels by integrating a low heat exchanger spray cooling system with geothermal energy. Experimental study of cooling of photovoltaic (PV) panels using (TiO2) nanofluid in water-polyethylene glycol mixture and (Al2O3) nanofluid in water-cetyltrimethylammonium bromide mixture. Investigation of wind speed cooling effect on PV panels in windy locations, Renewable Energy, [E-journal pp.
Using high-frequency ultrasonic waves and nanofluid to increase the efficiency and cooling performance of a PV module.