Saikat Maitra, the author received endless guidance and support from them throughout the project period, especially in understanding the adsorption concepts and research aspects of the project. Finally, the author would like to thank his family members and friends with love for their moral support, encouragement and inspiration throughout the project period.
Significance ofProject
Moreover, the current use of activated carbon as the practical and common adsorbent used in the industries requires researchers to come up with other alternatives that are cheaper, easily available and more efficient.
Scope ofStudy
Sources ofMercury Exposure
- Drinking Contaminated Water
- Toxicityfrom EatingContaminated Fish
- Mercury Toxicityfrom Dental Fillings
- Mercury Toxicityfrom Vaccinations containing Thimerosal
The maximum level of mercury in drinking water allowed by the EPA is 2 parts per billion. This is one of the main sources of mercury poisoning and one that has attracted a lot of attention recently.
Effects ofMercury 2.13.1 Health Effects
- EnvironmentalEffects
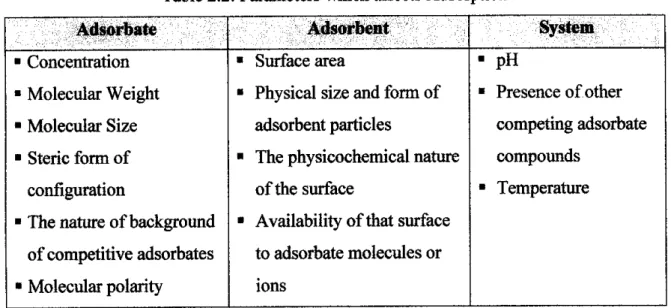
- Characteristics ofAdsorbate
- Characteristics ofAdsorbent
- Characteristic ofSolutions
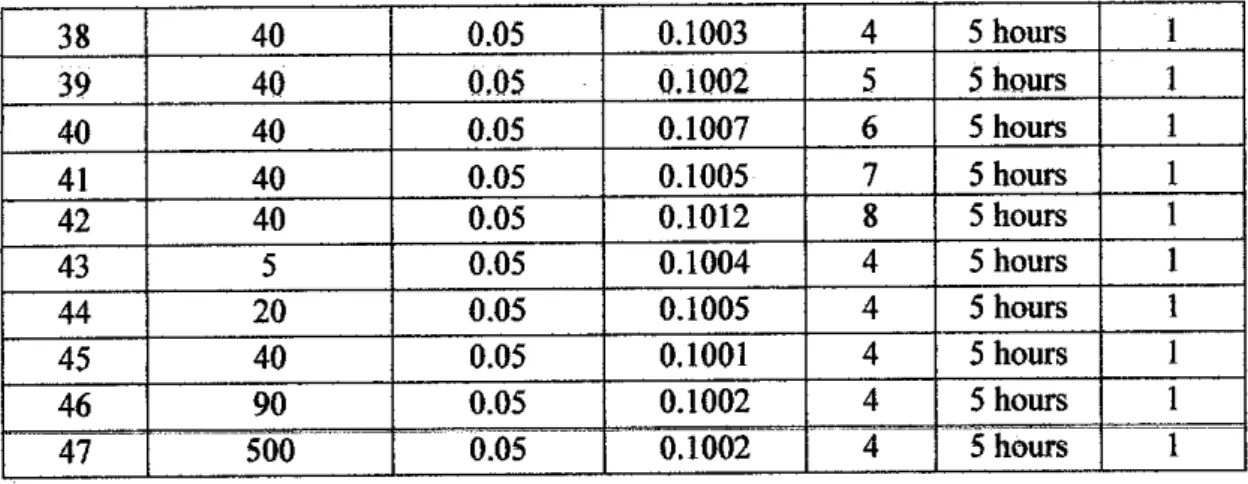
It involves a reaction between the adsorbate and the adsorbent causing a change in the chemical form of the adsorbate. Referring to the research paper entitled sorption of lead ions from aqueous solution by chickpea leaves, stems and fruit peels, different amounts of adsorbents (varying in the range of 0.05-0.4 g/100 ml solution) with the same initial adsorbate concentration (200 ppm) were used to optimize the required amount of adsorbent under the described conditions (temperature, 30°C; stirring speed, 150 rpm; pH, 6.0) to obtain a maximum adsorption capacity and 53.26 % for leaves, stems and fruit peels, respectively) was achieved when 0.3 g/100 ml of each of the different types of adsorbent studies were used.
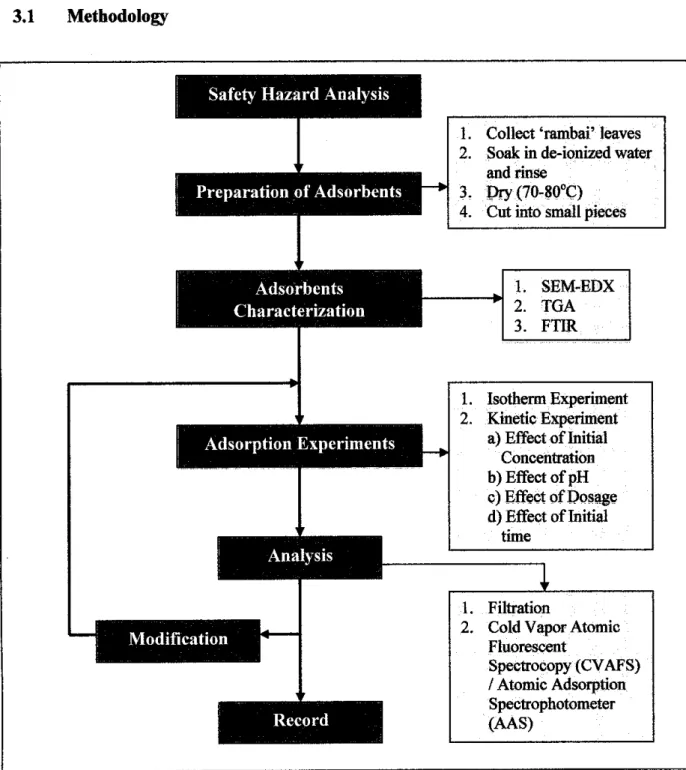
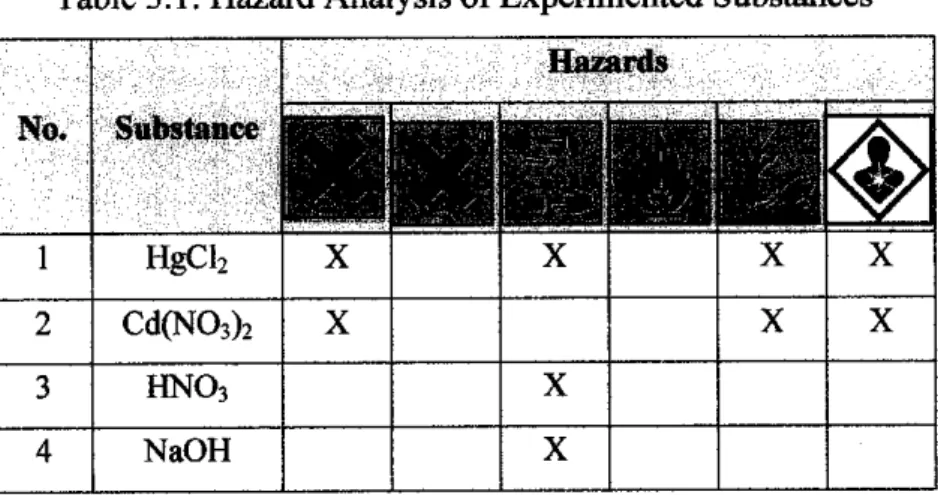
Safety Hazard Analysis
Before the actual experiment is conducted, emphasis is first placed on the safety hazard analysis of the substances and equipment used, purely for safety purposes. The raw material ('rambai' leaves) required for the preparation of adsorbents was collected from Kuala Lumpur, Malaysia. It is first soaked and rinsed in deionized water at room temperature 24°C-26°C for 1-2 hours until clean or colorless.
To understand the features of the adsorbent or 'rambai' leaves that affect the absorption phenomena, its characterization has been studied. For this, several devices are used in the form of Scanning Electron Microscope (SEM), Fourier Transform Infrared (FTIR) and also Thermal Gravimetric Analyzer (TGA).
Sorption Procedure
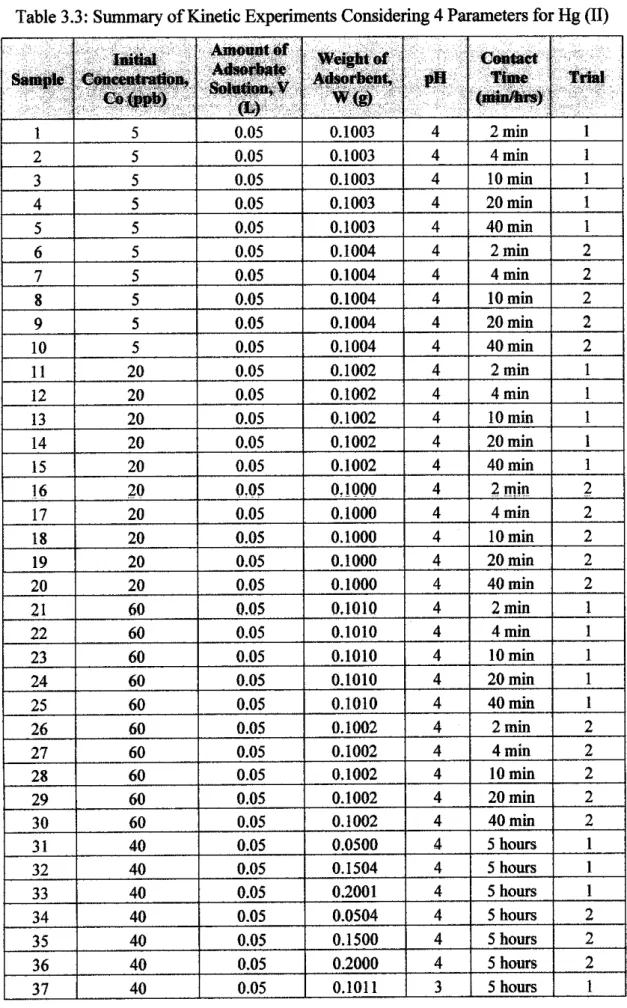
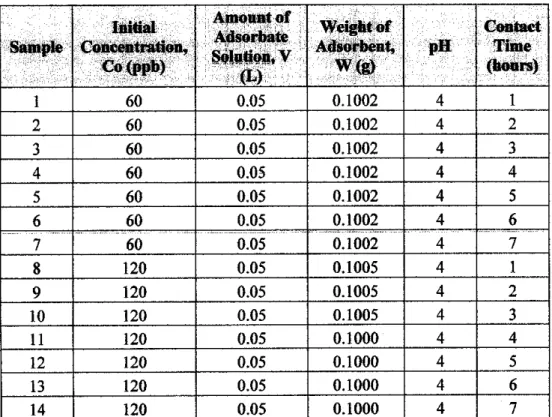
Initially, to determine the time for sorption to reach equilibrium, samples with Hg(II) concentrations of 60 and 120 ppb are stirred for 1 to 7 hours, with samples taken during each hour, respectively. These isothermal experiments are carried out with a pH value of 4 and an amount of adsorbent of 0.1 g at room temperature. To observe and investigate the reproducibility of experimental behavior and results, several experiments are repeated.
Kinetic experiments consider the study of the effect of 4 parameters, which are, initial concentration, pH, initial contact time and adsorbent dose. Additional experiments are also performed to determine the adsorption capabilities of the adsorbent with the other heavy cadmium, Cd (II). This batch of experiments is carried out in order to determine the equilibrium time and the effect of the initial concentration.
As observed, the initial concentration for the Hg(II) and Cd(II) solution is specified in terms of ppb and ppm, respectively. This is because the relevant concentration units are used in the industries for these specific heavy metals. Therefore, no direct comparison can be made between both heavy metals in terms of quantitative amount of adsorption.
Analysis
From the obtained SEM images (Figure 4.1), it is obvious that the surface is quite porous in its structure. It should also be noted that acids are responsible for providing protons upon ionization in aqueous solutions, which can further open the pores of the adsorbent, increasing the surface area, resulting in higher adsorption capacity. Thus, decreasing the pH of an aqueous solution will make the solution more acidic and theoretically increase the adsorption capacity.
SEM with EDX (Energy Dispersive X-ray Spectroscopy) is also performed to determine the composition of the adsorbents.
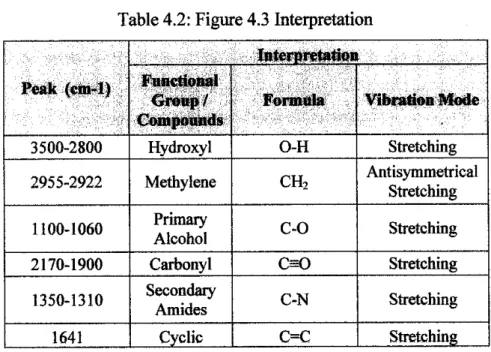
FTIR Analysis
This surface complex, among others that could be formed, would increase the chemisorption of mercury on the surface of the adsorbent and lead to an increase in adsorption capacity.
Decomposition Kinetics Using TGA
In the initial phase, the adsorption process was fast due to the availability of abundant free sites near the surface, where the approach of the metal ions faced less hindrance. With the passage of time and the decrease in the availability of active sites near the surface, the metal ions had to diffuse into the pores ('rambai' leaves) of the adsorbent through the interconnected pores and channels. It can be safely considered that the adsorption process reaches equilibrium after 5 hours as observed in Figure 4.7, where the optimum.
This is due to the fact that at lower initial concentrations of Cd (II) enough adsorption sites are available for the sorption of metal ions. Four different doses of adsorbent 0.05 g, 0.1 g, 0.15 g and 2.0 g are used to study its effect on the adsorption capacity of the adsorbent ("rambai" leave). This decrease in removal percentage with increase in adsorbent dosage can be attributed to the formation of clusters of "rambai" leaf particles, resulting in a decrease.
Langmuir developed a theoretical equilibrium isotherm that describes the amount of gas adsorbed to a surface due to the pressure of the gas. The nature of the sorption process depends on the physicochemical characteristics of the adsorbent and system conditions such as temperature, pressure, etc. This behavior can be attributed to the use of available adsorbent sites on the surface of the adsorbent.
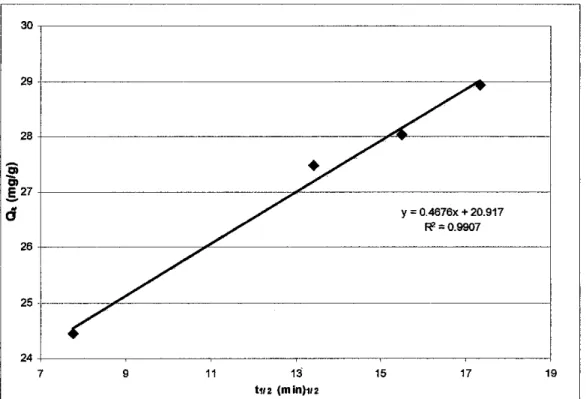
As can be seen in Figure 4.16, the obtained linearity plot shows the applicability of kinetics of the order (l/m) for the observed system. The adsorption rate constant was calculated from the intercept and slopes of the straight lines and is listed in Table 4.6.
![Figure 4.5: TGA Kinetics The approach assumes the basic Arrhenius equation [8],](https://thumb-ap.123doks.com/thumbv2/azpdforg/10269613.0/42.829.129.720.99.453/figure-tga-kinetics-approach-assumes-basic-arrhenius-equation.webp)
Intra-particle Diffusion Study
The 'rambai' leaves described in this research work show rapid kinetic exchange as well as proven to be effective in removing metals. As noted in Table 4.10, the removal performance of 'rambai' is comparable to most currently available adsorbents. Removal of Hg (II) ions from aqueous solution can be achieved through the use of low-cost adsorbents, which are readily available.
Rambai leave, which is readily available agricultural waste in Malaysia, has been investigated as adsorbent materials for the removal of Hg(II) ions from aqueous solution. The research also found that 'rambai' leaves are very effective in removing Cd (II). Thus, it can be concluded that "rambai" leaves can be successfully used for the treatment of industrial wastewater containing Hg (II) and Cd (II).
There are few additional improvements and recommendations that can be made experimentally wise to further establish the effectiveness of 'rambai' leave as an adsorbent. McKay, Sorption of lead ions from aqueous solution by chickpea leaves, stems and fruit peels, Adsorption Science and Technology, 2006, Vol. Ajay Kumar Meena, G.K Mishra, Satish Kumar and Chitra Rajagopal, Low cost adsorbents for the removal of mercury (II) from aqueous solution - A.
Ajay Kumar Meena, G.K Mishra, Satish Kumar and Chitra Rajagopal, Low-Cost Adsorbents for the Removal of Mercury (II) from Aqueous Solution - A
Nadeem, Comparative Evaluation of AdsorptionKinetics and Isotherms of a Natural Product Removal by Amberlite Polymeric Kinetics and Isotherms of a Natural Product Removal by Amberlite Polymeric Adsorbents, Chemical Engineering Journal, 2008. Amir Hossein Mahvi, Dariush Naghipour, an, Tehrhok Naghipour, Forughipour, and Tehrahiz Nadeem. Adsorbent for Heavy Metal Removal from Industrial Wastewaters, American Journal of Applied Sciences, 2005. Younas Khkhar, Shujaat Ahmed, Functionalized Sol-Gel Material for Extraction of Mercury (II), Reactive &.
De Long and P.C Trulove, TGA Decomposition Kinetics ofl-Butyl-2,3-dimethylimidazolium Tetrafluoroborate and the Thermal Effects of Contaminants, Naval Research Laboratory Chemistry Division, Washington DC 20375. Yamini and M.T Jafarzadeh, Removal of Waalstewater from Industry Using Acetobacter xylinum Cellulose, American Journal of Environmental Sciences. When working with an experiment, open the shield so that the exposure of the experiment is minimized.
Dispose of broken glasses in the appropriate glass waste container (e.g. plastic waste container, broken glass bag). Amount of Hg ion absorbed by Rambai leaves as a function of initial contact time and initial concentration (trial 1). Amount of Hg ion absorbed by Rambai leaves as a function of initial contact time and initial concentration (trial 2).
SEM-EDX
LPD Lab Services has extensive experience using SEM/EDX in the following industry sectors; electronics and semiconductors, pharmaceuticals, rwtrochemicals, plastics and polymers, etc. Image Magnification, Measurement and Resolution: The image is of the surface of a metal stamp used to imprint the information on a CD during manufacture. The photograph illustrates the shape and structure of individual pieces of formation. The height, roughness and steepness of the sidewalls of the information are all essential to the production of a good disc, as is the separation between adjacent tracks.
The second image is of a fracture section through a pellet made of tungsten powder that has been sintered and then coated with an osmium and ruthenium alloy. The output from both the secondary electron and backscatter detectors is mixed together in the SEM to highlight the sputtered layer on the pellet surface. This enables accurate measurement of the thickness of the sprayed layer and shows the growth structure through the layer.
EDX analysis was performed on a thin evaporated layer on top of a nickel/iron alloy.
CVAFS
FTIR
Nevertheless, the resonance frequencies in the first approach can be related to the bond strength and the mass of the atoms at both ends. More complex molecules have many bonds and the vibrations can conjugate, leading to infrared absorption at characteristic frequencies that can be associated with chemical groups. From this, a transmittance or absorbance spectrum can be produced, showing at which IR wavelengths the sample absorbs.
The second method is to finely grind a quantity of the sample with a specially purified salt (usually potassium bromide) (to remove scattering effects from large crystals). This allows the effects of the solvent to be negated (the reference is usually a pure form of the solvent the sample is in). The instruments are now small and can be transported, even for use in field trials.
By measuring at a specific frequency over time, changes in the nature or amount of a particular bond can be measured. This will mean that highly trained experts (also called 'noses') can be used more sparingly with a significant cost saving. A derived weight loss curve can be used to tell the point where weight loss is most evident.