Various fluid phases flowing from the reservoir rock to the surface and complex reservoir characteristics must be considered for hydrate formation. The prediction of hydrate formation in the "hydrate risk" zone is complicated by a number of factors. For this reason, the hydrate formation in subsea gas transmission pipelines must be effectively and economically prevented to ensure that the pipelines function normally.
Gas hydrate formation can be prevented by several methods, such as thermal methods, thermodynamic inhibitors and low dose hydrate inhibitors. Methanol and ethylene glycol are the thermodynamic inhibitors that cause the hydrate formation sites to shift to the left, moving the hydrate formation point to a lower temperature and/or a high pressure. The deeper a system operates in the hydrate region, the shorter the time during which kinetic hydrate inhibitors can slow hydrate formation.
![Figure 2.1: Typical hydrate formation diagram [1] .](https://thumb-ap.123doks.com/thumbv2/azpdforg/10313410.0/5.918.209.751.100.515/figure-2-1-typical-hydrate-formation-diagram-1.webp)
Riser (Theory)
The sections on riser stability discussed straight upright risers, which showed that the clogging phenomena were dependent on the height of the riser in combination with the length of the pipeline upstream of the riser. There will also be different slip between the phases at the bottom of the risers compared to a vertical riser. A third effect is the effect of the lack of a steep riser angle at the base of the riser.
As well as steel casing and gravity-fed concrete structures, rigid risers have been used on compatible towers (Lena, Baldpate), TLPs and sparring platforms (Neptune). The ability of rigid risers to accommodate horizontal platform movements increases with water depth. A potential advantage of the simple and lazy waveguide configurations is that the pipe lies parallel to the seabed and therefore does not necessarily require the installation of a riser base. Basically, the lower part of the riser consists of either a single rigid tube or a larger diameter vertical cylinder housing a bundle of smaller production tubes.
Flow Patterns
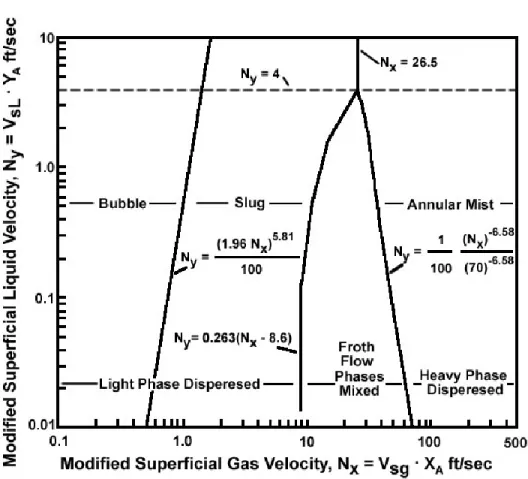
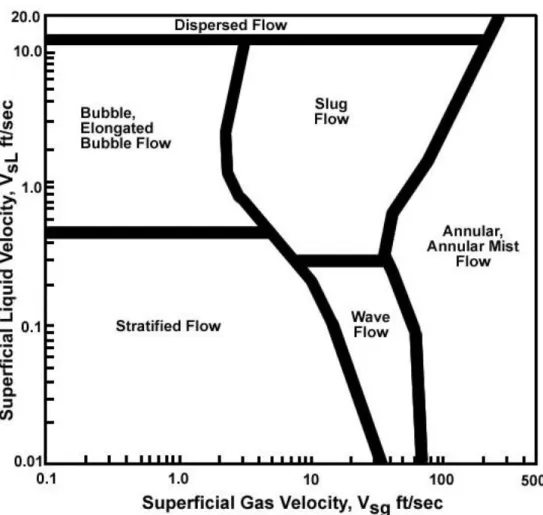
By knowing the xy coordinates through calculation, the type of flow can be determined from Figure 2.6. b) Vertical flow. The coordinates for this flow map are the same as for Mandhane map in Figure 2.6 except that the fluid property correction is used. It was first reported that vapor-liquid interfacial tension of a pure compound is related to the density difference between the phases as,.
The constant of proportionality, P, known as parachor, has been extensively discussed by Sugden, as a parameter representing the molecular volume of a compound under conditions in which the effect of temperature is neutralized. The parachor values of several pure compounds have been determined from measured interfacial tension data, using equation 2.7, known as the Macleod-Sudgen equation, reported by several researchers.
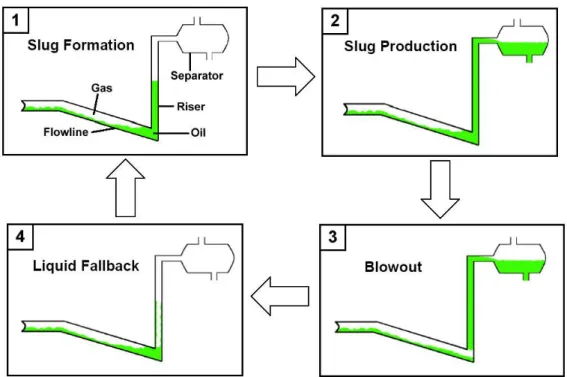
Severe Slugging
As shown in Figure 2.8, this is the cyclic process of the severe throat formation in the riser. The phenomenon shows the cyclical production of liquid and gas together with cyclical pressure fluctuations in the pipeline. The pressure in the pipeline then increases as more liquid accumulates at the base of the pipeline, increasing the size of the liquid slug.
It is essential to understand what the problems may be if there is severe blockage. Severe slugging will cause the unexpected type of flow and this occurred at higher deliveries. However, gas boosting must be controlled to avoid serious blockages in the oil pipeline.
The Flow Chart of the Horizontal Flow and Vertical Flow Calculation
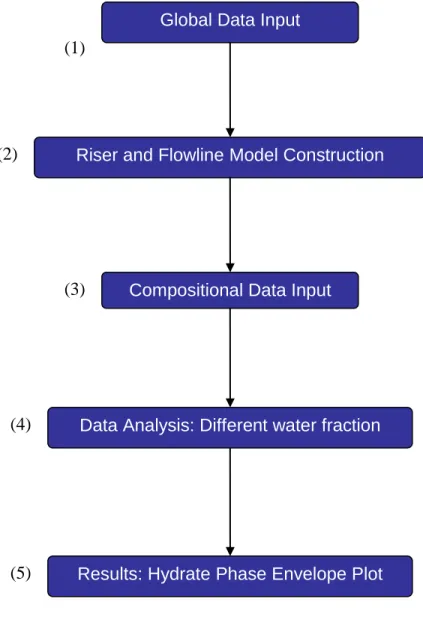
The Flow Chart of Generating Hydrate Phase Envelope using PIPESIM
The fluid type model selected is the Black Oil Model; the selected operation type is System Analysis; and the chosen flow correlations are Govier, Aziz, Fogarassi for vertical flow correlation, while Beggs & Brill is revised for horizontal flow correlation. It is to analyze when the sI hydrate structure, the sII hydrate structure and the ice will be formed. In addition, it is also to analyze the expansion of the hydrate risk area due to the increased water fraction. e) Step (5) is the result of the results which will be reported in Chapter 4.
Flow Patterns in Horizontal Flow and Vertical Flow
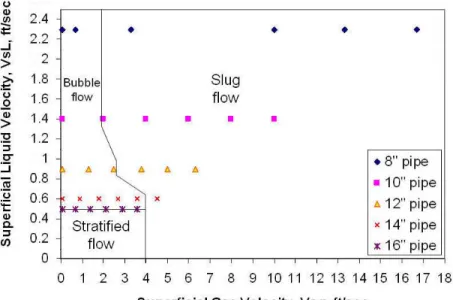
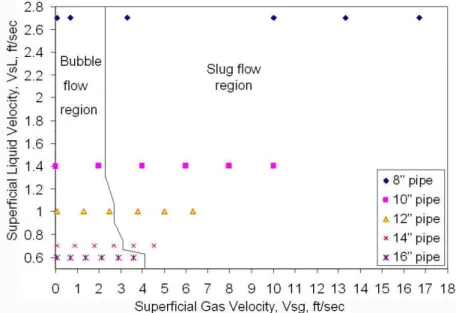
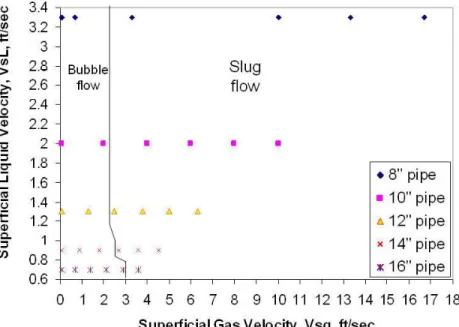
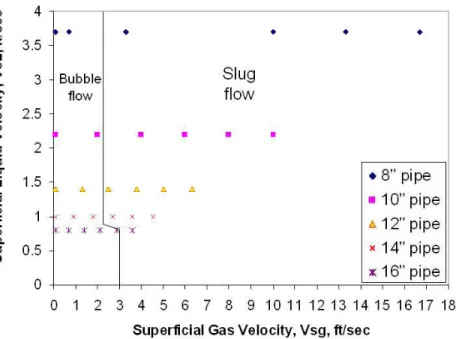
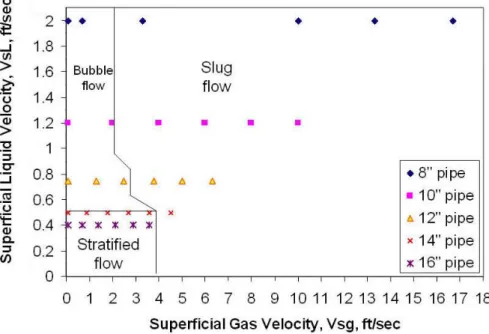
Below Vsg 4 ft/s, 8” to 12” pipeline experiences bubble flow, but 14” and 16” pipeline experience stratified flow because they are below VsL 0.5 ft/s. Based on Figures 4.1a to 4.1e, they can be summarized that as the oil flow rate increases from 9,000 bpd to 17,000 bpd, the impact flow slowly dominates the bubble flow as Vsg decreases. This indicates that the presence of gas in oil production contributes to the formation of slug flow.
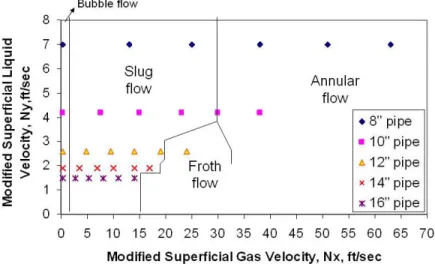
The values in Figure 4.1a through Figure 4.1e used to draw that graph can be obtained from Appendix F. Additionally, 8” to 16” pipeline experiences bubble flow at Nx of 0.1 ft/s regardless of any values of Ny. For annular flow, only 8” and 10” pipeline that has more than 30 ft/s Nx fall into the annular flow region.
This is because when the gas flow rate increases, the annular flow starts to dominate the flow from the smaller inner diameter of the pipe and so on. Due to insufficient fluid flow rate data, the oil flow rate was taken from the expected production flow rate of 120,000 bpd from 9 risers. The average production flow rate of 13,000 bpd converts to 0.8 cuft/s as the oil flow rate.
The gas flow rate is set from 1cuft/s to 5cuft/s with a step of 1cuft/s in the type of flow calculations.
Hydrate Phase Envelope
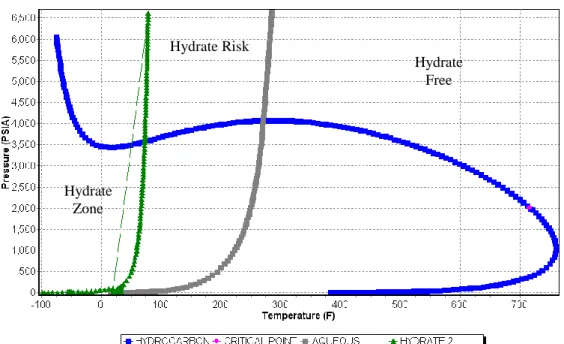
The hydrate formation curve (green curve) and hydrate dissociation curve (grey curve) started to appear when the water fraction is increased to 0.1% bbl/bbl of water fraction in Figure 4.2b. The water fraction is then further increased to 50% bbl/bbl of water fraction where the sI hydrate structure (orange curve) is formed. At 90% bbl/bbl and beyond there are no results due to the software not being able to run the hydrate model as shown in Appendix G.
These simulations show that in the presence of water in the gas production, hydrate formation tends to occur at a certain temperature and pressure. The preferred temperature for the pipeline operating condition is the temperature to the right of the hydrate disassociation curve (gray curve). This proved that a higher operating temperature is required for the pipeline to enter the hydrate-free region.
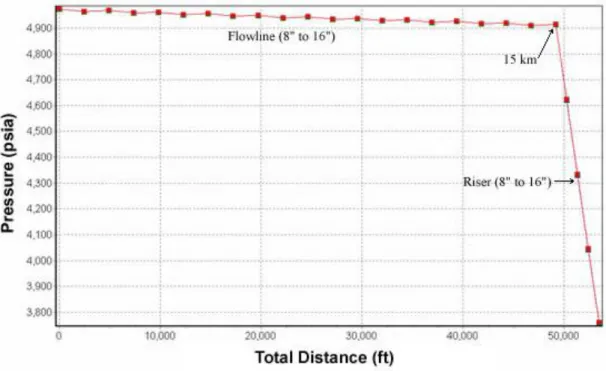
The Effect of Pressure and Temperature along the Flowline and Riser
At the end of 15 km the temperature in the riser dropped tremendously due to the height of the 1300m riser. The heat losses are due to the extraction of internal energy (related to the temperatures of the fluids) to potential energy and to a lesser extent kinetic energy. In addition, some internal energy is used for the expansion of the fluids on the riser and for latent heat evaporation.
Based on figure 4.3b, it shows that the higher the internal diameter of the pipe, the lower the temperature due to the larger surface area in the pipe. Therefore, methods for pipeline maintenance should be adopted such as pipeline insulation or hot water circulation in the pipeline ring. This is because the height is assumed to be almost the same along the 15 km streamline.
But the pressure drops as the liquid moves upwards to the top of the riser, which is due to the drop in height (from the seabed to the surface). Based on Figure 4.3d, it shows that the smaller the inner pipeline diameter, the higher the pressure drop. As shown in Figure 4.2d, in addition to the guest molecules necessary for hydrate formation, a certain temperature and pressure must coexist.
Conclusion
As noted, the lowest temperature in the riser is about 160 ˚F and the highest pressure in the riser is about 5,000 psia. By understanding the operating temperature and pressure, this information will be used in the hydrate phase envelope in pipeline design.
Recommendations
Therefore, it is difficult to justify what percentage of the water content should be used in the pipeline design. In this study, the lowest temperature in the riser is approximately 160 ˚F and the highest pressure in the riser is approximately 5,000 psia. Therefore, the designed pipeline must be able to withstand a pressure of 5,000 psia and operate at least about 750 ˚F. Such conditions will prevent hydrate formation from occurring in the pipeline.
Although the study has provided the operating conditions for the design of the gas pipeline, such information is considered to be still insufficient. Therefore, further investigations or studies such as the cost of fabrication and the types of material to be used for the riser should be included in the pipeline design phase. This study provides the preliminary step for further study of the flow characteristic in the deep water environment.
The current study is still considered as the primary stage, the heavy slugging simulation should be carried out through simulation or experiment. Appendix E: Horizontal Flow and Vertical Flow Calculation Steps .. a) Determine the interfacial tension value based on the hydrocarbon component (Appendix D). Using the Mandhane horizontal flow regime map, the flow type is identified based on the value of VsL and Vsg. f) Using Aziz et al.
Vertical flow regime map, the type of flow is identified based on the value of Nx and Ny. g). The type of flow for horizontal and vertical flow is tabulated in the table. h) Step a – f is repeated with different internal pipeline diameters. Appendix F: Results of horizontal flow and vertical flow calculation .. a) Results of horizontal flow and vertical flow at 9,000 bpd oil.
Gas flow rate Horizontal flow Vertical flow. b) Horizontal and vertical flow results at 11,000 bpd oil. Gas flow rate Horizontal flow Vertical flow. c) Horizontal and vertical flow results at 13,000 bpd oil. Gas flow rate Horizontal flow Vertical flow. d) Horizontal and vertical flow results at 15,000 bpd oil.

Total distance versus pressure