I hereby declare that I am responsible for the work submitted in this project, that the original work is mine except as specified in the references and acknowledgments, and that the original work contained herein was not performed or performed by anyone other than -specified sources or persons. . This article focuses on the humidification-dehumidification (HDH) process due to its high efficiency and low environmental impact. A correlation between temperature and water production is calculated and therefore used to obtain the optimal temperature for the process.
Thanks to the Chemical Engineering Department at Universiti Teknologi PETRONAS (UTP) for organizing such a project. Thanks to the Graduation Project Committee for organizing lecture series as support knowledge for the team. Special thanks to the lecturers from UTP who generously contributed their expertise to this project.
INTRODUCTION
- Water and Desalination
- Project Background
- Problem Statement
- Objectives
- Scope of Project
The water crisis is a very serious problem that has recently received a lot of attention from the world. In industry, fresh water is used as a cooking medium for equipment such as reactor and cooler. However, these conventional techniques require large amounts of energy in the form of thermal energy or electrical energy, which is usually generated using fossil fuels, causing negative effects on the environment such as an increase in the ecological footprint and because the world is now on towards a greener economy. technology, renewable energy-based desalination is used, such as solar desalination process [10].
Therefore, the focus of this project will be on this technique where further analysis of the process will be observed and therefore various appropriate modifications will be applied. Water is a very essential resource not only for humans but also for every living thing on the planet. Although water actually covers almost 70% of the earth's surface, there are still many places facing water crisis problems and the poor wastewater management that comes from domestic or industrial sources has further increased the problem and to solve the problem therefore, a desalination process is proposed. The scope of research in this project actually covers several aspects that will be used as a basis for the experimental research of the project.
LITERATURE REVIEW
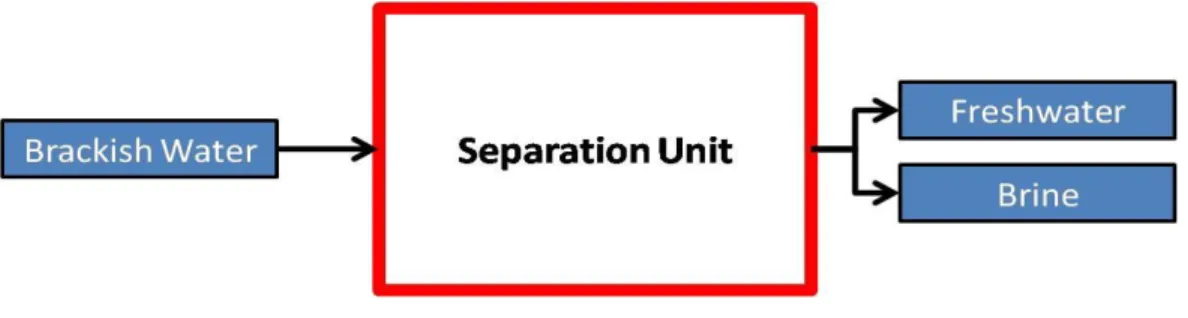
- Desalination Process
- Membrane Separation
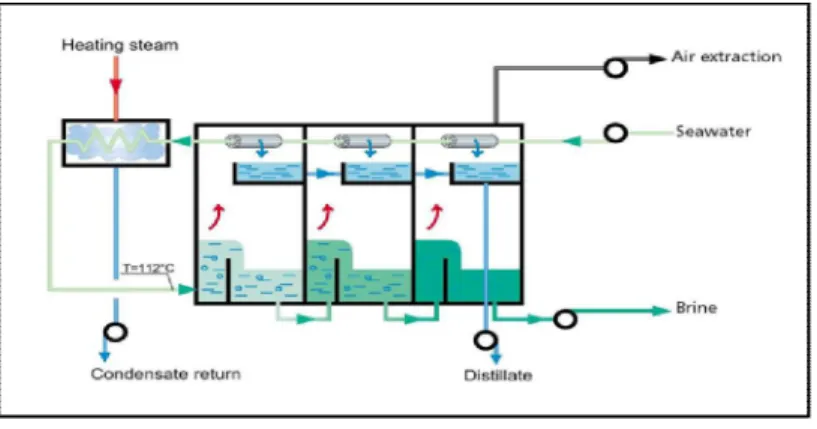
- Thermal desalination
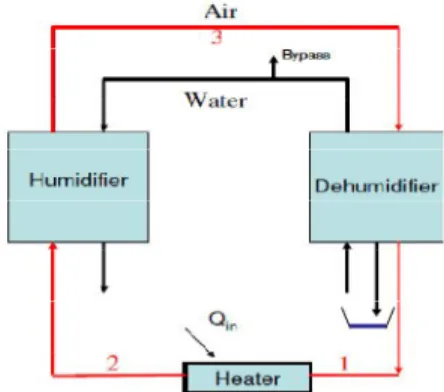
- Humidification Dehumidification (HDH) Process
- HDH Process Classification
- Proposed HDH Process Modification
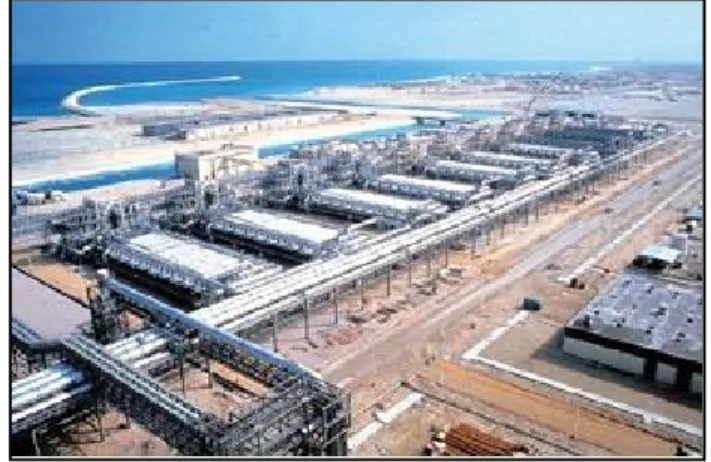
The Tampa Bay plant runs on about 12% of the Jebel Ali desalination plants' output. The pressure of the system is usually reduced so that the temperature required for cooking is reduced. One of the main limitations of thermal technologies is the energy requirement of the evaporation step.
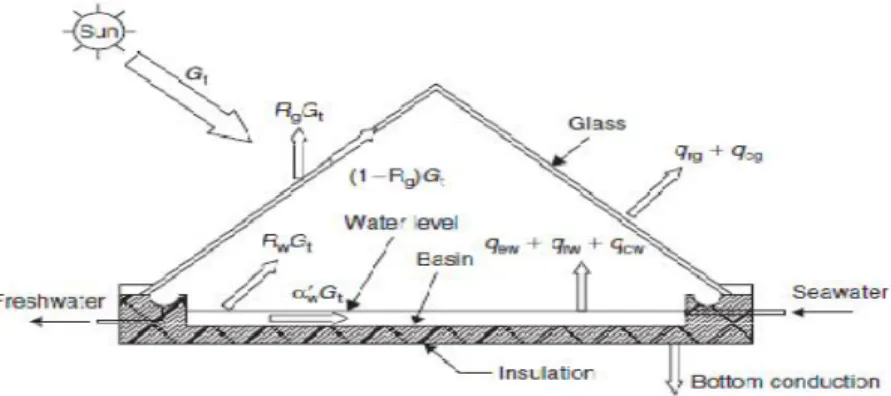
In the water cycle, the heat or energy provided by the sun will evaporate some of the seawater, creating salt-free water vapor. Solar energy is still one of the non-conventional methods to desalinate brackish water or seawater. In the solar still, the sun's rays will pass through the glass roof and be absorbed by the blackened bottom of the basin.
The resulting water vapor condenses on the underside of the roof and flows down into the troughs, which convey the distilled water to the tank. The inner surface of the base, known as the basin lining, is blackened to efficiently absorb the solar radiation falling on it. Despite the ease of the process, there are still a few problems encountered with the solar season concept.
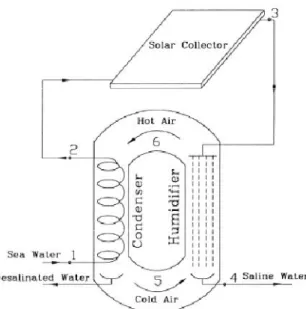
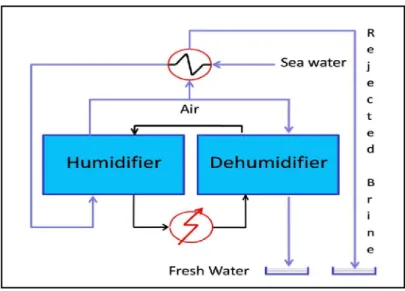
Due to the design of the distillation apparatus itself, not all water droplets formed will go to the collection tank, as some of the water droplets fall back into the still [20]. The cycle configuration of the HDH process can be either closed air open water system (CAOW), where the air is heated and circulated in a closed circuit between the humidifier and dehumidifier, or closed water open air system (CWOA), where the air is heated, humidified and partially dehumidified and closed out in an open cycle [22]. Based on the analysis, it has been shown that there are few common features of the process that will leave room for improvement.
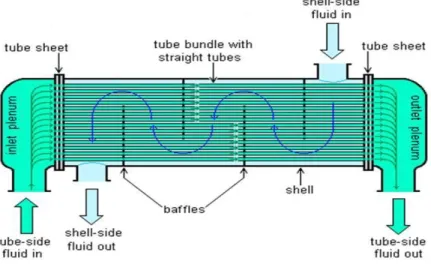
One of the identified features is that in the normally used HDH process, the rejected brine stream is usually routed directly to the cooling tank. By installing a simple heat exchanger for the rejected brine stream, we can use the energy of the brine stream, which is in the form of heat, to increase the temperature of the freshwater stream flowing into the humidifier. In addition, the surface of the device should adopt the fin-like surface shape, which increases the heat transfer surface area and thus increases the amount of heat transferred from the hot air to the cold seawater flow in the humidifier and from the hot air. fresh water flows to the cold air in the dehumidifier.
METHODOLOGY
- Methodology
- Research and Data Gathering
- Process Design
- Evaluation and Verification
- Project Gantt chart
To carry out this project, it is important to fully understand the concept of humidification and dehumidification (HDH). In this phase, the design of the HDH process must be identified and an analysis is performed to find the advantages and disadvantages of the process. By doing this, some change will be made to the process design, theoretically improving the performance of the process.
As mentioned earlier, based on the analysis made on the current existing process, some modifications will be made to the currently used design to increase its performance. Among the proposed modifications to the process are to adapt the heat exchanger concept, to run the process at vacuum condition and also to insert an additional heat exchanger into the process. The simulation process is actually divided into three where the simulation in the first run will study the effect of the temperature on the system while keeping the pressure constant at atmospheric pressure.
Pairs of temperature points were used to obtain the data variation pattern for further analysis. The data must then be analyzed and on the basis of this a decision must be made whether to proceed with the change or not. This goes for all simulation runs whereby the data must be analyzed and therefore a decision must be made to either proceed with the change or not.
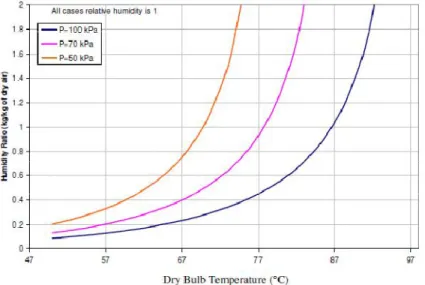
As for the second part of the simulation, the focus here is on identifying the effect of pressure variation on the system. Based on the research done in the first phase of the project, conducting the process in vacuum condition should help the process increase the amount of freshwater yield. Couples of pressure points are used to obtain the variation pattern and therefore the analyzes of the data are carried out accordingly.
In the final stage of the simulation, both temperature and pressure will be used as the manipulated variables, the aim here being to identify the optimal temperature and pressure that will give us the predetermined freshwater production.
RESULTS AND DISCUSIONS
- Simulation Process
- Production Target
- Temperature Variation Effect
- Pressure Variation Effect
- Optimum Process’s Temperature and Pressure
Using these statistics as a basis, the target production of fresh water per day will be 0.25 m3. From the simulation performed, a clear relationship can be observed between two variables, namely the temperature of the seawater in the humidifier and also the amount of freshwater output. As the seawater temperature in the humidifier increases, the higher freshwater output will increase. . Therefore, a simulation process via the Aspen HYSYS simulator was carried out to determine the optimal temperature that will give us the targeted production of fresh water of 0.35 m3.
The result clearly shows that temperature plays an important role in determining the amount of fresh water produced. The nearest and highest freshwater production in this case is achieved at a temperature of 90 0C, or 0.237 m3. This indicates that to achieve the target production, the temperature of the process must be between 100 °C and 90 °C.
Therefore, another simulation was performed to find the exact temperature that would allow the system to produce 0.35m3 of fresh water. Therefore, to get the exact value of the temperature that will give us the targeted production, a regression analysis technique is used where a correlation that connects these two variables; the amount of fresh water produced and the temperature generated. As the calculation shows, the corresponding temperature that will give us the desired freshwater production is 92.5340C which falls within the estimated value made earlier.
Therefore, in order to find the appropriate pressure that will allow the process to reach the target production, another simulation process was carried out with a range of pressure variation values from 90 kPa to 101.325 kPa. Here it is observed that as the pressure increases, the yield of fresh water will decrease. Regression analysis has now been done to identify the pattern of data distribution where it will be used to determine the exact pressure that will allow the process to achieve the target output.
Therefore, the corresponding pressure that can meet the predetermined amount of fresh water is 99.507 kPa. From this data it is clear that by reducing the pressure to 90 kPa the system will be able to achieve the target production, namely 0.35 m³ of fresh water at a much lower temperature, namely 90 °C, compared to the temperature was necessary when the pressure was still low. set to 101.325 kPa, which is 92.534 0C. Based on the calculation, the corresponding temperature at which the process can achieve the target production is 92.11 0C, which gives us a total temperature reduction of 0.424 0C compared to the water flow temperature of 101.325 kPa.

CONCLUSION AND RECOMMENDATIONS
Al-Timimi, Solar desalination based on the humidification process: I - evaluation of heat and mass transfer coefficients, Energ.
Energy Classification of Desalination Process