“TJAssist : Car Autopilot System to Assist Driver on Traffic Congestion”
By
Chong Vun Vui 16523
A dissertation submitted to the
Information and Communication Technology Program Universiti Teknologi PETRONAS
In partial fulfilment of the requirement for the BACHELOR (Hons) OF TECHNOLOGY
(INFORMATION & COMMUNICATION TECHNOLOGY)
Universiti Teknologi PETRONAS Bandar Seri Iskandar
31750 Tronoh
Perak Darul Ridzuan
ii
CERTIFICATION OF APPROVAL
TJAssist :
Car Autopilot System to Assist Driver on Traffic Congestion
by Chong Vun Vui
A project dissertation submitted to the
Information & Communication Technology Programme Universiti Teknologi PETRONAS
In partial fulfilment of the requirement for the BACHELOR OF TECHNOLOGY (Hons)
(INFORMATION & COMMUNICATION TECHNOLOGY)
Approved by,
___________________
(DR. SHUIB B BASRI)
UNIVERSITI TEKNOLOGI PETRONAS TRONOH, PERAK
May 2015
iii
CERTIFICATION OF ORIGINALITY
This is to certify that I am responsible for the work submitted in this project, that the original work is my own except as specified in the references and acknowledgements, and that the original work contained herein have not been undertaken or done by unspecified sources or persons.
_____________________
(CHONG VUN VUI)
iv ABSTRACT
This project is about a car autopilot system which take over driving during traffic jam condition. As traffic jam is very serious in Malaysia especially in major cities like Kuala Lumpur, this system will be able to help the driver to utilize the time during traffic jam to conduct other works. The reason for building this system even though autopilot system already existed in the market is because the existing autopilot system in the market are too complex to be implemented into daily use car due to the high number of sensor used in the vehicle and high computing power required. To prove the validity of this project, a prototype of the system will be created with Lego Mindstorms EV3 Education Set. Increment methodology is used to build this prototype as it provide the ability to do rapid analysis and development. The prototype are equipped with the function to follow the car in front at straight road and slight turns. In case of sharp turns or any interference by the driver, the system will stop and return the driving control to the driver. Throughout the autopilot, the driver will be notified continuously on the decision made by the autopilot system via voice notification system. In case the car in front reverses, the system will stop the system and warn the driver about it. After a testing has been done, this prototype managed to achieve an average accuracy level of 89%
v ACKNOWLEDGEMENT
First of all, I would like to express my utmost gratitude to my lecturer, Dr Norshuhani Zamin for her efforts in assisting our research project. Throughout this project, she has been sacrificing her time to discuss with us about the project progress.
This enable me to understand my project topic quickly and know where I should head to in my project, which enable to progress throughout my project quickly. Besides, she also provides very clear and precise guidelines which are a great help to us in doing this research. With her guidelines, my burden to produce the report was lightened and I can finish my project smoothly.
In addition, I would also like to thank Dr Shuib Basri for his willingness to take over Dr Norshuhani as my new main supervisor. With his expert knowledge in software testing, I am able to refine my research methodology and enhance the quality of my project.
Besides, I also would like to thank my friends who share the same final year project supervisor with me. Throughout the project, they have been providing assistance to me in terms of ideas, transport, lab access, brainstorming, and many more.
Without their helps, it would be very hard for me to sustain throughout my project.
Lastly, we would like to say thank you to my parents. Throughout this research, they are the one who always support us and help us. Without them, our research will not be this smooth.
vi TABLE OF CONTENT
ABSTRACT ... iv
ACKNOWLEDGEMENT ... v
TABLE OF CONTENT ... vi
LIST OF FIGURES ... viii
LIST OF TABLES ... xi
CHAPTER 1 ... 12
INTRODUCTION ... 12
1.1 BACKGROUND OF STUDY ... 12
1.2 PROBLEM STATEMENTS... 15
1.3 OBJECTIVES ... 17
1.4 SCOPE OF STUDY... 18
CHAPTER 2 ... 19
LITERATURE REVIEW ... 19
2.1 DRIVE ASSIST SYSTEM (DAS) ... 19
2.2 EXISTING COMMERCIALIZED DAS ... 21
2.3 COMPARING THE TWO EXISTING DAS ... 27
2.4 OTHER DAS SYSTEM ... 28
2.5 ESSENTIAL ELEMENTS IN DAS ... 29
2.6 GAPS FOUND IN CURRENT PRODUCT ... 39
CHAPTER 3 ... 42
METHODOLOGY ... 42
3.1 INTRODUCTION ... 42
3.2 DEVELOPMENT METHODOLOGY ... 43
vii
3.3 OVERALL PROJECT DEVELOPMENT PHASES ... 43
3.4 RESEARCH METHODOLOGY ... 45
3.5 EVALUATION METHOD ... 51
CHAPTER 4 ... 56
RESULT AND DISCUSSION ... 56
4.1 ONLINE SURVEY RESULT AND DISCUSSION ... 56
4.2 DEVELOPMENT RESULT AND DISCUSSION... 71
4.3 COST BREAKDOWN ... 78
CHAPTER 5 ... 79
CONCLUSION ... 79
5.1 ACHIEVED OBJECTIVES ... 79
5.2 FUTURE WORKS ... 80
5.3 SUMMARY ... 80
REFERENCES ... 81
APPENDIX A – SURVEY FORM ... 85
APPENDIX B – PROGRAM CODE OF THE PROTOTYPE PROGRAM ... 86
viii LIST OF FIGURES
Figure 1.1: Traffic congestion situation that occurs every day in Kuala Lumpur.
(Bumper-to-bumper: Motorists stuck in the traffic heading towards Kuala Lumpur
yesterday, 2011) ... 12
Figure 1.2: Projected traffic jam situation in 2024 (The dreadful traffic jams, 2014)13 Figure 2.1: The image above shows a traffic system designed by Kanemitsu (2013) (Reprinted from Autonomous Driving Technologies for Advanced Driver Assist System, by Hiroyuki Kanemitsu, 2013) ... 20
Figure 2.2: Audi A8 Front Look. (Retrieved from 2013 Audi A8L 3.0T Quattro: Review, 2013) ... 21
Figure 2.3: Physical Layout of the System (Kumar & Pathak, 2012)... 21
Figure 2.4: Position of the Adaptive Cruise Control System in Audi A8 (Retrieved from Adaptive Cruise Control Towards a Safer Driving Experience, n.d.) ... 22
Figure 2.5: The network system of Adaptive Cruise Control System in Audi A8 (Kumar & Pathak, 2012) ... 23
Figure 2.6: Operating Stalk (Kumar & Pathak, 2012) ... 24
Figure 2.7: Mercedes Benz S-Class (Bloomberg, 2013)... 25
Figure 2.8: The Sensors and its Functions (Bloomberg, 2013) ... 25
Figure 2.9: Interface used in Mercedes Benz Autopilot System (Beukel & Voort, 2014) ... 26
Figure 2.10: Coverage of the sensors installed in the vehicle (Ulmer, 1994) ... 29
Figure 2.11: Detection Range of the Sensors in Audi A8 ... 30
Figure 2.12: Detection Range for Sensor in Mercedes Benz E Class Vehicles (Bloecher, Dickman & Andres, 2009) ... 30
Figure 2.13: Radar Sensors Produced by Bosch (Retrieved from Mid-range radar sensor, n.d.) ... 31
Figure 2.14: Definition Guide for FOV and Length of Coverage Areas ... 32
Figure 2.15: A Typical Ultrasonic Sensor used in Commercialized Cars (Retrieved from Ultrasonic sensors, n.d.) ... 33
Figure 2.16: How Ultrasonic Sensor Works (Retrieved from Working of Ultrasonic Sensor, n.d.) ... 33
Figure 2.17: Interface used in Audi A8 (Retrieved from Allan, 2014) ... 35
ix Figure 2.18: Interface used by Mercedes Benz in their Autopilot System (Retrieved
from Mercedes Distronic Plus, n.d.) ... 36
Figure 2.19: Warning on Steering Hand Off (Retrieved from Hands off warning sign, 2013) ... 36
Figure 2.20: Internal System Networks of Autopilot System in Audi A8 (Retrieved from John Day Automotive Electronics, 2009) ... 37
Figure 2.21: The Main Control System of the Autopilot System in Audi (Retrieved from Audi, n.d.) ... 38
Figure 3.1: Development Methodology used in this Project ... 43
Figure 3.2: Question 1 ... 45
Figure 3.3: Question 2 ... 45
Figure 3.4: Question 3 ... 46
Figure 3.5: Question 4 ... 46
Figure 3.6: Question 5 ... 47
Figure 3.7: Question 6 ... 47
Figure 3.8: Question 7 ... 48
Figure 3.9: Question 8 ... 48
Figure 3.10: Question 9 ... 49
Figure 3.11: Question 10 ... 49
Figure 3.12: Design of the Prototype ... 50
Figure 3.13: The Runway Track for Testing ... 51
Figure 4.1: Result for Question 1 ... 56
Figure 4.2: Result for Question 2 ... 58
Figure 4.3: Result for Question 3 ... 59
Figure 4.4: Result for Question 4 ... 61
Figure 4.5: Results for Question 5 ... 63
Figure 4.6: Results for Question 6 ... 65
Figure 4.7: Result for Question 7 ... 66
Figure 4.8: Result for Question 8 ... 67
Figure 4.9: Comments by Respondents ... 68
Figure 4.10: Result for Question 9 ... 69
Figure 4.11: Result for Question 10 ... 70
Figure 1: The Autopilot Program. The straight line that extends downward connects to the remote control unit of the vehicle. ... 86
x
Figure 2: The remote control unit of the autopilot program ... 87
Figure 3: Module used to measuring the reading difference between the left and right ultrasonic sensor ... 88
Figure 4: Module used to beside the robot turning ... 89
Figure 5: Module to control robot movement using infrared beacon ... 90
Figure 6: Module used to control the forward thrust of the robot ... 91
Figure 7: Module used to decide on the activation of the forward thrust for the robot ... 92
Figure 8: Module used to reset the steering system ... 93
Figure 9: Module used to detect the reverse of the vehicle in front ... 93
Figure 10: Module used to notify driver on the system's action ... 94
xi LIST OF TABLES
Table 2.1: Comparison between existing products and proposed products: ... 39
Table 3.1: Gantt chart for This Project... 44
Table 3.2: Table Used for Testing... 52
Table 4.1: Result for Test Case 1 ... 71
Table 4.2: Result for Test Case 2 ... 72
Table 4.3: Result for Test Case 3 ... 73
Table 4.4: Result for Test Case 4 ... 74
Table 4.5: Result for Test Case 5 ... 75
Table 4.6: Result for Test Case 6 ... 76
Table 4.7: Result for Test Case 7 ... 77
Table 4.8: Cost Breakdown Table for Real Prototype Development... 78
Table 12: Cost Breakdown for Real Implementation of TJ Assist with Remote Controlled Car ... 78
12
CHAPTER 1
INTRODUCTION
1.1 Background of Study
Traffic congestion is a common problem in Malaysia, especially in the capital city of Malaysia, Kuala Lumpur. Especially during peak hours around 4pm to 6pm when all workers go to work and return from work respectively, all major highways will be very congested (Slow traffic along expressway, 2011).
Figure 1.1: Traffic congestion situation that occurs every day in Kuala Lumpur.
(Bumper-to-bumper: Motorists stuck in the traffic heading towards Kuala Lumpur yesterday, 2011)
On average, one person will at least spent around one to four hours trapped in traffic jam every day (Tong, 2014). According to a survey done by Frost and Sullivan, 41% Malaysian described traffic jam as their top frustration (Frost & Sullivian: 41%
of KL's respondents rank traffic jam, congestion as top frustrations, 2014).
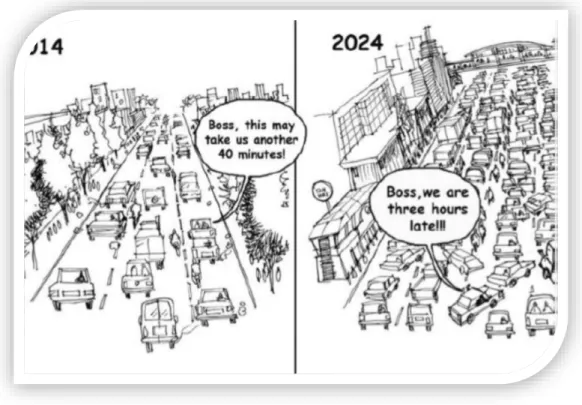
13 According to the latest data from Malaysian Automotive Association (MAA), the total number of vehicles sold in 2013 showed an increase of 4.5% compared with the data last year at the value of 655, 793 vehicles sold. This value is expected to increase in 2014. The following figure shows the projection of the traffic jam situation in Malaysia in 2024 (Tong, 2014).
Figure 1.2: Projected traffic jam situation in 2024 (The dreadful traffic jams, 2014)
However, the main transportation tools used by Malaysian is private cars.
According to the report, about 88% Malaysian are using private cars as their major transport tools while the remaining 12% uses public transport (Tong, 2014). Compared to the global average figure, which recorded 53% private transportation usage and 26%
public transport usage, Malaysia is relatively more relied on private transportation as the main transportation mode (Frost & Sullivian: 41% of KL's respondents rank traffic jam, congestion as top frustrations, 2014).
14 From these statistics, we can infer that more vehicles are going to hit the road in the coming years, and the problem of traffic jam is going to get worse.
Consequently, the accident rate will increase because roads with more serious traffic jam is more prone to accidents. This situation can be caused by confrontational driving behaviour by certain driver during traffic jam (Wang, 2010). As not many space are available during traffic jam, vehicle are less flexible and not able to move freely. If the driver insist on the move against the traffic flow (e.g. cutting lines), accident will occur as the car does not have enough space to perform the movement instructed and known into other cars.
15 1.2 Problem Statements
1.2.1 Economic Loss from Traffic Congestion
Traffic jam is not only a waste of time, but it also causes loss to national economy in terms of efficiency and productivity. The seriousness of traffic jam is depicted by the calculation below.
Assume one person wasted 4 hours in traffic jam every day.
According to the statistics,
Malaysian population between 16 years old to 64 years old
= (100% - 26 % (population below 15 years old) - 5.5% (population above 65 years old) x 29.92 million
= (100% - 31.5%) × 29.92 million
= 68.5 % × 29.92 million
= 20.49 million
Assume 10 million people out of the population mentioned above is not working,
= 20.49 million – 10 million
= 10.49 million
(Department of Statistics, 2014) Thus, total time wasted in traffic jam per day
= 10.49 million × 4 hours
= 41.96 million hours
= 4789.95 years
Assume one person works 8 hours a day, Wasted man-days
= 41.96 million hours ÷ 8 hours/person
= 5.24 million man-days
From the calculation above, we can see that we have wasted so many time during traffic jam, enough to decrease the efficiency and the productivity of the national economy (Tong, 2014).
16 1.2.2 Psychological Loss during Traffic Jam
During traffic jam, movements by the driver is usually limited. However, they can’t do any other things because they have to pay attention to the traffic flow. As a result, the driver tends to get stressed during traffic jam (Krome, Holopainen, & Walz, n.d.).
The level of stress depends on the condition of the traffic jam. Short traffic jam is relatively manageable by normal people. However, when the traffic congestion situation prolongs for a significant time span, people might become more aggressive (Krome, Holopainen, & Walz, n.d.). This might leads to various changes in moods and behaviour. According to Mayo Clinic (2013), stress can leads to various negative moods in a person like tensions, uneasiness, anger and depression. With these moods mixed together, it can impacts the behaviours of the people (Mayo Clinic, 2013). For instance, anger eruption or tobacco abuse can happen when somebody is under stress condition (Mayo Clinic, 2013). This makes traffic jam a serious problem not only affecting the time, but also the well-being of the person.
1.2.3 Disadvantages of Public Transport in Malaysia
In Malaysia, the public transport system is not very established. Although a relatively well developed public transport system is available in Kuala Lumpur, this is not the same case for all other countries. For example, no systematic public transport system is established in Sabah as most of the bus companies in Sabah because the bus is provided by many unregulated private companies in the form of minibus. As there’s no standard set among the companies to regulate the bus, the seats arrangements and the bus condition varies across different bus companies.
Apart from that, the public transport system in Malaysia especially bus services are not following the defined bus schedule. They are either ahead the schedule or behind the schedule (De Corte, 2009). This makes public transport a less reliable choice because people needs to be on time to work and this trait of public transport system is not helping them to be on time. As a result, they have to resort to private transportation.
17 1.2.4 Statement of Problems
Thus, a study which investigates the car autopilot system during traffic jam to help the driver maintain a safe distance with the vehicle in front and enable driver to utilize the time used in traffic jam could remedy the problem. However, the existing car autopilot system is too complex to be implemented in daily used vehicles. As there are many sensors used in the existing autopilot system, high computing power is required to produce the required autopilot decision. This makes it not suitable for daily usage.
1.3 Objectives
There are 4 objectives identified for this project, namely:
To study the people’s experiences in traffic congestions
To investigate the existing auto pilot system
To develop a simple autopilot system for local automotive industry
To evaluate the performance of the developed system
18 1.4 Scope of Study
For this project, the prototype of the system will be developed with Lego Mindstorm EV3 Education Set. Lego Mindstorm EV3 Education Set is a highly customizable robotic set. Equipped with robot building components like tyres, motors, sensors, battery, building bricks and components, user can construct a robot or model a machinery with these components. Insufficient components can be obtained from the Expansion Set.
This project will only cover the following areas:
The system prototype will be designed only for usage in traffic jam situations o Assumed the car in front is moving, this system will be designed to
follow the vehicle in front.
o When the traffic jam condition is eased, the system will alert the user to take over driving.
The initiation of the system is semi-autonomous.
o To catalyse the development speed, this system is designed to start by the command of the driver.
o This feature reduces the complexity of the code required to run the system and thus make the prototype development faster
19
CHAPTER 2
LITERATURE REVIEW
2.1 Drive Assist System (DAS)
Drive Assist System (DAS) is a system used in car to help the driver automate some driving process. Currently, various types of DAS system is installed into the car in the market. For instance lane assist system which helps the car to keep in lane, vehicle-to-vehicle communication, Anti-lock Brake System, and many more (Kanemitsu, 2013). From the definition of National Highway Traffic Safety Administration (NHTSA), DAS can be classified into 4 level according to its automated ratio. Level 1 is the system with the lowest automation and requires constant involvement from the driver. Level 2 can be considered as semi-autonomous as only some intervention from the driver is necessary. Level 3 represents automated cars which does not require intervention from the driver. Lastly, Level 4 represents autonomous vehicle which can perform driving automatically (as cited in Kanemitsu, 2013).
These system helps to provide automated control on the vehicle steering and reduce the burden of the driver (Wulf, Rimini-Doering, Arnon, & Gauterin, 2013).
This is because the automated system changed the driver’s driving mode from actively involved with the driving to just supervising the driving (Beukel & Voort, 2014).
According to Stanton and Marsden (1996), DAS which helps to automate driving tasks has a good impact on driver’s well-being, helps to reduce mistakes in driving made by human error which helps to improve safety in driving, and generate high profitability for the car manufacturer (as cited in Wulf et al., 2013).
20 Besides, Kumar and Pathak (2012) provides more benefits of automated driving system. According to Kumar and Pathak (2012), this DAS can also be integrated into a traffic system which can adapt itself with the environment to reduce the occurrence of road accidents. This can be depicted through an image from the report by Kanemitsu (2013).
Figure 2.1: The image above shows a traffic system designed by Kanemitsu (2013) (Reprinted from Autonomous Driving Technologies for Advanced Driver Assist System, by Hiroyuki Kanemitsu, 2013)
From the picture above, we can see that with the help from the traffic system outside, the DAS can provide safe and comfort driving for the user.
21 2.2 Existing Commercialized DAS
2.2.1 Audi A8
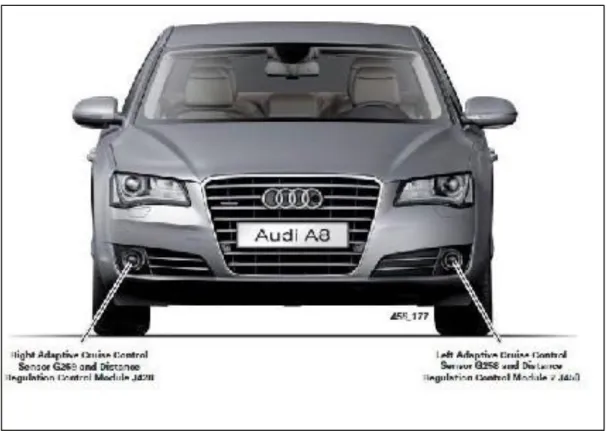
Figure 2.2: Audi A8 Front Look. (Retrieved from 2013 Audi A8L 3.0T Quattro: Review, 2013)
In this model, the DAS is named as Adaptive Cruise Control (ACC). It is considered as an extra feature to the car model and is available for all varieties of the model. The ACC system used in the car is produced by Bosch (Kumar & Pathak, 2012).
Figure 2.3: Physical Layout of the System (Kumar & Pathak, 2012)
22 This ACC system consists of 2 radar sensors in front (Audi, 2011), some additional vehicle equipment like video camera, rear radar sensors and ultrasonic sensors and also 2 distance regulation control module.
Figure 2.4: Position of the Adaptive Cruise Control System in Audi A8 (Retrieved from Adaptive Cruise Control Towards a Safer Driving Experience, n.d.)
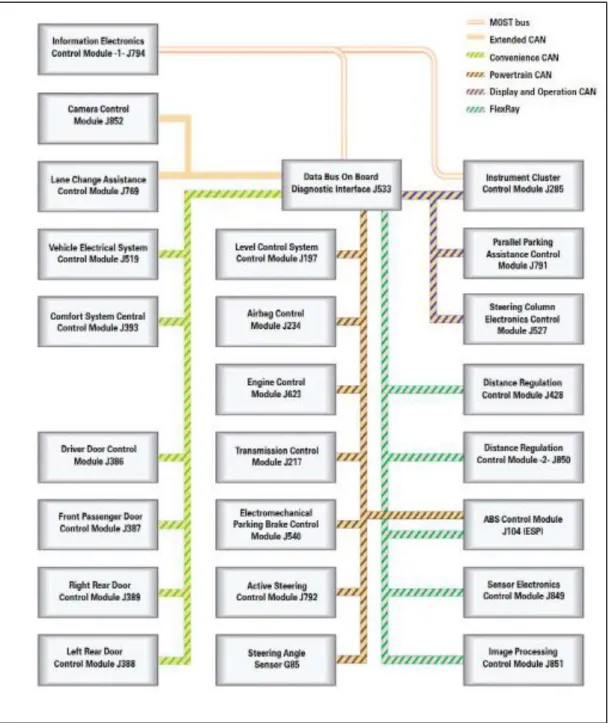
All these modules are controlled by a powerful processor which provide relevant responses after processing the data from all the sensors. Most of the module of the system is communication with Flex Ray data bus, while the remaining communication is through Powertrain data bus, Convenience data bus, extended data bus, and MOST data bus. For the distance control module, master-slave architecture is used. The sensor module on the right is the master while the module at the left is slave (Kumar & Pathak, 2012).
23
Figure 2.5: The network system of Adaptive Cruise Control System in Audi A8 (Kumar & Pathak, 2012)
The radar sensor situated in front of the vehicle measure the distance in front with a 76.5 GHz radar waves (Audi, 2011). The wave emitted from the sensor is able to cover a wedge shaped area of 40 degree. With that, the vehicle is able to detect and measure object from 0.5m in front of the vehicle to 250m ahead of vehicle. For the side-to-side detection, the vehicle radar is able to sense between 16m up to 30m. This system will be able to work between the speeds of 0km/h up to 250 km/h (Kumar &
Pathak, 2012).
24
Figure 2.6: Operating Stalk (Kumar & Pathak, 2012)
When the ACC system is on, the system will maintain the same speed until the vehicle ahead is about 3 - 4m ahead. The last 2-3m distance will covered at a very slow speed around 2-3 km/h. In a busy traffic condition where the front vehicle is not moving, the vehicle will stop completely. If the vehicle in front moves after a short period, the ACC system will be continue to work and follow the vehicle ahead. If the stopping time is long, driver action such as pressing the gas pedal or move the cruise control stalk is required to make the ACC system function again (Audi, 2011).
However, driver need to reinitiate the system by pulling the control stalk or pressing the gas pedal lightly (Kumar & Pathak, 2012).
The sensors in the ACC system will check the condition in front of the vehicle before initiate the car movement. When an obstacle is detected, visual and auditory warning will be issued to the driver so that they can take relevant action to solve the issue (Kumar & Pathak, 2012).
This system is aimed to reduce driver fatigue due to the driving task in traffic jam, helps prevent road accidents, and improve fuel efficiency. However, if the system does not function normally, acute accidents might occur. In addition, this ACC system is still not equipped with vehicle to vehicle communication, and might not be able to respond with traffic signal (Kumar & Pathak, 2012).
In terms of cost, Audi A8 is selling at a hefty price. According to Audi (2015), an Audi A8L equipped with cruise control feature is selling at the price of RM 672,900 excluding the insurance fee.
25 2.2.2 Mercedes Benz Steering Assist
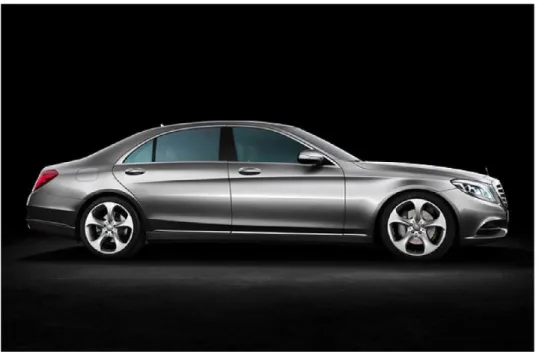
Figure 2.7: Mercedes Benz S-Class (Bloomberg, 2013)
In the latest S-class sedan from Mercedes Benz, an ingenious DAS system named Distronic Plus is installed. This system will slow down the car when a car is detected 150m in front of the car (Muhaiyiddin, Sanudin, Wahab, & Johari, 2009).
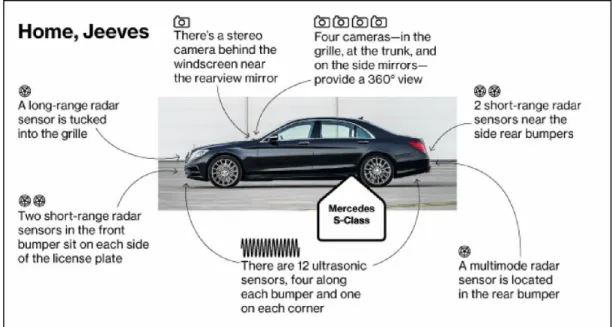
Figure 2.8: The Sensors and its Functions (Bloomberg, 2013)
This system is equipped with 6 radar sensors, 5 cameras, 12 ultrasonic sensors and a high performance microcomputer to fulfil its tasks of manoeuvring the car
26 (Tschampa, 2013; Muhaiyiddin, Sanudin, Wahab, & Johari, 2009). The computer will keep watch on the traffic condition in front of the vehicle to maintain a safe distance constantly. When the vehicle come in close proximity with the other vehicle, the ACC system will reduce the vehicle speed and brakes will be applied when required. The system will move the vehicle again when the vehicle in front is far enough (Muhaiyiddin et al., 2009). Besides, it is also equipped with lane keeping function, which helps to keep the car within the road lane.
Figure 2.9: Interface used in Mercedes Benz Autopilot System (Beukel & Voort, 2014)
However, this system is intended for semi-automated driving. The system is switched on manually by the driver. If the driver attempts to stop the car, the system will shut down and return full control to the driver (Tschampa, 2013). When the speed of the car increases to more than 10km/h, driver are required to hold on to their wheel. If the driver take their hands off the steering wheel, a warning message will be issued through the notification panel (Beukel & Voort, 2014).
With this system, many head-to-tail accidents can be avoided. According to Bloecher, Dickmann, and Andres (2009), the autopilot system in this model is able to reduce the occurrence of head-to-tail accidents by 36 percent. This is very important to countries with serious head-to-tail accidents like Germany and United States as this system can helps to improve the safety of car driving (Bloecher et al., 2009).
According to Tschampa (2013), the vehicle is available at a hefty price tag of USD
$105,800, which is equivalent to RM 385,863.18.
27 2.3 Comparing the Two Existing DAS
For the method to start the DAS system, Audi A8 utilizes an operating stalk to control the system. User needs to pull the stalk in order to switch on the system when they need to use it. However, the DAS system of Audi will constantly monitors the road condition in the background (Kumar & Pathak, 2012). On the other hand, the method used by Mercedes S-class Sedan to switch on the system is not reported. However, from the quotes by Tschampa (2013),
“Mercedes’s stop-and-go feature is activated by switching on cruise control. It shuts off when the driver steps on the brake or switches it off manually.”
We can imply that the system is not fully autonomous and need to be switched on by the user manually.
However, the method to stop the system is similar for both DAS system, in which both of them uses brake input from user and the system switch to turn off the system.
When the driver presses the brake pedal, the system will turn off automatically. This is because this system is designed with the assumption that driver is still in charge of the vehicle and this system is just an assistance to their driving (Tschampa, 2013).
Driver is required to control the vehicle movement whenever it is needed (Kumar &
Pathak, 2012).
In terms of the driver attention level, Audi requires less attention from the driver while Mercedes requires more attention from the user. This is because Audi A8 DAS system is designed to automate the whole driving process. Once the system is activated, the vehicle will take full control of the vehicle. Thus, accidents might occur should the system failed to function normally (Kumar & Pathak, 2012). In contrast, Mercedes DAS system is designed to operate only at crawling speed (< 10 km/h). Once the car speed is beyond the 10km/h benchmark, the system will ensure driver attention with the driving. This is depicted by the warning sign on the dashboard if the driver let go of the steering for more than the specified time (Tschampa, 2013). Thus, Mercedes DAS system requires more user attention compared to Audi’s system.
28 2.4 Other DAS System
2.4.1 Honda
At the present times, Honda is still researching on the autopilot field. However, all other sub components that helps with autopilot functions like Lane Departure Warning, Forward Collision Warning and Adaptive Cruise Control is ready. Until today, there’s only one model of Honda car providing semi-automated driving under certain environments (Tannert, 2014). For example, this system in Accord model beeps every 10 seconds to alert driver about the system (Hill, 2006).
2.4.2 General Motors (GM)
Currently GM is working on its autopilot system called Super Cruise. This system is able to provide automated driving with features like blind-spot monitoring, collision handling and lane departure alert. However, this system is only built for certain models of the cars under GM. The price for this system is around $8,000 USD dollars, which is equivalent to RM 29435.20.
(Tannert, 2014) 2.4.3 BMW
Until today, BMW is still in the process of refining its autopilot systems to be able to adjust itself with various conditions in real world. They showcased the ActiveAssist autopilot system at CES 2014 through the 2 series prototype. The show was very impressive with the system able to handle various kinds of situations effectively.
However, the system is not available in the market yet (Tannert, 2014).
2.4.4 Volvo
As Volvo has great emphasis on safety, Volvo aim to use driverless technology to prevent deadly car accidents. For that, Volvo established a collaboration with Swedish Transport Administration, Lindholmen Science Park, and the City of Gothenburg to conduct testing and development activities on the system. Besides, Volvo is conducting a pilot testing for the system by releasing 100 automated driving car onto the public roads to investigate the effectiveness of the system. The car is expected to go into commercialization in 2017. (Tannert, 2014)
29 2.5 Essential Elements in DAS
From the extensive literature review, it is found that a generic DAS system should have 3 main components, which are sensors, system interface, and computing system.
2.5.1 Sensors
The most essential part of a DAS system is the sensors system as they are the ‘eyes’
of the system. Various types of conditions can occur during driving, like car overtaking, traffic jam, road constructions, pedestrian crossing, and many more. As DAS automated the driving process, designers for DAS needs to make sure the system is able to handle the car under all these conditions. In order for the system to handle these conditions, robust sensors are required to determine the condition of the environment surrounding the car accurately so that the DAS system are able to response to the condition properly.
This theory is proven by a research paper from Ulmer (1994). Ulmer (1994) said that details on the operating area for the car are needed to provide timely response to avoid collision.
Figure 2.10: Coverage of the sensors installed in the vehicle (Ulmer, 1994)
Hence, in the test vehicle described in Ulmer (1994) research, around 10 sensors and a few cameras are used to provide full view of the car surrounding as shown in the figure above.
30 This is similar to the functions of the sensors in Audi’s A8 DAS system and Mercedes S-class DAS system as depicted by the image below.
Figure 2.11: Detection Range of the Sensors in Audi A8
Figure 2.12: Detection Range for Sensor in Mercedes Benz E Class Vehicles (Bloecher, Dickman & Andres, 2009)
Various types of sensors are available in the market which can be used by the DAS system to obtain input. According to Muhaiyiddin et al. (2009), there are 5 types of sensors available in the market, namely radar sensor, sonar sensor, ultrasonic sensor, laser sensor, and infrared sensor. However, to limit the scope of research for this project, only radar sensor and ultrasonic sensor will be covered in this literature review.
31
Figure 2.13: Radar Sensors Produced by Bosch (Retrieved from Mid-range radar sensor, n.d.)
Radar sensor utilizes reflection of microwaves on object to detect obstacles. It can be divided into conventional radar sensor and ultra-wide-band (UWB) sensor.
While conventional radar sensor uses continuous streams of microwaves to function, UWB uses impulses of microwaves to detect objects. It releases extremely high band microwave pulses for a short time at an interval to detect the objects in front of the sensor (Dutta, Arora, & Bibyk, 2006). According to Bloecher et al. (2009), UWB radar sensor can be divided into 3 types according to the field of view (FOV) of the sensor and also the length of the coverage area.
32 The below image define the meaning of FOV and length of coverage area.
Figure 2.14: Definition Guide for FOV and Length of Coverage Areas
The first type is Long Range Sensor (LRR) with a FOV of 18° and a length of coverage area of 200m. The second type is Mid-Range Sensor (MRR) with a FOV of 60° and a coverage area length of 60m. The last one is Short Range Sensor (SRR) with a FOV of 80° and a coverage area length of about 30m. However, SRR is better than the previous radar sensor as it is able to provide high definition view of the condition ahead with the ability to pinpoint to actual position of obstacle ahead (Bloecher et al., 2009).
Radar sensor is considered as the best sensors among the other sensors in the market due to its accuracy and also its robustness during bad weather conditions.
Besides, it is also less prone to interference from sunlight and have the ability to sense both stationary object and moving objects (Bloecher et al., 2009). This also explains why both Mercedes and Audi choose radar sensor in their DAS system (Kumar, 2012;
Tschampa, 2013).
Angle of FOV Length of coverage area
Radar Sensor
33
Figure 2.15: A Typical Ultrasonic Sensor used in Commercialized Cars (Retrieved from Ultrasonic sensors, n.d.)
On the other hand, ultrasonic sensor sense the obstacles in front through the reflection of ultrasonic pulse emitted from a piezoelectric transducer from the object in front.
Figure 2.16: How Ultrasonic Sensor Works (Retrieved from Working of Ultrasonic Sensor, n.d.)
As shown in the image above, ultrasonic pulses will be emitted from one transducer. When the waves hits the object, it will be reflected, and the reflected waves will be collected by the transducer again. The reflected waves is then processed to determine the distance (Carullo & Parvis, 2001).
Compared to radar sensor, ultrasonic sensor has a very short range of less than 10m (Muhaiyiddin et al., 2009). Thus, usually ultrasonic sensors are used in vehicle today to detect obstacle at the back of the car. Even Audi A8 still maintain the usage of ultrasonic sensors in their car for parking purpose (Kumar & Pathak, 2012).
Furthermore, ultrasonic sensor is in fact suitable for usage in traffic jam DAS system
34 because the effective measuring speed for ultrasonic sensor is up to 33m/s (Carullo &
Parvis, 2001). However, ultrasonic is not very accurate as the reflected wave contains a lot of noise which needs to be filtered out for accurate reading. Besides, ultrasonic sensor also have the ‘blind spot’ problem because at certain condition the distance measured by ultrasonic is not accurate especially when the object does not provide good reflection (Muhaiyiddin et al., 2009).
35 2.5.2 System Interface
Hermann from Mercedes said that “We don’t want driver to believe the system can do everything, because at the end of the day, the driver is still responsible.” (Tschampa, 2013, para. 7). This portrays the importance of user interface in order for the DAS system to function. According to Beukel and Voort (2014), human is not used to the task of supervision. Hence, the DAS design needs to balance between driving automation and driver control so that the benefits of driving automation can be enjoyed by the driver while driver can regain control of the vehicle easily.
Thus, in the opinion of Beukel and Voort (2014), there’s a few factors that needs to be considered in the design of a semi-automated driving, which is driving mode, information, and driver awareness.
As there are 2 modes of driving exists together, driver must be informed clearly about the mode of driving used. For example, the dashboard of Audi vehicle will indicate the current driving mode used clearly to the driver as shown in the figure below.
Figure 2.17: Interface used in Audi A8 (Retrieved from Allan, 2014)
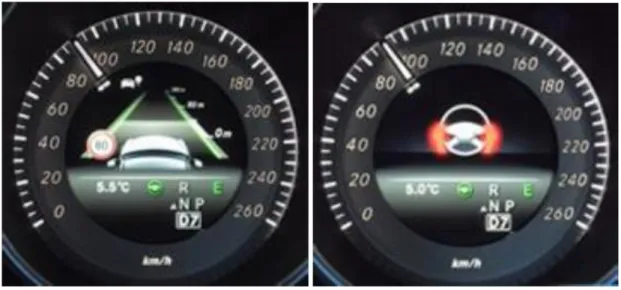
In terms of information, essential information like driving direction, distance, location and warning needs to be provided efficiently to the driver. This is because when input from driver is not required to control the car, the driver will assume that they are passenger in the car and might not be able to regain proper control when their input is required. Hence, driver needs to be informed constantly about the driving so that they are well aware of the driving and able to gain control back quickly. As shown
36 in the figure below, when the distronic plus automated driving assist system of Mercedes Benz is activated, the driving progress is shown on the dashboard of the vehicle so that driver can understand what is happening while the assisted driving function is activated (Beukel & Voort, 2014).
Figure 2.18: Interface used by Mercedes Benz in their Autopilot System (Retrieved from Mercedes Distronic Plus, n.d.)
From the aspect of driver awareness, the system interface of the system should achieve a balance in terms of automation and driver control so that the driver can regain control of the vehicle when driver input is needed or when the driver intended to do so. To ensure smooth transition of control, the system interface must make sure driver is aware of the driving condition. For example, Mercedes DAS system will detect whether driver’s hand is on the steering wheel or not. If the checking return false, a warning will be displayed on the dashboard to inform the driver to hold on to their steering wheel.
Figure 2.19: Warning on Steering Hand Off (Retrieved from Hands off warning sign, 2013)
37 2.5.3 Computing System
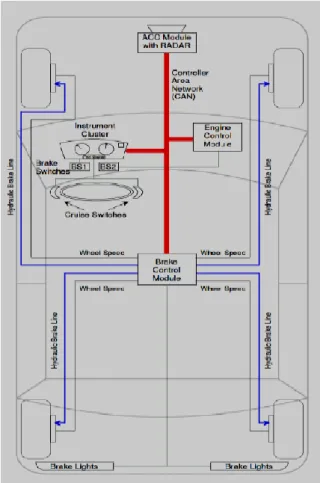
The third most important system in a DAS is computing system. This is where all the computations and decision making being done. Usually, this system is comprised of a communication network and a processor. For example, Audi A8 has a local network connecting the sensors and the vehicle control system in the DAS, as shown in the figure below.
Figure 2.20: Internal System Networks of Autopilot System in Audi A8 (Retrieved from John Day Automotive Electronics, 2009)
38 The figure below shows the circuit board where the decision is made from Audi.
Figure 2.21: The Main Control System of the Autopilot System in Audi (Retrieved from Audi, n.d.)
Without this system, the other 2 system will become obsolete as all the decisions on the automated driving is being made here.
39 2.6 Gaps Found in Current Product
Table 2.1: Comparison between existing products and proposed products:
Car Model Automate d Driving in Traffic
Jam
Full Automated
Driving
Method to start
the system
Method to stop the system
Sensor Used Require driver attention
Commerci alization
Options to install separately
Audi A8 Yes Yes Operating
Stalk
Operating Stalk / Brake
Radar, Ultrasonic, Video Camera, Distance Control
Module
Low Yes Yes, but only to
certain model
Mercedes S-class
Yes No Not
specified
Brake/ Manual switch off
Radar, Ultrasonic Video Camera
High Yes No
Honda Not
Specified
Basic automated
driving in controlled environment
Not Specified
Not Specified Radar, Camera, Wi-Fi High Yes , only 1 model in production
Not Specified
General Motors
Not Specified
Yes Not
Specified
Not Specified Not Specified Not
Specified
Available on a few
model
Not specified
40
BMW Not
Specified
Yes Not
Specified
Not Specified Not Specified Low Prototype
Stage
Not Specified
Volvo Not
Specified
Yes Not
Specified
Not Specified Not Specified Low Pilot
Testing stage
Not Specified
TJAssist Yes No Button Button Ultrasonic Medium
(Driver will be notified
of the car movement constantly)
No In planning stage
41 As described in section 2.3, DAS system for Audi A8 and Mercedes S-class sedan are very complex All of them employs various sensors like radar sensors and ultrasonic sensors to scan the environment and apply semi-automated operating method. Some autopilot system even employs camera to scan the road condition. All these systems requires a lot computing power to process the huge amount of data from these sensors.
Furthermore, we also learnt that DAS is not fully reliable, and driver needs to be aware of the system usage to prevent accidents. This is also why Mercedes designed its system to make sure driver’s hand is always on the steering wheel so that the driver can regain control easily. However, this does makes the system appeared obsolete because driver can’t do anything with their hands attached to the steering wheel all the time (Beukel & Voort, 2014).
This creates a gap for a new system in terms of system complexity and operating method. In order for this system to be implemented for daily use, the system should be simple enough and provide real-time responses. To achieve this, we need to reduce the number of sensor used so that we have less data to be processed.
Therefore, in this project, the system prototype will use 2 ultrasonic sensors to scan the environment in front of the car. When it is activated, the system will follow the car in front of the vehicle. At the same time, the speed of the vehicle will be measured. When the vehicle speed is getting higher, the system will alert the user and stop the system.
Besides, this system will also keep user engaged by notifying the driver about the action taken by then system. For example, when the vehicle turns left, the system will inform the driver that the vehicle is going to turn left.
Other than that, this system will not prevent user from controlling the vehicle.
Driver are allowed to regain control of the vehicle anytime they want. When there’s a user input, the system will be stopped to return full control to the driver.
42
CHAPTER 3
METHODOLOGY
3.1 Introduction
In this chapter, methodologies used for development and research is described. For this research, qualitative methodology is used to conduct survey on the research scope, while qualitative methodology is being chosen to conduct research on prototype development. Meanwhile increment development methodology is used to develop the prototype.
43 3.2 Development Methodology
Increment development methodology is used in this project to develop the prototype with Lego Mindstorm EV3 robot.
Figure 3.1: Development Methodology used in this Project
In this methodology, the whole project is broken down into a few smaller parts with simple goals. Some simple analysis will be done to determine the way to achieve the goal. Then, codes will be written to build the product. The completion of this phase is followed by a simple testing to make sure the goal is reached. After that, the next increment will be planned and the new cycle started again. This process will be repeated until the whole project is finished.
3.3 Overall Project Development Phases
To monitor project progress for this project, milestone setting is used instead of breaking the project into separate phases. This is due to the uncertainty in the development methodology used for this project.
As the whole project can be broken down into various small portions, the exact project phases the project is in at a particular time is not known. Therefore, instead of separating the whole project into various fixed phases, milestones are used to ensure the project progress smoothly.
44 For that, various meaningful milestones will be set on relevant date according to expected product output. The details about the milestones are shown in the diagram on the next page.
Table 3.1: Gantt chart for This Project Agenda\Wee
ks
1- 2
3- 4
5- 6
7- 8
9 - 10
11 - 12
13 - 14
15 - 16
17 - 18
19 - 20
21 - 22
23 - 24
25 - 26
27 - 28 Prototype
Development
◊ Report
Writing and Presentation
◊
Testing of Prototype
◊ Documentati
on
◊
◊: Milestone for the agenda
45 3.4 Research Methodology
3.4.1 Survey
For this research, quantitative and qualitative methodology is used. First, a questionnaire is distributed among the people living around KL about the project to understand the seriousness of the problem of traffic jam in their view and also their acceptance of the newly developed system. 10 questions as described below are asked to achieve the abovementioned objectives.
1. Have you ever get stuck in a traffic congestion?
Figure 3.2: Question 1
This question is used to determine whether traffic jam is a frequent occurrence to the public.
2. How do you feel when you are stuck in traffic congestion?
Figure 3.3: Question 2
This question is to prove the validity of the findings of the research done by Frost and Sullivan’s which said that traffic jam is the most frustrating problem. 5 levels of feelings are provided, namely Very Happy, Happy, Normal, Bad and Frustrating.
46 3. Does traffic congestion affects your emotions?
Figure 3.4: Question 3
According to Krome et.al. (n.d.), people tends to get stressed during traffic jam, especially a prolonged traffic jam. Mayo Clinic (2013) reported that stress will cause change in behaviour of a person as the result of the bad emotions that come from stress.
By simple induction, we can see that traffic jam might cause change in people’s behaviour due to the stress generated from traffic jam. Hence, this question is used to investigate the change in mood of the people after the traffic jam.
4. How often did you get stuck in traffic congestion?
Figure 3.5: Question 4
This question is to determine the frequency of traffic jam occurrence. To make the calculation easier, 5 scales are provided, namely very few (<3 times a week), few (4- 6 times a week), Median (7-9 times a week), Frequent (10-12 times a week), and Very frequent (>13 times a week). Respondents are allowed to choose of the 5 scales provided.
47 5. Where did you get stuck in traffic jam usually?
Figure 3.6: Question 5
According to the news report by The Star, traffic congestion usually occur in town areas and highways. Therefore, this question is used to verify the area prone to traffic congestion.
6. What is the longest time you are stuck in traffic congestion?
Figure 3.7: Question 6
This question is used to determine the seriousness of traffic congestion. For traffic jam less than one hour, it is considered as light traffic jam. If the traffic jam lasts for more than one hour but less than 3 hours, it is considered as a medium traffic jam. For traffic jam that lasted for more than 3 hours, the traffic jam is considered as severe.
48 7. Do you agree that traffic congestion can increase the risk of road accidents?
Figure 3.8: Question 7
This question is to obtain the perceptions of the public regarding the impact of traffic congestion to the safety on road. Respondents who choose yes implies that the respondent acknowledge the increase in risk for road accident during traffic jam, while those who choose no implies the reverse of the statement above.
8. Imagine you have an autopilot system which drives your car automatically when you are trapped in traffic jam. What is your perceptions about the system?
Figure 3.9: Question 8
This question is to obtain the perceptions of the public regarding the autopilot system.
The first option implies full support, and as the options goes down the confident level drops, with the last options implying that the respondent does not accept this idea at all. Open ended response are also allowed via the other field.
49 9. FYI, Audi A8 and Mercedes Benz S-class sedan are equipped with an autopilot
system which can automate the driving process. Are you aware of these system?
Figure 3.10: Question 9
This question helps to determine the competitiveness of the product. As autopilot system is a new system in Malaysia, people might not be aware of this technology and therefore the autopilot system will become something new that creates a competitive advantage for the manufacturing company. If the respondent choose yes, this means the respondent is aware of autopilot system, while those who choose no indicates that autopilot system is something that might interest them.
10. How much are you willing to pay for the system (Excluding the cars)?
Figure 3.11: Question 10
This question is used to determine the acceptable price range for the proposed system.
To improve the quality of the survey, the option to limit one response from one computer is selected. Then, a working prototype for the project will be built to conduct testing on the system.
After that, several lab tests covering the effectiveness of the designed system, the efficiency of the system and the cost required for the implementation will be conducted in the Machine Intelligence Lab in Universiti Teknologi PETRONAS.
50 The following diagram shows the proposed program flow.
The hardware used in the prototype is ultrasonic sensor. The function for this sensor is to detect the vehicles in front of the robot and measure the distance from the vehicle in front.
3.4.2 Prototype and the coding
The prototype will be constructed with a Lego home set and 2 ultrasonic sensor. The proposed design of the robot will look like this:
Figure 3.12: Design of the Prototype
Another Lego brick with 4 touch sensors will connect to this robot to simulate manual control of the robot.
2 ultrasonic sensors are used to detect the movement of the object in front of the robot.
The proposed prototype of the robot will have the following functions:
1. Follow the vehicle in front (Autopilot System)
2. Stop the Autopilot system when there’s input for manual control 3. Stop autopilot system when the traffic jam is eased
4. Alert the driver when the car in front is reversing The coding can be found at the appendix of this documents.
Infrared Sensor Steering
System Steering
System Ultrasonic
Sensors Control
System
Thrust System
51 3.5 Evaluation Method
3.5.1 Project Simulations Environment
A working environment of the proposed prototype will be built in the Machine Intelligence Lab of UTP. The design of the roads will looked like the following diagram:
One remote control vehicles will be used to simulate the 6 conditions of traffic jam proposed in the methodology. The vehicles will be controlled by one person to conduct the test effectively.
To analyse the effectiveness of the prototype, the runway track is broken up into 5 major sections, which is 2 straight driving track, 2 tracks for driving at turns, and 1 track for sharp turns testing. Each major section is broken up into 5 small sections except sharp turning section.
The error hits by the prototype is recorded. For each iteration of the development process, the prototype will be tested with 1 toys cars in the Machine Intelligence Lab under 6 important scenarios listed below:
a. Traffic jam in straight road b. Traffic jam and turns occur c. Traffic jam and reach junction
d. Interference from driver during the execution of autopilot system e. Driver alert after traffic jam is over
f. Alert driver when the vehicle in front is reversing Figure 3.13: The Runway Track for Testing
Walkways for the robot
52 When the prototype produces a wrong output, the incident will be recorded as an error hit and the process continues until all scenarios are tested. Each test case are repeated for 5 times to ensure the performance of the prototype (Niu, Yan, Wang, Min,
& Hu, 2013). This also ensures the reliability of the test result (Wikipedia, 2015).
As each track section is broken up into 5 small sections (except sharp turn’s section), the accuracy of the prototype for each iteration of the test case is as follow:
𝐴𝑐𝑐𝑢𝑟𝑎𝑐𝑦 𝑅𝑎𝑡𝑒 = 𝑁𝑢𝑚𝑏𝑒𝑟 𝑜𝑓 𝑆𝑒𝑐𝑡𝑖𝑜𝑛 𝑃𝑎𝑠𝑠𝑒𝑑 𝑤𝑖𝑡ℎ𝑜𝑢𝑡 𝐸𝑟𝑟𝑜𝑟
𝑇𝑜𝑡𝑎𝑙 𝑆𝑒𝑐𝑡𝑖𝑜𝑛 × 100%
The Average Accuracy Rate for the test case is then calculated by calculating the average of the accuracy rate for each trial of the test case.
Table 3.2: Table Used for Testing
Trials Error Register Accuracy
Rate Section 1 Section 2 Section 3 Section 4 Section 5
1 X 80%
2 100%
3 X 80%
4 100%
5 100%
Average Accuracy Rate: 92%
The ‘X’ in the table above represent an error made by the prototype. For the example shown in the table above, the prototype made an error at the first section of the first trial and the second section of the third trial. Thus the accuracy rate is 92%.
53 3.5.2 Test Cases
7 test cases for the testing of this project as defined below:
Test Case ID TC01
Condition Traffic Jam in Straight Road
Test Procedure 1.0 The remote controlled car is put in front of the TJAssist robot which is situated in a straight path of the walkway.
2.0 The autopilot system is activated.
3.0 The remote controlled car is moved forward slowly along the path.
4.0 Any error made by the robot is recorded Input Expected Result Special
Procedural Requirements
Intercase Dependency Car movement of
the remote
controlled car
TJAssist robot should be able to follow the front car effectively.
None None
Test Case ID TC02
Condition Traffic Jam and turns occur
Test Procedure 1.0 The remote controlled car is put in front of the TJAssist robot which is situated in a curved path of the walkway.
2.0 The autopilot system is activated.
3.0 The remote controlled car is moved forward slowly along the path.
4.0 Any error made by the robot is recorded Input Expected Result Special
Procedural Requirements
Intercase Dependency Car movement of
the remote
controlled car
TJAssist robot should be able to follow the front car effectively.
None None
54 Test Case ID TC03
Condition Traffic Jam reach Junction
Test Procedure 1.0 The remote controlled car is put in front of the TJAssist robot which is situated in a junction part of the walkway.
2.0 The autopilot system is activated.
3.0 The remote controlled car is moved forward slowly.
4.0 Any error made by the robot is recorded Input Expected Result Special
Procedural Requirements
Intercase Dependency Car movement of
the remote
controlled car
TJAssist robot should stop and alert the driver to take charge.
None None
Test Case ID TC04
Condition Interference from driver during execution of autopilot system Test Procedure 1.0 The remote controlled car is put in front of the TJAssist
robot which is situated on the straight path of the walkway.
2.0 Test Case TC01 is executed.
3.0 Input from infrared bacon is sent to the TJAssist.
4.0 Any error made by the robot is recorded.
Input Expected Result Special Procedural Requirements
Intercase Dependency Car movement of
the remote
controlled car, input from control block
TJAssist robot should stop the autopilot system and inform driver about it.
None None
Test Case ID TC05
Condition Driver alert after traffic Jam is over
Test Procedure 1.0 The remote controlled car is put in front of the TJAssist robot which is situated on the straight path of the walkway.
2.0 Test Case TC01 is executed.
3.0 The remote car in front of the robot is moved very fast away from the robot.
4.0 Any error made by the robot is recorded.
Input Expected Result Special Procedural Requirements
Intercase Dependency Car movement of
the remote
controlled car
TJAssist robot should stop the autopilot system and inform driver about it.
None None
55 Test Case ID TC06
Condition Vehicle in front reversing
Test Procedure 1.0 The remote controlled car is put in front of the TJAssist robot which is situated on the straight path of the walkway.
2.0 Test Case TC01 is executed for 2 seconds.
3.0 The remote car in front of the robot is reversed.
4.0 Any error made by the robot is recorded.
Input Expected Result Special Procedural Requirements
Intercase Dependency Car movement of
the remote
controlled car
TJAssist robot should warn the driver about the situation.
None None
Test Case ID TC07
Condition Voice alert during autopilot
Test Procedure 1.0 Any of the dependant test cases are excuted.
2.0 Any voice produced by the robot are verified against the movement produced by the robot..
Input Expected Result Special Procedural Requirements
Intercase Dependency Car movement of
the remote
controlled car
TJAssist robot should notify driver about the driving action taken.
None TC01, TC02,
TC03, TC04, TC05
56
CHAPTER 4
RESULT AND DISCUSSION
4.1 Online Survey Result and Discussion
For this online survey, 44 responses are received, and here are the results from the survey:
Question 1
Figure 4.1: Result for Question 1
57 From the graph above, we can see that almost everyone face the problem of traffic jam with 42 out of 22 respondents choose “Yes”. The result from question 1 proved that the theory proposed by “Slow traffic along expressway” (2011) is correct.
Indeed, traffic jam is a problem faced by everyone almost every day, especially when our country is still very much reliant of private transportation as indicated by the statistics provided by Tong (2014). Due to traffic jam, many time is wasted for nothing and therefore something need to be done to reduce the waste of time.
58 Question 2
From the diagram above, 81.81% agrees that traffic jam is frustrating, with 45.45%
thinks that traffic jam is very frustrating. Only 18.18% feels normal with the traffic jam.
This result complies with the findings by Frost & Sullivan which said that 41%
Malaysian ranked traffic jam as their top frustration. One of the factor which might be responsible for the feeling of frustration is the fatigue in the driver’s mind. In traffic jam, although the vehicle are not able to move much, but full driver attention is still required to keep up with the traffic flow and also to prevent anything bad. However, slow traffic speed reduce the possibilities of movement by the driver, which in turn makes the driver feel less productive and helpless. As time goes on, the feeling caused a fatigue to the driver’s mind, and that’s when the driver feels frustrated.
Figure 4.2: Result for Question 2
59 Question 3
Figure 4.3: Result for Question 3
Out of the 44 respondents for this survey, only 20.45% felt stressed after a traffic jam. This does not fit the research by Krome et. al. which reported that people tends to get stressed after traffic jam. The reason for this result might be people who live in Kuala Lumpur are used to the traffic jam situation. Hence, they will either try to avoid the peak hours for traffic jam or choose a road with smoother traffic. As a result, they doesn’t feel that stressed during traffic jam.
However, with combined negative emotion change of 63.64% (13.64% tends to get angry plus 50% tends to get mood less), we can see that traffic jam does bring upon negative impact on the psychology of the driver. As driver must focus on the road
60 condition even though they can’t move too much, they might feel very tired due to the prolonged attention. That explains why 50% of the respondents choose the third option, which stated that they are tired after the traffic jam. Hence, a system that helps the driver to utilize the time during traffic congestion helps to solve this problem.
61 Question 4
Figure 4.4: Result for Question 4
On the frequency of traffic jam, 61.36% face less than 3 traffic jams per week.
11.36% encountered traffic jam 4-6 times a week, 18.18% 7-9 times, 2.27% 10-12 times and 6.82% more than 13 times.
As mentioned in the introduction part, traffic jam usually happens during peak hours like clock in period in the morning or clock out period in the evening. Usually workers who has experienced a traffic jam before will attempt to avoid the peak hours to prevent themselves from getting stuck in traffic jam. Therefore, the number of traffic jam they experience should be less than 2 peak hour × 5 days a work week = 10 times.
That explains why traffic jam more than 10 times a week is considered as frequent in the questionnaire.
62 However, the result does not comply with the theory stated above as 61.36% of the respondents stated that they face less than 3 traffic jam per week. This might be due to the source of the respondent sample. As the survey is conducted in KL Convention Centre, which is a place that can be accessed easily via Light Rail Transit (LRT), people tends to choose LRT as their transport instead of private car. That explains why they face less traffic jam a week.
63 Question 5
Figure 4.5: Results for Question 5
From the graph above, 81.82% reported they experienced traffic jam at town area, followed by highways (13.64%). This result comply with the reports by The Star which stated that most of the traffic jam occurs at town areas and highways.
The reason behind this is because town area is the centre hub for most of the daily activities of the people. For example, people works in the town area, housewives shops at the shopping mall located in town, teens watch movies and have fun at movie theatre and shopping complex located mainly in town. As a result, most of the transportation flows toward the town, which caused the traffic jam in town area.
64 For the traffic jam on highways, the reason is mainly because the major road system in Malaysia is made up of highways. Ignoring the roads in the rural areas and in between the town areas, the remaining roads will be highways. For example, North- South Expressway, New Pantai Expressway, Damansara-Puchong Expressway, Ipoh- Lumut Expressway, and many more (Wikipedia, 2015). Hence, people who drives will eventually use one of these highways to travel to their designated destination. As a result, highways are more prone to traffic jam.
65 Question 6
Figure 4.6: Results for Question 6
From the graph above, we can see that most of the respondents are stuck in the traffic jam for around 1 to 3 hours, with 56.82% selecting the respective options. Not to forget, 6.82% get stuck in traffic jam for more than 3 hours.
According to Tong (2014), an average person is trapped in traffic jam for one to four hours. This is supported by the result of question 5. This can be explained by the travel path. If the travel path is from city area to rural area, the traffic jam condition will cease when they reach rural areas. However, if the travel path is from city area to city area, the traffic jam condition might continue to exist until the driver drives to the rural area.
66 Question 7
Figure 4.7: Result for Question 7
From the chart above, we can see that most of the respondents agree that traffic increases the risk for road accidents. The reason behind this is because of the slow traffic flow. During traffic congestion, many cars are gathered on the road. As the driver follow the traffic flow, some people will change to a faster lane, while some will change lane to another road. However, due to the small space for lane changing, road accidents can happen easily.