VE Series Smart Camera
Instruction Manual
Original Instructions 191666 Rev. B 31 October 2016
© Banner Engineering Corp. All rights reserved
Contents
1 Product Description ... 6
1.1 Models ...6
2 Overview ... 7
2.1 Features ... 7
2.1.1 Display ... 7
2.1.2 Indicators ...7
2.1.3 Buttons ...7
2.2 Vision Manager Software ...8
3 Specifications and Requirements ... 9
3.1 Specifications ... 9
3.2 PC Requirements ... 9
3.3 Dimensions ... 10
3.4 Banner Engineering Corp. Software Copyright Notice ...11
4 Installation Instructions ... 12
4.1 Install the Accessories ...12
4.2 Mount the Sensor ... 12
4.3 Connect the Cables ...12
4.3.1 Wiring Diagrams ...13
4.4 Install the Software ... 15
5 Getting Started ... 16
5.1 Connect to the Sensor ...16
5.2 Acquire a Good Image ...16
5.3 Set Up an Inspection ... 17
5.3.1 Add a Tool ... 17
5.3.2 Rename a Tool ... 18
5.3.3 Name an Inspection ... 19
5.3.4 Save an Inspection to a Computer, Network Drive, or Storage Device ... 19
5.3.5 Modify a Currently Running Inspection ...19
5.3.6 Copy a Tool ... 20
5.3.7 Delete a Tool ...20
5.3.8 Delete a Tool and All Tools After It ... 20
5.3.9 Delete an Inspection ... 20
5.4 Configure the Discrete I/O ...21
6 Vision Manager Workspace ... 22
6.1 Home Screen ...22
6.1.1 Sensor Neighborhood ... 22
6.1.2 Sensor Maintenance ...24
6.1.3 Emulators ...25
6.1.4 About ...26
6.2 Sensor Screen ... 26
6.2.1 Image Pane Parameters ...26
6.2.2 Summary Pane ...27
6.2.3 Tools & Results ...28
6.2.4 Tools Only ... 28
6.2.5 All Results ... 29
6.3 Inspection Logs Screen ... 30
6.3.1 Log Sources ... 30
6.3.2 Loaded Logs ...31
6.4 Inspection Management Screen ...31
6.4.1 Manage ... 32
6.4.2 Transfer ... 33
6.5 System Settings Screen ... 34
6.5.1 Sensor Info ...34
6.5.2 Discrete I/O ... 34
6.5.3 Communications ...36
6.5.4 Logs ... 39
6.5.5 Units ...41
6.5.6 System Reset ...44
7 Using the Camera Tool ... 45
7.1 Imager ... 45
7.2 Trigger ...46
7.3 Focus Information ... 47
7.4 External Strobe ...47
7.5 Camera Tool: Results ...48
8 Using the Inspection Tools: Vision Tools ...49
8.1 Average Gray Tool ...49
8.1.1 Average Gray Tool: Input Parameters ...49
8.1.2 Average Gray Tool: Test Parameters ... 51
8.1.3 Average Gray Tool: Results ... 52
8.1.4 Using the Average Gray Tool ... 52
8.2 Bead Tool ...53
8.2.1 Bead Tool: Input Parameters ...53
8.2.2 Bead Tool: Test Parameters ... 58
8.2.3 Bead Tool: Results ... 58
8.2.4 Bead Tool: Adjust the ROI ...59
8.2.5 Using the Bead Tool ... 61
8.3 Blemish Tool ...63
8.3.1 Blemish Tool: Input Parameters ...64
8.3.2 Blemish Tool: Test Parameters ... 66
8.3.3 Blemish Tool: Results ... 67
8.3.4 Using the Blemish Tool ... 67
8.4 Blob Tool ...68
8.4.1 Blob Tool: Input Parameters ...68
8.4.2 Blob Tool: Test Parameters ... 72
8.4.3 Blob Tool: Results ...73
8.4.4 Using the Blob Tool ... 76
8.5 Edge Tool ...79
8.5.1 Edge Tool: Input Parameters ...79
8.5.2 Edge Tool: Test Parameters ... 85
8.5.3 Edge Tool: Results ... 85
8.5.4 Using the Edge and Measure Tools ... 86
8.6 Locate Tool ...87
8.6.1 Locate Tool: Input Parameters ...88
8.6.2 Locate Tool: Test Parameters ... 94
8.6.3 Locate Tool: Results ...94
8.6.4 Using the Locate Tool ... 95
8.7 Match Tool ... 98
8.7.1 Match Tool: Input Parameters ... 98
8.7.2 Match Tool: Test Parameters ... 102
8.7.3 Match Tool: Results ...103
8.7.4 Using the Match Tool ... 104
8.7.5 Using Remote TEACH with the Match Tool ... 106
8.8 Object Tool ... 106
8.8.1 Object Tool: Input Parameters ... 106
8.8.2 Object Tool: Test Parameters ...112
8.8.3 Object Tool: Results ... 112
8.8.4 Using the Object Tool ... 113
9 Using the Inspection Tools: Analysis Tools ... 115
9.1 Math Tool ... 115
9.1.1 Math Tool: Input Parameters ... 115
9.1.2 Math Tool: Test Parameters ...117
9.1.3 Math Tool: Results ... 117
9.1.4 Using the Math Tool ... 118
9.2 Measure Tool ... 119
9.2.1 Measure Tool: Operations ... 119
9.2.2 Measure Tool: Input Parameters ... 120
9.2.3 Measure Tool: Test Parameters ... 122
9.2.4 Measure Tool: Results ... 122
9.2.5 Using the Edge and Measure Tools ... 123
9.3 Logic Tool ...125
9.3.1 Logic Tool: Input Parameters ...125
9.3.2 Logic Tool: Test Parameters ... 127
9.3.3 Logic Tool: Results ... 127
9.3.4 Using the Logic Tool ... 127
10 Emulators ... 130
10.1 Backup or Restore the Emulator ...130
11 Sensor Display ... 131
11.1 Sensor Display Interface ... 131
11.2 Locking and Unlocking the Sensor ... 131
11.3 Sensor Menu ... 132
11.4 Ethernet Menu (ETHER) ... 133
11.5 Product Change Menu (PCHANGE) ...133
11.6 Input/Output Menu (IO) ...133
11.7 Image Menu (IMAGE) ... 133
11.8 Information Menu (INFO) ...133
11.9 System Error Menu (SYSERR) ...134
11.10 Display Menu (DISPLAY) ... 134
11.11 Reboot Menu (REBOOT) ... 134
12 Communications Guide ... 135
12.1 Communication Summary ... 135
12.1.1 Communication Channels ... 135
12.1.2 Industrial Ethernet ... 135
12.1.3 Image Export ... 135
12.2 Enabling Communications ... 136
12.2.1 Setting Up Ethernet Communications ... 136
12.2.2 Windows 7 ... 136
12.2.3 Communications Channel Ports ... 137
13 Industrial Ethernet Overview ...138
13.1 Industrial Ethernet Setup ...138
13.1.1 Set the Industrial Ethernet Protocol (EtherNet/IP, PROFINET®, Modbus/TCP, PCCC) ... 138
13.1.2 Set the Trigger Mode ... 138
13.2 Supported Functions ... 138
13.2.1 Sensor Input Values ... 139
13.2.2 Sensor Output Values ... 139
13.3 EtherNet/IP ...139
13.3.1 Inputs to the Sensor (Outputs from the PLC) ... 142
13.3.2 Outputs from the Sensor (Inputs to the PLC) ... 143
13.3.3 Input and Output Bits ... 144
13.3.4 Sensor Pass/Fail Bits ...144
13.3.5 Tool-Specific Results: EtherNet/IP ... 144
13.3.6 Configuration Assembly Object ...146
13.3.7 Data Formats ...146
13.3.8 Minimum Requested Packet Inverval (RPI) Value ... 146
13.3.9 VE Series Smart Camera EDS File Installation in ControlLogix Software ... 146
13.3.10 RSLogix5000 Configuration ... 152
13.4 Modbus/TCP ...158
13.4.1 Sensor Input Values ... 163
13.4.2 Sensor Output Values ... 164
13.4.3 Input and Output Bits ... 164
13.4.4 Sensor Pass/Fail Bits ...165
13.4.5 Tool-Specific Results: Modbus/TCP ... 165
13.5 PLC5 and SLC 5 (PCCC) ... 166
13.5.1 Configuration ...169
13.5.2 Inputs to the Sensor (Outputs from the PLC) ... 173
13.5.3 Outputs from the Sensor (Inputs to the PLC) ... 173
13.5.4 Input and Output Bits ... 174
13.5.5 Sensor Pass/Fail Bits ...174
13.5.6 Tool-Specific Results: PCCC ... 174
13.6 PROFINET ... 176
13.6.1 General Station Description (GSD) File ... 176
13.6.2 VE Series camera PROFINET IO Data Model ... 176
13.6.3 Configure the VE Series Smart Camera for a PROFINET IO Connection ... 176
13.6.4 Description of Modules and Submodules ... 177
13.6.5 Description of Submodules ... 178
13.6.6 Configuration Instructions ... 184
13.7 Troubleshooting ...194
13.7.1 Industrial Ethernet Error Codes ... 194
13.7.2 PROFINET ... 194
14 Troubleshooting ...197
14.1 Vision Manager Error Codes ...197
15 Accessories ...208
15.1 Cordsets ...208
15.2 Brackets ... 208
15.3 Lenses ... 209
15.3.1 WVGA Lens Working Distance and Field of View ...209
15.3.2 1.3 MP Lens Working Distance and Field of View ...210
15.3.3 2 MP Lens Working Distance and Field of View ...210
15.4 C-Mount Lens Filter Models ... 211
15.5 Lens Cover ...211
15.6 Display Cover ...212
15.7 Ring Lights ...212
15.8 Interface Module ...212
15.9 Product CD ... 213
16 Product Support and Maintenance ... 214
16.1 Repairs ...214
16.2 Maintenance ...214
16.2.1 Clean the Sensor ...214
16.2.2 Clean the Lens ...214
16.2.3 Update the Software and Firmware ...214
16.3 Contact Us ... 214
16.4 Banner Engineering Corp Limited Warranty ... 215
1 Product Description
Self-contained Smart Camera with User-Friendly Vision Manager Software
• Banner’s free and easy-to-use Vision Manager Software provides a number of tools and capabilities that enable VE Series smart cameras to solve a wide range of vision applications, such as item detection, part positioning, feature measurement and flaw analysis
• Runtime editing capability reduces costly downtime and the software emulator allows for offline building and troubleshooting of applications
• Factory communications (EtherNet IP, Modbus, and PROFINET) for integration on the manufacturing floor
• Six optically isolated I/O and an external light connector on the smart camera
• Two-line, eight-character onboard display provides smart camera information and focus number and makes it easy to update the smart camera settings, facilitating fast product changeover
• Robust metal housing with optional lens covers to achieve IP67 rating for use in harsh environments with heat, vibration, or moisture
• Bright indicator lights for easy viewing of smart camera status
WARNING: Not To Be Used for Personnel Protection
Never use this device as a sensing device for personnel protection. Doing so could lead to serious injury or death. This device does not include the self-checking redundant circuitry necessary to allow its use in personnel safety applications. A sensor failure or malfunction can cause either an energized or de-energized sensor output condition.
CAUTION: Electrostatic Discharge
Avoid the damage that electrostatic discharge (ESD) can cause to the Sensor.
Always use a proven method for preventing electrostatic discharge when installing a lens or attaching a cable.
CAUTION: Hot Surface
Use caution when handling the camera. The surface of the camera may be hot during operation and immediately after use.
1.1 Models
Model1 Resolution
VE200G1A WVGA, 752 × 480 pixels grayscale
VE201G1A 1.3 MP, 1280 × 1024 pixels grayscale
VE202G1A 2 MP, 1600 × 1200 pixels grayscale
1 Model VE202G2A, 2 MP, 1600 × 1200 grayscale with 4-pin D-code M12 Ethernet connection is also available.
2 Overview
The VE Series Smart Camera is easy to use and has advanced visual inspection capabilities for automation or control applications. Users can quickly set up the sensor using the Vision Manager software to solve a diverse range of applications on the factory floor.
2.1 Features
1 2
34 5
7
6 8
9 Figure 1. Sensor Features
1. Display 2. Buttons
3. Pass/Fail indicator (green/red)
4. Ready/Trigger indicator (green/amber) 5. Power/Error indicator (green/red) 6. Ethernet indicator (amber), not shown 7. Ethernet connection
8. Light connection
9. Power, Discrete I/O connection
2.1.1 Display
Figure 2. Display with Home Screen
The display is a 2-line, 8-character LCD. The main screen is the Home Screen, which shows the name of the current inspection and the slot number (inspection location). Use the display to view or change several sensor settings.
2.1.2 Indicators
Four LED indicators provide ongoing indication of the sensing status.
Power/Error Indicator Green = Normal operation Red = System error Ready/Trigger Indicator
Green = Ready for trigger Yellow = Trigger is active
OFF = Not ready for a trigger, triggers will be missed
Pass/Fail Indicator
Green = Previous inspection passed Red = Previous inspection failed OFF = No trigger since power up Ethernet Indicator
Amber solid = Ethernet connection Amber flashing = Ethernet activity OFF = no connection
2.1.3 Buttons
Use the sensor buttons Down , Up , Enter , and Escape to configure several sensor settings and to access sensor information. See Figure 257 on page 132 for additional information on using the buttons.
2.2 Vision Manager Software
The VE Series Smart Camera is set up using the free Vision Manager Software, available for download at www.bannerengineering.com.
This easy-to-use image processing software provides a variety of tools and capabilities to solve a wide range of vision applications such as item detection, part positioning, feature measurement and flaw analysis. Run-time editing allows you to make changes to an inspection while the sensor is running, reducing costly downtime. Vision Manager also includes a full software emulator, allowing users to develop or troubleshoot inspections offline, without a sensor.
3 Specifications and Requirements
3.1 Specifications
Power
12 V dc to 30 V dc (24 V dc ± 10% if a Banner light source is powered by the sensor)
Current: 400 mA maximum (exclusive of load and lights)
Use only with a suitable Class 2 power supply, or current limiting power supply rated 12 V to 30 V dc, 1 A
Supply Protection Circuitry
Protected against reverse polarity and transient overvoltages Discrete I/O
1 Trigger IN 5 Programmable I/O Output Configuration
Optically isolated Output Rating
Output Resistance: < 2 Ω Strobe Output Resistance: < 13 Ω Programmable Output: 100 mA External Strobe Output: 100 mA Off-State Leakage Current: < 100 µA External Light Maximum Current Draw
600 mA Exposure Time
0.02 ms to 500 ms Imager
VE200G1A: 6.9 mm × 5.5 mm, 8.7 mm diagonal (1/1.8-inch CMOS) VE201G1A: 6.9 mm × 5.5 mm, 8.7 mm diagonal (1/1.8-inch CMOS) VE202G1A: 7.2 mm × 5.4 mm, 9.0 mm diagonal (1/1.8-inch CMOS) VE202G2A: 7.2 mm × 5.4 mm, 9.0 mm diagonal (1/1.8-inch CMOS) Lens
C-mount Pixel Size
VE200G1A: 5.3 µm VE201G1A: 5.3 µm VE202G1A: 4.5 µm VE202G2A: 4.5 µm Communication
10/100/10002 Mbps Ethernet
Memory
Device Settings and Inspection Storage Memory: 500 MB Number of inspection files: 999
Acquisition
256 grayscale levels
Model Frames Per Second3 Image Size VE200G1A 60 fps, maximum 752 × 480 px VE201G1A 60 fps, maximum 1280 × 1024 px VE202G1A 50 fps, maximum 1600 × 1200 px VE202G2A 50 fps, maximum 1600 × 1200 px
Torque—Tapped Holes for Mounting Screws 8 lbf·in (0.9 N·m) maximum torque Construction
Housing: Aluminum Display Label: Polyester Connections
Ethernet: M12, 8-pin or 4-pin D-code Euro-style female Light Connector: M8, 3-pin Pico-style female Power, Discrete I/O: M12, 12-pin Euro-style male Environmental Rating
IEC IP67 with an optional lens cover properly installed Operating Conditions
Operating Temperature: 0 °C to +50 °C (+32 °F to +122 °F) 95% maximum relative humidity (non-condensing)
Stable Ambient Lighting: No large, quick changes in light level; no direct or reflected sunlight
Storage Temperature: −30 °C to +70 °C (−22 °F to +158 °F) Vibration and Mechanical Shock
Meets EN 60947-5-2: 30 G Shock per IEC 60068-2-27; 1 mm amplitude from 10 - 60 Hz per IEC 60068-2-6
Certifications
Information Technology Equipment E365235
3.2 PC Requirements
Operating System
Microsoft® Windows® operating system version 7, 8, or 104 System Type
32-bit, 64-bit Hard Drive Space
80 MB (plus up to 280 MB for Microsoft .NET 4.5, if not already installed)
Memory (RAM)
512 MB minimum, 1 GB+ recommended
Processor
1 GHz minimum, 2 GHz+ recommended Screen Resolution
1024 × 768 full color minimum, 1650 × 1050 full color recommended Third-Party Software
Microsoft .NET 4.5, PDF Viewer (such as Adobe Acrobat) USB Port
USB 3.0, recommended if a USB to Ethernet adapter used to communicate with the sensor
Important: Administrative rights are required to install the Vision Manager software.
2 1000 Mbps communication speed not available on 4-pin Ethernet models 3 This value can vary based on inspection settings.
4 Microsoft and Windows are registered trademarks of Microsoft Corporation in the United States and/or other countries.
3.3 Dimensions
All measurements are listed in millimeters [inches], unless noted otherwise.
3.4 Banner Engineering Corp. Software Copyright Notice
This software is protected by copyright, trade secret, and other intellectual property laws. You are only granted the right to use the software and only for the purposes described by Banner. Banner reserves all other rights in this software. For so long as you have obtained an authorized copy of this software directly from Banner, Banner grants you a limited, nonexclusive, nontransferable right and license to use this software.
You agree not to use, nor permit any third party to use, this software or content in a manner that violates any applicable law, regulation or terms of use under this Agreement. You agree that you will not reproduce, modify, copy, deconstruct, sell, trade or resell this software or make it available to any file-sharing or application hosting service.
Disclaimer of Warranties. Your use of this software is entirely at your own risk, except as described in this agreement. This software is provided "AS-IS." To the maximum extent permitted by applicable law, Banner, it affiliates, and its channel partners disclaim all warranties, expressed or implied, including any warranty that the software is fit for a particular purpose, title, merchantability, data loss, non-interference with or non-infringement of any intellectual property rights, or the accuracy, reliability, quality or content in or linked to the services. Banner and its affiliates and channel partners do not warrant that the services are secure, free from bugs, viruses, interruption, errors, theft or destruction. If the exclusions for implied warranties do not apply to you, any implied warranties are limited to 60 days from the date of first use of this software.
Limitation of Liability and Indemnity. Banner, its affiliates and channel partners are not liable for indirect, special, incidental, punitive or consequential damages, damages relating to corruption, security, loss or theft of data, viruses, spyware, loss of business, revenue, profits, or investment, or use of software or hardware that does not meet Banner minimum systems requirements. The above limitations apply even if Banner and its affiliates and channel partners have been advised of the possibility of such damages. This Agreement sets forth the entire liability of Banner, its affiliates and your exclusive remedy with respect to the software use. You agree to indemnify and hold Banner and its affiliates and channel partners harmless from any and all claims, liability and expenses, including reasonable attorney's fees and costs, arising out of your use of the Services or breach of this Agreement (collectively referred to as "Claims"). Banner reserves the right at its sole discretion and at its own expense, to assume the exclusive defense and control of any Claims. You agree to reasonably cooperate as requested by Banner in defense of any Claims.
4 Installation Instructions
4.1 Install the Accessories
1
2 3 4 5
Figure 3. Install the Accessories
1. VE sensor
2. O-ring (used with the lens cover) 3. C-mount lens (available separately) 4. Filter (optional)
5. Lens cover (optional)
An external light (optional) is not shown.
NOTE: A lens cover and a ring light cannot be used together.
1. If you are using a lens cover: Remove the black thread protector (not shown) from the sensor (1).
2. If you are using a lens cover: Fit a single o-ring (2) into the undercut area behind the sensor threads.
3. Remove the yellow temporary imager cover (not shown) from the sensor.
CAUTION: Do not remove the imager cover until you are ready to install the lens. Do not touch the imager.
Dirt or dust on the imager can affect sensing reliability.
4. Remove any protective covers from the lens. Handle the lens carefully to avoid smudges and dirt on the optical elements.
5. Thread the lens (3) onto the sensor.
6. Make sure that the lens is focused; see Acquire a Good Image on page 16.
7. Use the thumbscrews on the lens to lock the focus and aperture rings and to prevent movement that can occur during cleaning or accidental contact.
8. If you are using a filter: Thread the filter (4) onto the front of the C-mount lens.
9. If you are using a linear polarization filter: Rotate the outer portion of the filter mount to determine the position where glare is reduced the most, and use the locking thumbscrew to fasten the filter in position.
10. If you are using a lens cover: Thread the lens cover (5) onto the threaded portion of the sensor.
11. Or, if you are using an external light bracket: Attach an external light bracket to the sensor using the provided hardware kit.
NOTE: For optimal imaging, provide adequate dissipation of heat. A good heat conductor, such as aluminum, may be required.
4.2 Mount the Sensor
1. If a bracket is needed, mount the sensor onto the bracket.
2. Mount the sensor (or the sensor and the bracket) to the machine or equipment at the desired location. Do not tighten the mounting screws at this time.
3. Check the sensor alignment.
4. Tighten the mounting screws to secure the sensor (or the sensor and the bracket) in the aligned position.
4.3 Connect the Cables
1 2 3
4
Figure 4. Cable Connections
1. Power, Discrete I/O connection 2. Light connection
3. Ethernet connection 4. Ethernet indicator
1. Connect the Ethernet cable to the sensor (3) and to the computer or Ethernet switch.
2. Connect the power, discrete I/O cable to the sensor (1), and the leads to the appropriate locations. See Table 1 on page 13 for the power, discrete I/O connections.
3. Connect the external light cable (optional) to the light connection (2) if the light is powered by the sensor.
CAUTION: Use Appropriate Power
If the light is powered by the sensor, the sensor power source must be 24 V dc. This connection is for Banner lights only.
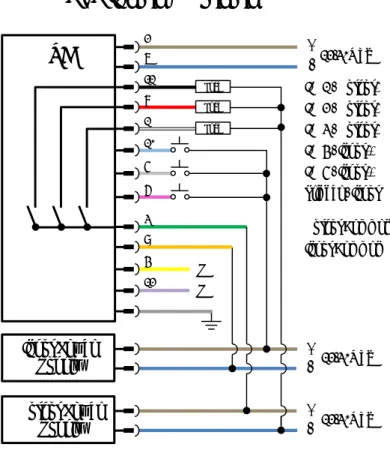
Table 1: Power and I/O Pinouts
Pin Wire Color Description Direction
1 White Discrete I/O #3 Input/Output
2 Brown 12 V dc to 30 V dc Input
3 Green I/O output common
Important: For PNP (sourcing) outputs connect pin 3 to +V dc, for NPN (sinking) outputs connect pin 3 to 0 V dc. The discrete I/O pins are 1, 5, 8, 10, and 11.
-
4 Yellow Reserved -
5 Gray Discrete I/O #5 Input/Output
6 Pink Trigger input Input
7 Blue Common Input
8 Red Discrete I/O #2 Input/Output
9 Orange I/O input common
Important: For PNP (sourcing) inputs connect pin 9 to 0 V dc, for NPN (sinking) inputs connect pin 9 to +V dc. The discrete I/O pins are 1, 5, 6, 8, 10, and 11.
-
10 Light Blue Discrete I/O #4 Input/Output
11 Black Discrete I/O #1 Input/Output
12 Violet Reserved -
Shield Bare metal Chassis ground -
4.3.1 Wiring Diagrams
VE
Load +
-
12-30V dc Output Power Supply Output Common
VE Output Figure 5. PNP Output
VE
+ 12-30V dc- Output Common VE Output
Load Output
Power Supply
Figure 6. NPN Output
VE
Input Common + - VE Input
Opto-isolator 12-30V dc
PNP Driver Input Power Supply
Figure 7. PNP Input
VE
Input Common +-
VE Input 12-30V dc Opto-isolator
Input Power Supply NPN Driver
Figure 8. NPN Input
PNP Inputs & Outputs
+ -
S S
+
+ -
-
VE
Input Power Supply
Output Power Supply
This is a typical example. Applications may vary.
*Programmable I/O shown set as an output in this example
**Programmable I/O shown set as an input in this example
1 = White 2 = Brown 3 = Green 4 = Yellow 5 = Gray 6 = Pink 7 = Blue 8 = Red 9 = Orange 10 = Light Blue 11 = Black 12 = Violet S = Shield
2 7 11 8 1 10 5 6 3 9 4 12
Load Load Load
I/O 1 - Output*
I/O 2 - Output*
I/O 3 - Output*
I/O 4 - Input**
I/O 5 - Input**
Trigger - Input Output Common Input Common
12-30V dc 12-30V dc
12-30V dc
Figure 9. PNP Inputs and Outputs
NPN Inputs & Outputs
+ -
S S
+
+ -
-
VE
Input Power Supply
Output Power Supply
This is a typical example. Applications may vary.
*Programmable I/O shown set as an output in this example
**Programmable I/O shown set as an input in this example
1 = White 2 = Brown 3 = Green 4 = Yellow 5 = Gray 6 = Pink 7 = Blue 8 = Red 9 = Orange 10 = Light Blue 11 = Black 12 = Violet S = Shield
7 11 8 1 10 5 6 3 9 4 12 2
Load Load Load
I/O 1 - Output*
I/O 2 - Output*
I/O 3 - Output*
I/O 4 - Input**
I/O 5 - Input**
Trigger - Input Output Common Input Common
12-30V dc 12-30V dc
12-30V dc
Figure 10. NPN Inputs and Outputs
4.4 Install the Software
Important: Administrative rights are required to install the Vision Manager software.
1. Download the latest version of the software from www.bannerengineering.com.
2. Navigate to and open the downloaded file.
3. Click Next to begin the installation process.
4. Confirm the software destination and availability for users and click Next.
5. Click Install to install the software.
6. Depending on your system settings, a popup window may appear prompting to allow Vision Manager to make changes to your computer. Click Yes.
7. Click Close to exit the installer.
5 Getting Started
Power up the sensor, and verify that the power/error LED is ON green and that the Ethernet indicator is ON amber to verify the Ethernet connection.
5.1 Connect to the Sensor
These instructions use Windows® operating system version 7, 8, or 10.5 1. Confirm the network connections.
a) Click the Start button, then on the Start menu, click Control Panel.
b) In Control Panel, click Network and Internet, then click Network and Sharing Center, and then click Change adapter settings.
c) Right-click on the connection that you want to change, then click Properties.
If you are prompted for an administrator password or confirmation, enter the password or provide confirmation.
d) In the connection properties, click Internet Protocol Version 4 (TCP/IPv4), and then click Properties.
Figure 11. Local Area Connection Properties
e) In the Internet Protocol (TCP/IPv4) Properties, select Use the following IP address.
f) Make sure that the IP address is 192.168.0.2, and the subnet mask is 255.255.255.0.
2. Open Vision Manager from the desktop or the Start menu.
The Sensor Neighborhood tab displays and lists the available sensors.
3. From Sensor Neighborhood, click to connect to the desired sensor.
The status changes from Available to Connected and the Sensor screen displays. Click to disconnect from the sensor.
4. If the desired sensor is not listed, verify that:
• The network adapter connected to the sensor has the same subnet mask as the sensor (for example,
192.168.0.xxx); view the subnet mask in the Network Adapters list at Home > Sensor Neighborhood >
Network Adapters
• The Ethernet cable is the correct type
• The TCP/IPv4 settings are correct Or, manually enter the sensor's IP address.
NOTE: The sensor's IP address and subnet mask are also available from the sensor display.
5.2 Acquire a Good Image
The sensor needs to capture a good image of each part to ensure that it correctly passes good parts and fails bad parts.
5 Windows is a registered trademark of Microsoft Corporation in the United States and/or other countries.
1. Make sure that the lighting is appropriate for your target. Use supplementary lighting, such as a ring light, if necessary.
2. Click the Sensor screen.
3. Click the camera tool on Tools and Results.
The Inputs parameters display.
4. Set the trigger.
a) Expand the Trigger parameters.
b) In the Trigger Mode list, click Internal (continuous images).
5. Run Auto Exposure.
a) Expand the Imager parameters.
b) Expand the Auto Exposure parameters, and click Start to run.
6. Check the lighting on the part.
• Make sure that the lighting is constant and consistent (unchanging over time, no shadows or hot spots).
• Capture the shape and form of the target object with lighting that optimizes its contrast and separates the feature of interest from the background. Depending on the target, consider other Banner lights.
• Adjust the mounting angle to provide the clearest image of the part features you are inspecting.
7. After checking and adjusting the lighting, run Auto Exposure a second time or adjust the exposure manually by expanding the Exposure parameters and moving the slider or entering a specific exposure time.
8. Adjust the focus.
a) Place the part so that the area to be focused appears in the center of the Image pane.
b) Expand the Focus Info parameters.
c) Make sure that the Focus Info checkbox is selected.
d) Adjust the focus of the lens while monitoring the focus number.
The focus number is a number between 1 and 255. Use the Image pane to determine when the image is sharp enough, or use the focus number as a guide. Turn the focus ring on the lens until the focus number is at the highest possible number between 1 and 255. The focus number is also available on the sensor display.
NOTE: There is no optimal value for this number, but it can be used as a guide if you are setting up more than one sensor that are focused on the same target.
e) Tighten the locking thumbscrews to secure the lens at the desired focus.
5.3 Set Up an Inspection
Vision Manager allows you to set up or make changes to an inspection while the sensor is running. Changes are automatically saved as they are made.
1. From the Sensor screen, click in the upper right corner to view the inspection list.
2. Click Add New Inspection.
A new inspection is added to the list, the Image pane updates, and the Tools & Results tab shows only the camera tool.
NOTE: The camera tool for the new inspection inherits the parameters of the camera tool for the previous inspection, however the two are not linked together.
3. Add tools and adjust them as needed for the inspection.
5.3.1 Add a Tool
1. Click on the Tools & Results tab.
The Add Tool window opens.
2. Click the desired tool.
Tool Name Description
Average Gray Evaluates pixel brightness within an ROI and computes the average grayscale value. See Average Gray Tool on page 49.
Bead Inspects parts for uniformity of adhesive or sealant material, or for uniformity of a gap. See Bead Tool on page 53.
Blemish Determines whether flaws are present on a part, or detects whether a feature exists on a part. See Blemish Tool on page 63.
Blob Detects and counts/locates groups of connected light or dark pixels within the ROI and designates them as blobs (Binary Large Objects). After blobs are found, they can be characterized by size and shape. See Blob Tool on page 68.
Edge Detects and counts transitions between bright and dark pixels (edges). Counts the total number of edges, and determines the position of each edge. See Edge Tool on page 79.
Locate Finds the first edge on a part and compensates for translation and rotation of downstream tools (if selected). See Locate Tool on page 87.
Match Verifies that a pattern, shape, or part in any orientation matches a reference pattern. Can also compensate for translation and rotation of downstream tools (if selected). See Match Tool on page 98.
Object Detects the edges of dark and bright segments and locates their midpoints. Counts dark and bright segments, and measures the width of each dark and bright segment. See Object Tool on page 106.
Math Performs mathematical operations using tool data or user-supplied constants. Includes basic arithmetic, inequality expressions, and statistical information. See Math Tool on page 115.
Measure Measures distance, calculates angles, and creates points and lines for use as inputs to other tools. See Measure Tool on page 119.
Logic Uses Boolean logic to combine or convert tool results, or to drive discrete outputs from tool results. Logic tool data can be used to evaluate the results of a single tool or multiple tools. See Logic Tool on page 125.
The tool is added to Tools & Results and the region of interest (ROI) appears on the Image pane.
3. Configure the tool as needed for your application.
a) Resize and rotate the ROI around the feature to be analyzed.
b) Define or view parameters for the tool on the Input tab, such as ROI shape, threshold, or view the histogram.
c) Define pass or fail criteria on the Test tab, such as the count, size, or match.
5.3.2 Rename a Tool
The default tool name is tool01, tool02, and so on, where the word tool is replaced by the appropriate name (for example, Locate01, Edge02, etc.).
1. On Tools & Results or on Tools Only, click the tool to select it.
2. Highlight the tool name.
3. Enter the desired tool name.
NOTE: Spaces and special characters are not allowed in the tool name.
5.3.3 Name an Inspection
The default inspection name is Inspection01, Inspection02, and so on. Rename the inspection to something meaningful to the application.
1. Click Inspection Management, then click Manage.
Figure 12. Manage 2. Double-click the name of the desired inspection.
3. Enter the new inspection name.
NOTE: Special characters are not allowed in the inspection name.
4. Press Enter or click off of the name to save the new name.
5.3.4 Save an Inspection to a Computer, Network Drive, or Storage Device
Vision Manager automatically saves inspections to the VE as they are created and modified. Save a copy of the inspection to your computer or another network location if you want to be able to go back to previous settings.
Use the following procedure to save a copy of an inspection to your computer or a network location.
1. On the Inspection Management screen, click Transfer.
Figure 13. Transfer 2. Change the destination folder, if desired.
a) Click above the right column.
An explorer window opens.
b) Navigate to the desired location, network location, or storage device.
c) Click Select Folder.
The folder is selected and the window closes.
The path to the location displays above the right column.
3. Select the desired inspection from the inspection list in the left column.
4. Click .
Inspection name.idb displays in the right column and the inspection is transferred (saved) to the selected location.
5.3.5 Modify a Currently Running Inspection
1. On the Sensor screen, select the desired inspection from the Inspection list.
The inspection tools and parameters display.
2. Make the desired modifications to the inspection.
Important: Changes are automatically saved as they are made. Save a copy of the inspection if you want to be able to go back to previous settings. Use the Emulator to set up or make changes to an inspection offline.
5.3.6 Copy a Tool
Duplicate (copy) a tool to include more than one of the same tool in an inspection.
1. Click the desired tool to duplicate.
2. Click .
A duplicate of the tool is created with the same input and test parameters.
3. Set the tool parameters as desired. The two tools are not linked; changes are independent of each other.
5.3.7 Delete a Tool
Use the following procedure to delete a tool from an inspection.
1. Click the tool on Tools & Results or Tools Only to select it.
2. Click .
The tool is deleted.
NOTE: There is no undo option. A deleted tool cannot be recovered.
5.3.8 Delete a Tool and All Tools After It
Use the following procedure to delete a selected tool and all of the tools after it.
1. Click the tool on Tools & Results or on Tools Only to select it.
2. Click .
The message "Remove selected tool and all tools after it?" displays.
3. Click Continue.
The tools are deleted.
NOTE: There is no undo option. Deleted tools cannot be recovered.
5.3.9 Delete an Inspection
1. Click Inspection Management, then click Manage.
2. Select the inspection to be deleted.
NOTE: This inspection cannot be running and it cannot be selected to begin at startup.
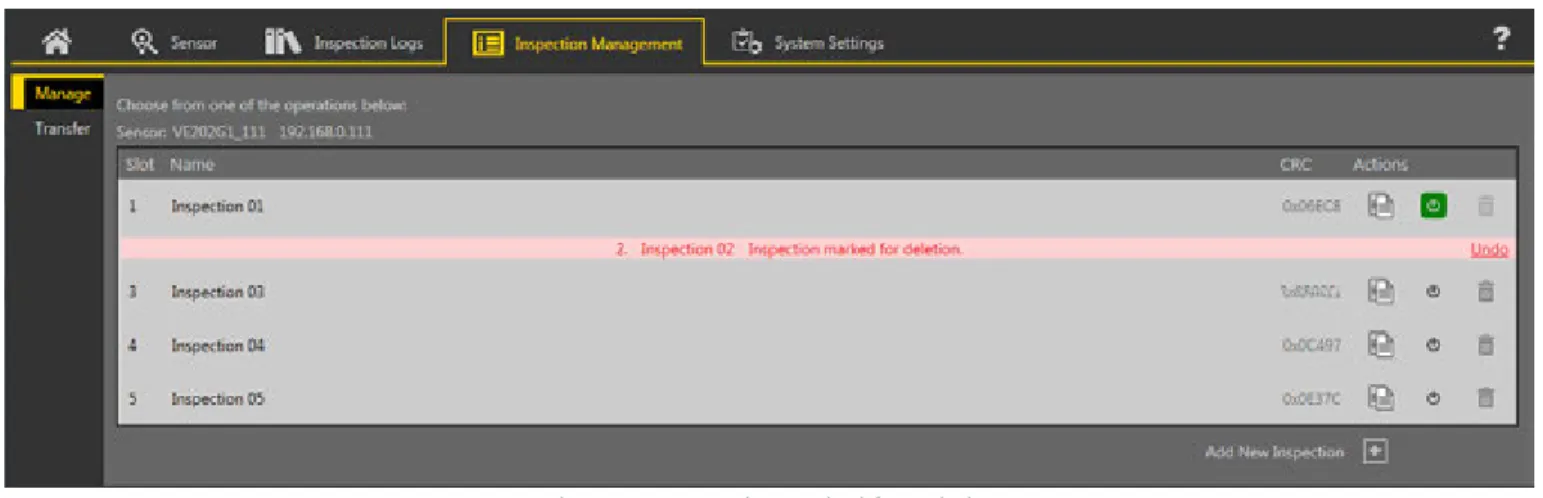
3. Click .
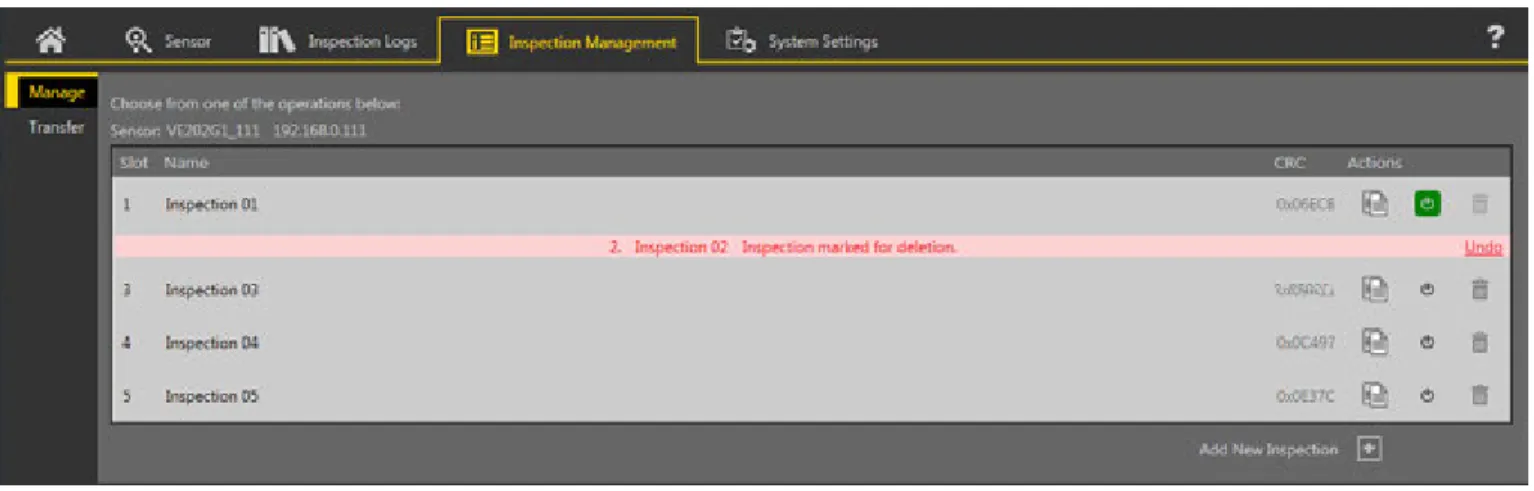
The inspection name turns red and "Inspection marked for deletion" displays.
Figure 14. Inspection Marked for Deletion 4. Click to another tab to delete the inspection, or click Undo to keep the inspection.
5.4 Configure the Discrete I/O
From the System Settings screen, select Discrete I/O to change the discrete I/O settings.
Figure 15. Discrete I/O For more details, see Discrete I/O on page 34.
6 Vision Manager Workspace
Vision Manager has five main working areas, or screens:
• Home Screen on page 22—The Home screen provides access to connect to a sensor or emulator, update firmware, and view sensor and Vision Manager software information.
• Sensor Screen on page 26— The Sensor screen displays the information needed to create or modify an inspection.
• Inspection Logs Screen on page 30— The Inspection Logs screen displays saved images and inspection information. Inspections logs can be viewed when the camera is offline.
• Inspection Management Screen on page 31—The Inspection Management screen includes options to add inspections to the currently connected sensor, to rename an inspection, and to transfer inspections between a connected sensor and a network location or storage device.
• System Settings Screen on page 34—The System Settings screen provides access to view and adjust sensor information, discrete I/O, communications settings, system logs, and units.
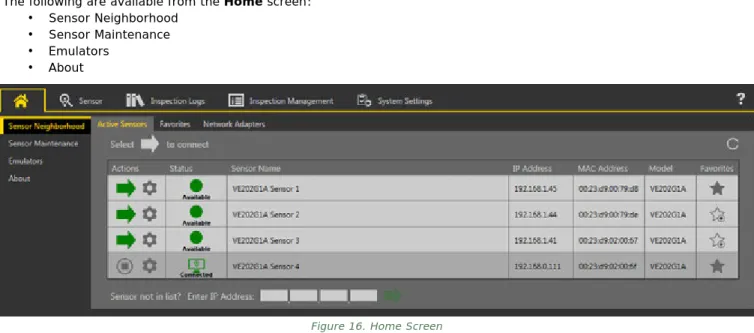
6.1 Home Screen
The Home screen provides access to connect to a sensor or emulator, update firmware, and view sensor and Vision Manager software information.
The following are available from the Home screen:
• Sensor Neighborhood
• Sensor Maintenance
• Emulators
• About
Figure 16. Home Screen
Only one sensor can be connected to each instance of the software. Open more than one instance of Vision Manager if you want to connect to more than one sensor at a time. Only one instance of the software can be connected to the Emulator at a time.
6.1.1 Sensor Neighborhood
Use Sensor Neighborhood on the Home screen to connect to active sensors. Sensor Neighborhood opens by default when the software is launched.
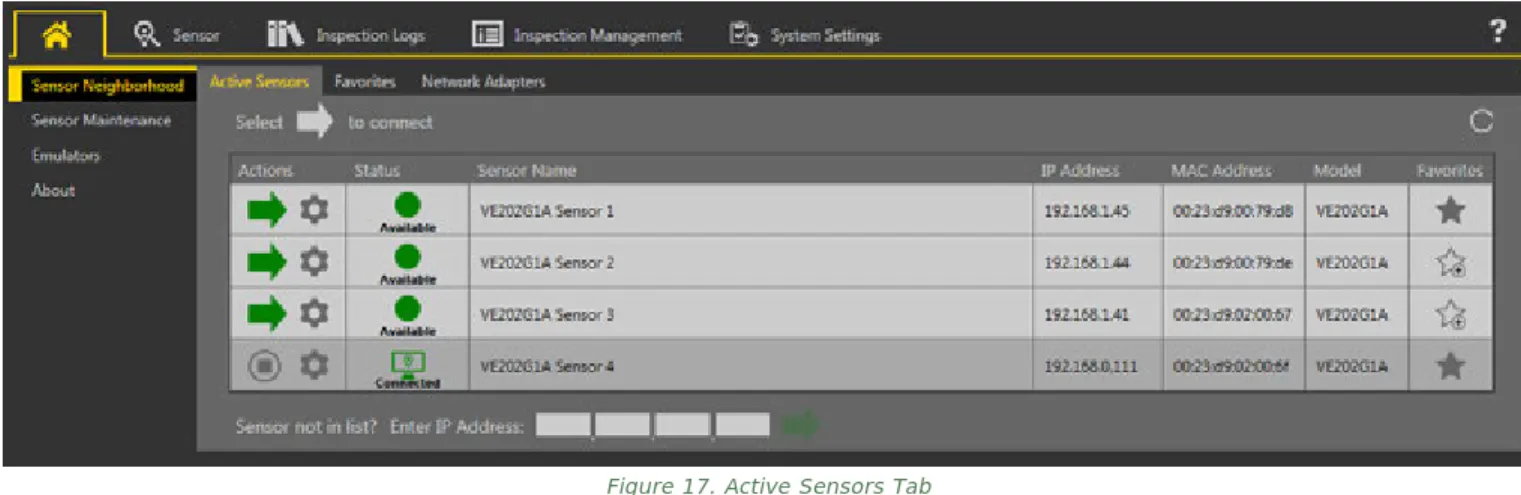
Active Sensors Tab
Use the Active Sensors tab in Sensor Neighborhood to connect to an active sensor.
Navigate: Home > Sensor Neighborhood > Active Sensors.
This tab includes sensor information such as sensor status, sensor name, IP address, MAC address, and model number.
Sensors can also be added to Favorites.
Figure 17. Active Sensors Tab
To connect to a sensor, click next to the desired sensor. To disconnect from a sensor, click .
To view or change sensor Status, MAC Address, Sensor Name, IP Address, Subnet Mask, and Gateway, click . To add the sensor to a Favorites Group, click . The icon changes to .
To manually connect to a sensor with a known IP address, enter the IP address in the Enter IP Address field and click .
Favorites Tab
Save sensors to the Favorites tab for easy access to them. Sensors are saved to groups.
Navigate: Home > Sensor Neighborhood > Favorites.
Figure 18. Favorites Tab
Click Add New Group to create a new Favorites Group. To add a sensor to the group, on the Active Sensors tab, click or from the Favorites tab, enter the sensor IP address and click to verify the connection to the sensor and automatically save it to the selected group.
To manually add a sensor with a known IP address to the Favorites tab, enter the IP address in the Enter IP Address field and select the desired group.
To remove a sensor from a group, click the across from the sensor name. To move the sensor to another group, click the and select the desired group.
To remove a group and all the sensors within the group, click the across from the group name.
Network Adapters Tab
Use the Network Adapters tab on Sensor Neighborhood to view the network adapters that the system searches to find sensors.
Navigate: Home > Sensor Neighborhood > Network Adapters.
Figure 19. Network Adapters Tab
Network adapter information including Link Status (connected/not connected), Adapter name, IP Address, and Subnet Mask is also available.
6.1.2 Sensor Maintenance
Use Sensor Maintenance on the Home screen to update the firmware on a sensor and to backup or restore the sensor.
Figure 20. Sensor Maintenance Tab
Sensor Maintenance includes sensor information such as sensor Status, Sensor Name, IP address, MAC address, Model number, Firmware Version, and which sensors are tagged as favorites.
Actions include update firmware , view or change some sensor settings , and backup or restore sensor data .
Update the Firmware
1. From the Home screen, click Sensor Maintenance.
2. Make sure that the desired sensor is not connected to the Vision Manager software and that the status is Available.
3. Click next to the sensor and follow the prompts.
NOTE: During the firmware update process, there are options to restore the sensor to the factory default settings and to create a backup before updating the firmware.
Important: All stored inspections are deleted when factory default settings are restored. Ethernet settings and favorites lists are retained.
This process can take several minutes. Do not close the program or remove power from the sensor during the update process.
When the process is complete, the sensor restarts and the status returns to Available. Vision Manager displays the new firmware version in the Firmware Version column.
Backup or Restore the Sensor
System settings and inspections can be backed up and restored. Firmware is not included in the backup or restore.
The backup file is saved to the location of your choice.
1. From the Home screen, click Sensor Maintenance.
2. Make sure that no sensors or emulators are connected to the Vision Manager software and that the desired sensor's status is Available.
3. Click , then click Backup.
4. Follow the prompts to save a backup file.
A message displays saying that the backup was successful.
5. To restore the sensor data, click , then click Restore.
6. Follow the prompts to restore the sensor data. An Emulator backup file can be used to restore the sensor.
NOTE: This process can take several minutes.
A message displays saying that the restore was successful.
6.1.3 Emulators
Use Emulators on the Home screen to connect to the emulator.
Figure 21. Emulators
Click to connect to the desired emulator. This tab also displays the Image location on the computer, as well as the emulator version information.
Click under Image Location to change the directory for the reference images. The default directory for images is C: >
Users > Public > Documents > Banner Vision Manager > VE Series > VE xMP > Images. Both 8-bit monochrome bitmap (BMP) images and inspection logs are supported. Bitmap images should be the same resolution as the VE camera.
If inspection logs are placed in the Images directory, the emulator automatically extracts the image out of the inspection log and uses it to run the currently loaded inspection.
The Emulators tab includes all available features and all tools function the same as they do when running on a sensor. On the emulator, execution time is not calculated.
Backup or Restore the Emulator
Emulator settings and inspections can be backed up and restored.
The backup file is saved to the location of your choice.
1. From the Home screen, click Emulators.
2. Make sure that no sensors or emulators are connected to the Vision Manager software.
3. Click , then click Backup.
4. Follow the prompts to save a backup file.
A message displays saying that the backup was successful.
5. To restore the sensor data, click , then click Restore.
6. Follow the prompts to restore the sensor data. A sensor backup file can be used to restore the emulator.
NOTE: This process can take several minutes.
A message displays saying that the restore was successful.
6.1.4 About
Use About to view Vision Manager software information, including the version number.
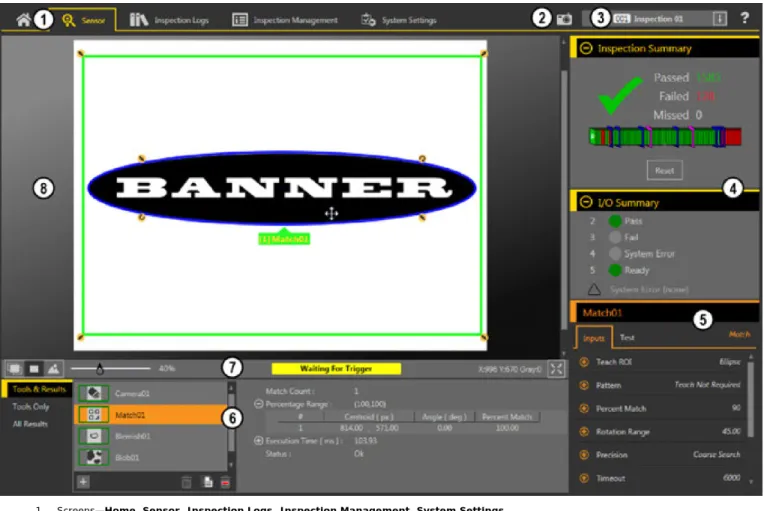
6.2 Sensor Screen
The Sensor screen displays the information needed to create or modify an inspection.
1. Screens—Home, Sensor, Inspection Logs, Inspection Management, System Settings 2. Manual Trigger button—Click to manually trigger the sensor
3. Inspection list—Select the desired inspection to start, and to view or modify the inspection 4. Summary pane—Includes the Inspection Summary and the I/O Summary
5. Parameters pane—Includes user-adjustable Inputs parameters or Test parameters for the tools in an inspection, depending on what is selected in the Tools and Results pane
6. Tools and Results pane—Includes Tools and Results, Tools Only, and All Results, which display the camera tool, the tools that are included in the current inspection, and the results of the inspection
7. Image Pane Parameters panel—Includes ROI view buttons, zoom, x and y coordinates, grayscale value, and full image display button, as well as sensor messages
8. Image pane—Displays the current image captured by the sensor; this includes the region of interest (ROI) for the tool for the selected inspection
Figure 22. Sensor Screen
6.2.1 Image Pane Parameters
Use the Image Pane Parameters to change how the Image pane displays and to view status messages.
Figure 23. Image Pane Parameters
ROI View Buttons
Click to view all tool ROIs and annotations.
Click to view the ROI and annotations for the selected tool only.
Click to hide all ROIs annotations and view the image only.
NOTE: The Image Overlays parameter for each tool also control which ROI is shown and this parameter overrides the ROI view buttons.
Zoom
Slide to zoom the Image pane in and out.
Status Messages
View status messages such as "Applying Changes" and "Waiting for Trigger". Some messages, such as "Applying Changes," display only momentarily while a parameter change is serviced by the sensor. Other messages such as
"Waiting for Trigger" require an action to be completed.
X and Y Coordinates and Grayscale Value
Displays the current x and y coordinates and grayscale value for the location the pointer is at in the Image pane.
Full Image Display Mode Button
Click to expand the image to fill the screen. The image pane and impage pane parameters are the only items shown. Click to return to the standard view.
6.2.2 Summary Pane
The Summary pane includes both the Inspection Summary and the I/O Summary.
When expanded, the Inspection Summary displays inspection pass, fail, and missed trigger statistics since the last time the inspection summary results were reset. A green checkmark indicates that an inspection passed, and a red X indicates that an inspection failed. A dash indicates that there is no information to display.
Figure 24. Inspection Summary
The History Trend below the pass/fail statistics provides another visual indication of whether or not an inspection passed, as well as an indication of when changes are made.
• Green indicates that an inspection passed
• Red indicates that an inspection failed
• Blue indicates that a change was made to the inspection
• Pink indicates that a product change was made—either a new inspection was added or the inspection was changed to a different one
The History Trend holds up to 400 entries and updates after an inspection is completed. The entries are recorded first in, first out, with the newest entry displayed on the left of the History Trend. Point to an entry on the History Trend for information about the entry. For example, pointing to a green entry displays the frame number.
Click Reset to clear the Inspection Summary statistics. The History Trend does not reset.
When collapsed, the Inspection Summary displays only pass and fail information. A green number on the left represents the number of inspections that passed. A red number on the right represents the number of inspections that failed since the last reset.
When expanded, the I/O Summary displays input and output status information and system errors, if present. When collapsed, no I/O Summary information is visible.
Figure 25. I/O Summary
Inputs and outputs display on the I/O Summary after they are configured from the System Settings screen (see Configure the Discrete I/O on page 21). Green indicates that the I/O is active. Light gray indicates that the I/O is inactive.
The System Error indicator flashes red when an error is present. View and clear the error from the System Settings screen (see Logs on page 39).
Figure 26. IO Summary with Error
6.2.3 Tools & Results
Tools & Results shows the camera tool and the inspection tools that are included in the current inspection, as well as the results for the currently selected tool.
Figure 27. Tools & Results
Use Tool & Results to add and configure tools in an inspection and to view results. Click a camera tool or inspection tool on Tools & Results to access the Parameters pane for that camera or tool.
See Using the Camera Tool on page 45, Using the Inspection Tools: Vision Tools on page 49, and Using the Inspection Tools: Analysis Tools on page 115 for additional tools information.
6.2.4 Tools Only
Tools Only shows the camera tool and the inspection tools that are included in the current inspection.
Figure 28. Tools Only
Use Tools Only to add and configure tools in an inspection. Click a camera tool or inspection tool on Tools Only to access the Parameters pane for that camera or tool.
See Using the Camera Tool on page 45, Using the Inspection Tools: Vision Tools on page 49, and Using the Inspection Tools: Analysis Tools on page 115 for additional tools information.
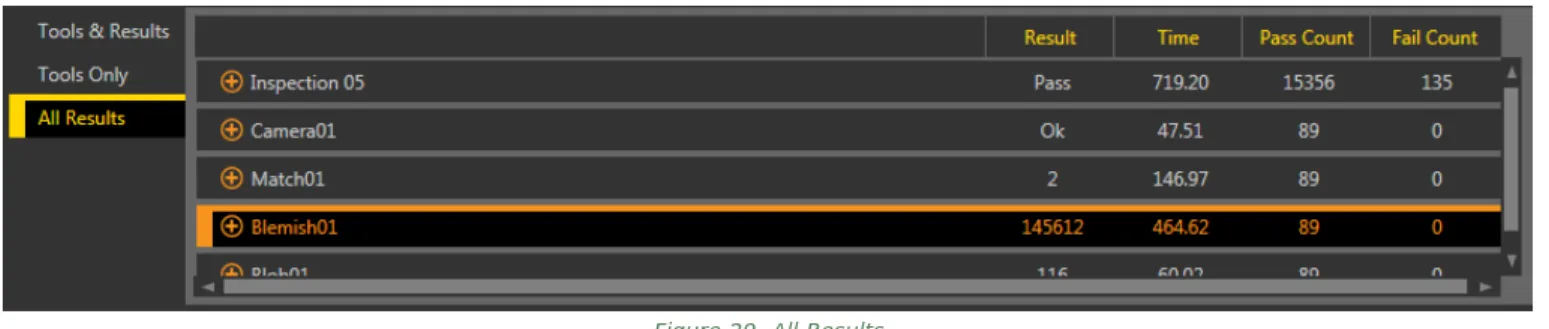
6.2.5 All Results
All Results lists the results for the current inspection, camera tool, and inspection tools.
Figure 29. All Results
At a glance, view the Result (pass/fail/status), execution Time (in milliseconds), Pass Count, and Fail Count for each item.
Expand each item for additional details.
6.3 Inspection Logs Screen
The Inspection Logs screen displays saved images and inspection information. Inspections logs can be viewed when the camera is offline.
1. Log Sources pane—Choose the source for the inspections logs to view, and set the criteria for collecting logs 2. Loaded Logs pane—View and filter the inspection logs
3. Image pane—Displays the saved inspection image captured by the sensor. This includes the tools that were used in that inspection 4. Summary pane—Displays saved information from a specific inspection and frame number
5. Parameters pane—Displays the logged Input or Test parameters, depending on what is selected in the Tools & Results pane
6. Tools and Results pane—Includes the Tools & Results tab, the Tools Only tab, and the All Results tab, which display the camera tool, the tools that are included in the logged frame, and the results of the inspection
7. Image Pane Parameters panel—Includes ROI view buttons, zoom, x and y coordinates, and grayscale value, as well as sensor messages Figure 30. Inspection Logs Screen
6.3.1 Log Sources
View logs from either the sensor or a network folder or storage device.
Click to move the inspection logs from the sensor to the computer. Click to navigate to saved inspection logs.
Thumbnail views of the images display in the Loaded Logs pane. While inspection logs are loading, the Percent Bar displays and shows the percentage of inspection logs that have loaded; it is removed when all inspection logs have finished loading.
Expand Sensor to set the criteria for what is collected in the inspection logs. Set the Log Criteria:
• All
• Pass Only
• Fail Only
• By Slot Number
• Remote Teach All
• Remote Teach Pass
• Remote Teach Fail Set the Strategy:
• First N Logs
• Last N Logs
Set the Capture Limit (limits the number of inspection logs the sensor holds in internal memory):
• Low Count
• Medium Count
• High Count
Filter logs to be viewed by pass , fail , remote teach , or inspection number using the buttons to the left of the inspection previews. Click to clear all filters.
6.3.2 Loaded Logs
After log information is loaded from the Log Sources pane, click on a thumbnail to view the full frame in the Image pane.
The Inspection Summary shows whether or not the inspection passed, which inspection was being used, and which frame number you are viewing. Click the camera tool or an inspection tool in the Tools and Results pane to view
additional logged information in the Parameters pane, such as camera exposure, the reference pattern, or the filters used during the inspection, as well as to view specific results for the frame.
NOTE: Some parameters are disabled in the Inspection Logs. For example, if histogram information was not collected during the inspection, it cannot be viewed from the log.
6.4 Inspection Management Screen
The Inspection Management screen includes options to add inspections to the currently connected sensor, to rename an inspection, and to transfer inspections between a connected sensor and a network location or storage device.
The following are available from the Inspection Management screen:
• Manage
• Transfer
The inspection CRC is listed for each inspection on both the Manage and Transfer screens. When an inspection is created, it is assigned a Cyclic Redundancy Check code, or CRC. The CRC is generated by considering each setting within the
inspection (this includes the input parameters of all tools). When a change is made to the input parameters of any tool within the inspection, a new CRC is generated. Because of this, CRC becomes a very simple yet powerful way to determine if a change was made to the inspection since the last time it was modified.
NOTE: Changing an inspection's name and slot number does not modify its CRC.
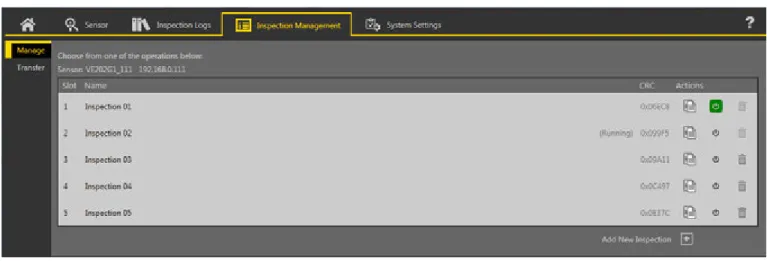
6.4.1 Manage
Use Manage to add new inspections, delete existing inspections, rename inspections, set an inspection to run at startup, or copy an inspection.
Figure 31. Manage
Also displayed are the sensor name, inspection name, and whether the inspection is running.
Copy an Inspection
Duplicate (copy) an inspection to use as a starting point for a new inspection.
1. On the Inspection Management screen, click Manage.
2. Locate the inspection to copy and click .
A duplicate of the inspection is created with the same tools and parameters and is added to the inspection list as Inspection (#).
3. Adjust the inspection as desired. The two inspections are not linked; changes are independent of each other.
Delete an Inspection
1. Click Inspection Management, then click Manage.
2. Select the inspection to be deleted.
NOTE: This inspection cannot be running and it cannot be selected to begin at startup.
3. Click .
The inspection name turns red and "Inspection marked for deletion" displays.
Figure 32. Inspection Marked for Deletion 4. Click to another tab to delete the inspection, or click Undo to keep the inspection.
Set an Inspection to Begin at Startup
NOTE: Only one inspection can begin at startup.
1. On the Inspection Management screen, click Manage.
2. Locate the desired inspection and click .
The turns green and the inspection will begin at the next startup.
6.4.2 Transfer
Use Transfer to transfer inspections between a connected sensor and a computer, network drive, or storage device.
Figure 33. Transfer
Click to navigate to and select a different folder. Click to open the folder to view the files.
Save an Inspection to a Computer, Network Drive, or Storage Device
Vision Manager automatically saves inspections to the VE as they are created and modified. Save a copy of the inspection to your computer or another network location if you want to be able to go back to previous settings.
Use the following procedure to save a copy of an inspection to your computer or a network location.
1. On the Inspection Management screen, click Transfer.
Figure 34. Transfer 2. Change the destination folder, if desired.
a) Click above the right column.
An explorer window opens.
b) Navigate to the desired location, network location, or storage device.
c) Click Select Folder.
The folder is selected and the window closes.
The path to the location displays above the right column.
3. Select the desired inspection from the inspection list in the left column.
4. Click .
Inspection name.idb displays in the right column and the inspection is transferred (saved) to the selected location.
Save Inspections to a VE Sensor
Inspections stored on a computer or network drive or created in the emulator can be saved to the connected VE sensor.
1. On the Inspection Management screen, click Transfer.
2. Select the desired location.
a) Click above the right column.
b) Navigate to the desired folder.
The path to the location displays above the right column.
3. In the list on the left, select (Next Empty Slot) to add the inspection to the list or select an existing inspection to replace.
4. Select the desired inspection from the list on the right.
5. Click .
Inspection name displays in the left column and the inspection is transferred to the sensor.
6.5 System Settings Screen
The System Settings screen provides access to view and adjust sensor information, discrete I/O, communications settings, system logs, and units.
The following are available from the System Settings screen:
• Sensor Info
• Discrete I/O
• Communications
• Logs
• Units
• System Reset
6.5.1 Sensor Info
Use Sensor Info to view or change sensor information, including sensor name, IP address, subnet mask, and gateway.
Figure 35. Sensor Info
Click to access the sensor properties editing window. Click to refresh the information.
• Sensor Name—View or change the sensor name
• Model—View the model number of the sensor
• Serial Number—View the serial number of the sensor
• Firmware Version—View the current firmware version of the sensor
• Up Time—View the amount of time the sensor has been running since it was last powered on
• Hour Count—View the number of hours the sensor has been powered on over its lifetime
• Boot Count—View the number of times the sensor has been powered on over its lifetime
6.5.2 Discrete I/O
Use Discrete I/O to view the I/O and pin numbers; view the status; and set the function, active level, output delay, latch type, and output duration for each pin.
From the System Settings screen, select Discrete I/O to change the discrete I/O settings.