02 04 07 46
INTRODUCTION COUNTRY PROFILE
PERFORMANCE HIGHLIGHTS
INDUSTRY STATISTICS AND INFORMATION
DISCLAIMER
The data and information in this report represents a fair and reasonable overview of the whole electricity supply industry. Every effort has been made to verify, validate and accurately represents the information in this report, based on the daily, monthly and yearly reports which were submitted by licensees pursuant to their license conditions. Where as, the information on the performance and statistics of utility in the state of Sarawak are submitted upon request by Sarawak Energy Berhad (SEB).
Energy Commission (EC) in good faith publishes this information for the consumption of the general public, in line with its function stipulated under the Act. EC disclaims all or any responsibility whatsoever to anyone for information contained in this report or for any representation or statement herein, whether expressed or implied, or for any responses given in response to any queries on or in relation to this report.
Electricity demand in Peninsular Malaysia increased by 7.8 percent from 94,748 GWh in 2009 to 102,139 GWh in 2010. Sales of electricity followed the same trend with a growth of 8.8 percent from 83,411 GWh in 2009 to settle at 90,770 GWh in 2010. The positive trend in electricity demand reflects the country’s situation recovering from economic turmoil in 2009. Another factor which influenced the country’s electricity demand was the climate change or the weather.
The highest maximum demand for the grid system in Peninsular Malaysia was recorded on 24th of May 2010. It showed about 5.8 percent growth from 14,245 MW in 2009 to 15,072 MW in 2010. The highest daily electricity demand was recorded on the 25th of May 2011 at 311.5 GWh, an increase of 7.4 percent compared to the previous year. In 2010, there was no additional installed generation capacity in Peninsular Malaysia. Therefore, the installed generation capacity remained at 21,817 MW as in the previous year.
About 7,040 MW or 32.3 percent were generated by Tenaga Nasional Berhad (TNB) while the remaining were by the Independent Power Producers (IPPs). In 2010, the reserve margin for Peninsular Malaysia stood at 45 percent.
In Sabah, the highest daily electricity demand increased by 4.2 percent, from 14.2 GWh in 2009 to 14.8 GWh in 2010. The maximum demand was recorded at 779.7 MW from only 718.8 MW in 2009, indicating an increase of 8.5 percent. Growth in sales of electricity significantly increased by 8.1 percent from 3,818 GWh in 2009 to 4,127 GWh in 2010. The growth in sales was attributed to higher electricity demand from both commercial and domestic sectors. At present, Sabah is still facing supply insufficiency issue due to low availability and reliability of some power generators, especially diesel-based generators.
In order to meet the demand for electricity, initiatives to close the gap between supply and demand have been taken, such as by planting up new generation plants. In 2010, an additional 160.5 MW generation capacity was connected to the Sabah grid through the commissioning of Ranhill Powertron II (RPII) GT1 with a capacity of 65 MW on 6 March 2010. This was followed by GT2 with the same capacity on 10 July 2010. The remaining generation capacity came from mobile generators, POIC Lahad Datu (20 MW), Teck Guan Biomass Plant (6 MW) and Mini Hydro Station, Sungai Pangapuyan, Kota Marudu (4.5 MW). In 2010, the total installed generation capacity in Sabah was 1,216.4 MW, whilst dependable capacity was 1,111.1 MW.
375 MW or 33.8 percent was generated by SESB and the remaining by IPPs. Due to low availability and reliability of oil/diesel fired power generation plants, the reserve margin calculation for Sabah is not a good benchmark for reliability.
In terms of the reporting system, in its effort towards improving the performance of electricity supply in Peninsular Malaysia, TNB has upgraded their existing system that record System Average Interruption Duration Index (SAIDI). The development of the new system, known as Enhanced TOMS involves the integration of several softwares such as TOMS (TNB Outage Management System), eCIBS (Electronic Customer Information System) and ERMS (Enterprise Resource Management System) which will provide more detailed and accurate report on SAIDI. SAIDI for 2010 based on Enhanced TOMS recorded a higher reading of 96.3 minutes/consumer/year compared with SAIDI based on TOMS at 62.9 minutes/consumer/year, a difference of 33.4 minutes/consumer/year. The higher reading of SAIDI recorded by Enhanced TOMS is due to the ability of the new system to automatically record all interruptions, hence giving more accurate information on the performance of TNB supply system. However, based on TOMS, the overall performance of TNB distribution system in 2010 has shown an improvement, as SAIDI was at 4 percent lower compared to the previous year.
Meanwhile, SAIDI for Sabah has improved significantly with a reduction of 76 percent from 2,868 minutes/consumer/
year in 2009 to 687 minutes/consumer/year in 2010. This significant reduction is a result of the commitment made by the government to achieve the target of 700 minutes/
consumer/year of SAIDI in Sabah for 2010. To support this effort, the Federal Government allocated a total of RM419 for SESB to carry out fast-track SAIDI improvement projects.
In its efforts to ensure sufficient supply of electricity subsequent to the cancellation of submarine cable project from Bakun Hydro Electric in Sarawak to Peninsular Malaysia, the Government decided to plant-up new generation capacities of 2 x 1,000 MW in the window of 2015 and 2016. In line with the move towards market liberalisation, the Government has taken the initiative to implement a competitive bidding process in the development of the new power plants. Worldwide, this process has resulted in optimised plant up costs. The concession for the first 1,000 MW coal-fired power plant has been awarded to TNB Janamanjung Sdn. Bhd. It is expected to be commissioned by March 2015, the development of the second 1,000 MW unit is to be awarded via a restricted competitive bidding process and is scheduled to be in operation by March 2016. The Energy Commission (EC) has been mandated by the Government to implement the first competitive bidding process. Due to the urgency to meet the targeted commisioning date, the bidding process was restricted to owners of existing brownfield power plant sites, i.e. Tanjung Bin Power Sdn. Bhd. and Jimah Energy Ventures Sdn. Bhd.
In the year 2010, crude oil price increased more steadily in comparison to the previous year. Brent Spot Price of crude oil per barrel stood at between USD 75 to USD 85, compared to between USD 45 to USD 100 in 2009. The other fuels, such as natural gas, medium fuel oil (MFO) and coal followed a similar trend. Rising price of fuels has caused the Government to bear increased subsidies. To address this issue, the Government announced its plan to undertake tariff revision every 6 months based on the market price of crude oil. However, the plan was put on hold in 2010 and the average electricity tariff for Peninsular Malaysia remained at 31.31 sen/kWh.
In its efforts to ease the burden of low-income consumers, the Government gave assistance such as:
i) Subsidies to domestic consumers whose electricity consumption cost do not exceed RM 20 per month;
and
ii) Lifeline tariff at 21.8 sen/ kWh for the first 200 units of electricity consumed.
The Energy Commission, with roles to protect consumers’
interests and to ensure commercial viability of the utility industry, undertook a comprehensive assessment of the request for tariff revision by both TNB and SESB. One of the outcomes of the 5-month comprehensive review which ended in March 2010 was a recommended mechanism for a reasonable and fair tariff that benefits all parties. The study also reviewed the existing economic regulatory framework recommendations on mechanisms to enhance efficiency in the system.
As a result of the study, an Incentive-Based Regulatory (IBR) Framework was introduced. A set of eleven (11) Regulatory Implementation Guidelines was recommended each for the electricity and the piped gas supply industries. It is expected to change the way electricity tariff is set and revised in the future. Other initiatives include the separation of accounts for TNB activities according to divisions to enhance transparency and competitiveness of the electricity supply industry in Peninsular Malaysia.
Area 330,803 km²
Climate • Tropical
• Average temperature between 20° C to 32° C
• Average annual rainfall is 3,540 mm
Population 28.3 million
Multi-racial community comprising Malays, Chinese, Indians, Kadazans, Bajaus, Muruts, Kelabits, Dayaks, Ibans and others.
Labor Force 11.52 million
GDP at Current Prices RM 765.97 billion
GDP at Constant 2000 Prices RM 559.55 billion
GDP at Current Prices per Capita RM 27,066
GDP at Constant 2000 Prices per Capita RM 19,772
GNI at Current Prices RM 739.45 billion
GNI at Constant 2000 Prices RM 516.83 billion
GNI at Current Prices per Capita RM 26,129
GNI at Constant 2000 Prices per Capita RM 18,263
Balance of Payment RM 88.08 billion
Foreign Reserves RM 328.67 billion
Gross National Savings 34.1 (percent of GNI)1
Total Electricity Generation 125,045 GWh
Total Electricity Consumption 106,004 GWh
Electricity Consumption per Capita 3,746 kWh Average Electricity Prices:
• Peninsular Malaysia 31.31 sen/kWh
• Sabah 25.54 sen/kWh
• Sarawak 29.382 sen/kWh
Straits of Malacca Langkawi
Penang
Anambas Islands (INDONESIA)
Natuna Islands (INDONESIA)
SOUTH CHINA SEA
SULU SEA
Sipadan Island
PHILIPPINES SOUTH CHINA SEA
INDIAN OCEAN
PASIFIC OCEAN
Nota :
1 as of December 2010
2 not including tariff for negotiated customer
Straits of Malacca Langkawi
Penang
Anambas Islands (INDONESIA)
Natuna Islands (INDONESIA)
SOUTH CHINA SEA
SULU SEA
Sipadan Island
PHILIPPINES SOUTH CHINA SEA
INDIAN OCEAN
PASIFIC OCEAN
08 ELECTRICITY SUPPLY AND DEMAND
09 PERFORMANCE OF ELECTRICITY SUPPLY AND SERVICES IN PENINSULAR MALAYSIA 28 PERFORMANCE OF ELECTRICITY SUPPLY AND SERVICES IN SABAH
36 PERFORMANCE OF ELECTRICITY SUPPLY AND SERVICES IN SARAWAK
38 NUMBER OF COMPLAINTS RECEIVED BY ENERGY COMMISSION AND STATUS OF COMPLAINTS 39 SALES OF ELECTRICITY AND AVERAGE SELLING PRICE
40 TARIFF RATES IN MALAYSIA
PERFORMANCE HIGHLIGHTS
In 2010, the total installed capacity of TNB and IPP in Peninsular Malaysia remains at 7,040 MW and 14,777 MW respectively. However, the maximum demand of the grid system in Peninsular Malaysia has increased from 14,245 MW in 2009 to 15,072 MW, recorded on 24 May 2010. Due to increasing electricity demand, reserve margin has dropped from 53 percent in 2009 to 45 percent in 2010.
The maximum demand of the grid system in Sabah has increased by 8.5 percent from 718.8 MW in 2009 to 779.7 MW that was recorded on 23rd September 2010. The actual demand has exceeded the demand forecast in 2010 at 775 MW.
In Sarawak, the maximum demand of SESCO grid system has increased by 9.5 percent from 996 MW in 2009 to 1,091 MW, recorded in November 2010. Meanwhile, the total installed capacity has increased from 1,230 MW in 2009 to 1,347 MW in 2010. An additional capacity of 117 MW is due to the commissioning of new combined-cycle gas turbine in Sarawak Power Generation plant in April 2010.
Maximum demand in KHTP has increased from 76 MW in 2006 to 149 MW in 2010. The higher maximum demand in 2010 compared with the 2009 level was attributed by the entry of several large industrial users.
Chart 1 : Installed Capacity and Maximum Demand in Peninsular Malaysia from 2006 to 2010
Chart 3 : Installed Capacity and Maximum Demand In Sarawak From 2006 To 2010
Chart 4 : Maximum Demand in Kulim Hi-Tech Park (KHTP) reported by NUR Distribution Sdn. Bhd. from 2006 to 2010
Chart 2 : Installed Capacity and Maximum Demand in Sabah from 2006 to 2010
2008 2009 2010
2006 2007
TNB Installed Capacity Maximum Demand
IPP Installed Capacity Year
0 5,000 10,000 15,000 20,000 25,000 (MW)
14,777
15,072
7,040 14,777
14,245
7,040 13,377
13,377 11,977
12,990 13,620 14,007
6,346 6,346
6,346
0 200 400 600 800 1,000 1,200 1,400 (MW)
2008 1,102 967 967
834 860 773
1,230
2009 996
1,347
2010
2006 2007
1,091
Installed Capacity Maximum Demand
(MW)
2006 2007 2008 2009 2010
160
60 80 100 120 140
76 85
112
132
149
0 200 400 600 800 1,000 1,200 (MW)
2008 812.0 708.0
708.0
673.0 624.9
594.0
978.2
2009
2006 2007
718.8
1,111.1
2010 779.7
Installed Capacity Maximum Demand
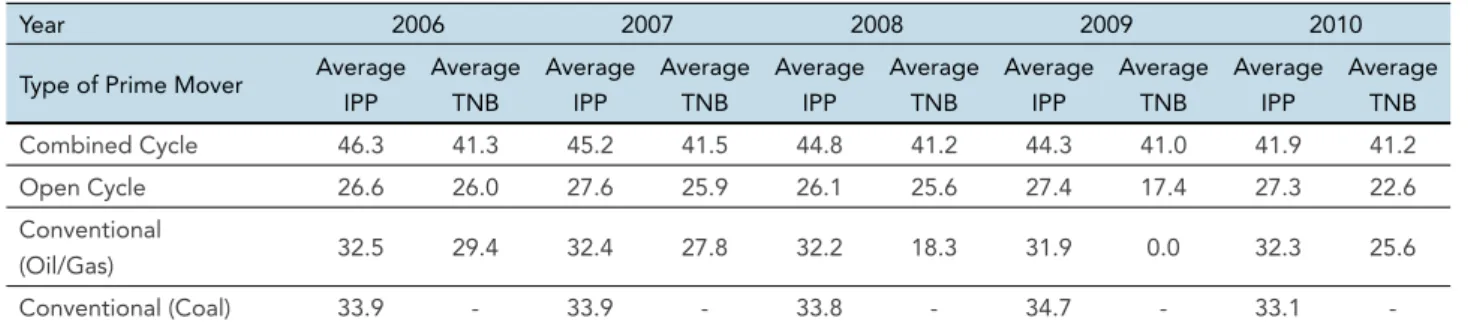
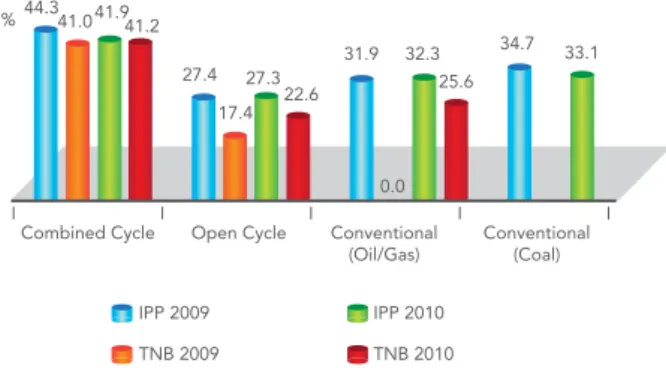
In 2010, the yearly average thermal efficiency for TNB’s combined cycle plants and open cycle plants recorded an increase of 0.2 percent and 5.2 percent respectively. The increase of average thermal efficiency was resulted from more holistic thermal measurements in 2010. Meanwhile, the average thermal efficiency of IPP’s combined cycle plants dropped from 44.3 percent in 2009 to 41.9 percent in 2010. However, the efficiency of IPP’s open cycle plants remain almost the same as in 2009.
For TNB’s conventional thermal power plants using oil/gas, the yearly average thermal efficiency in 2010 was at 25.6 percent. Starting from 2005, all conventional generation plants using coal in the country were operated by IPPs. The average thermal efficiency for IPP’s thermal power plants using coal has decreased from 34.7 percent in 2009 to 33.1 percent in 2010.
1.0 PERFORMANCE OF TNB & IPP GENERATION SYSTEM
Chart 5 : Average Thermal Efficiency of TNB and IPP Generation Plant from 2009 to 2010
Table 1 : Average Thermal Efficiency of TNB and IPP Generation Plant from 2006 to 2010
Table 2 : Average Equivalent Availibility Factor (EAF) of TNB and IPP Generation Plants from 2006 to 2010
Year 2006 2007 2008 2009 2010
Type of Prime Mover Average IPP
Average TNB
Average IPP
Average TNB
Average IPP
Average TNB
Average IPP
Average TNB
Average IPP
Average TNB
Combined Cycle 46.3 41.3 45.2 41.5 44.8 41.2 44.3 41.0 41.9 41.2
Open Cycle 26.6 26.0 27.6 25.9 26.1 25.6 27.4 17.4 27.3 22.6
Conventional
(Oil/Gas) 32.5 29.4 32.4 27.8 32.2 18.3 31.9 0.0 32.3 25.6
Conventional (Coal) 33.9 - 33.9 - 33.8 - 34.7 - 33.1 -
Year 2006 2007 2008 2009 2010
Type of Prime Mover
Average IPP
Average TNB
Average IPP
Average TNB
Average IPP
Average TNB
Average IPP
Average TNB
Average IPP
Average TNB
Combined Cycle 93.1 87.1 87.0 89.4 90.7 90.7 91.2 93.2 90.6 90.5
Open Cycle 97.0 95.0 99.2 95.9 98.1 97.0 98.4 97.3 97.9 92.6
Conventional (Coal) 92.1 - 88.8 - 78.5 - 78.0 - 84.3 -
Conventional
(Oil/Gas) - 86.5 - 99.2 78.1 99.9 83.2 99.3 88.2 98.1
Hydro - 93.3 - 82.2 - 91.3 - 95.3 - 86.0
IPP 2010
TNB 2009 TNB 2010
IPP 2009
Combined Cycle Open Cycle Conventional
(Oil/Gas) Conventional (Coal)
%44.341.041.941.2
27.4 17.4
27.322.6
31.9 32.3
0.0 25.6
34.7 33.1
In 2010, the average equivalent availability factor (EAF) for thermal power plants based on coal for IPP has showed an improvement when compared to the EAF in the previous year. The overall performance of both combined-cycle and open-cycle gas turbine were at the satisfactory level with the achievement of more than 90 percent EAF for IPP and TNB.
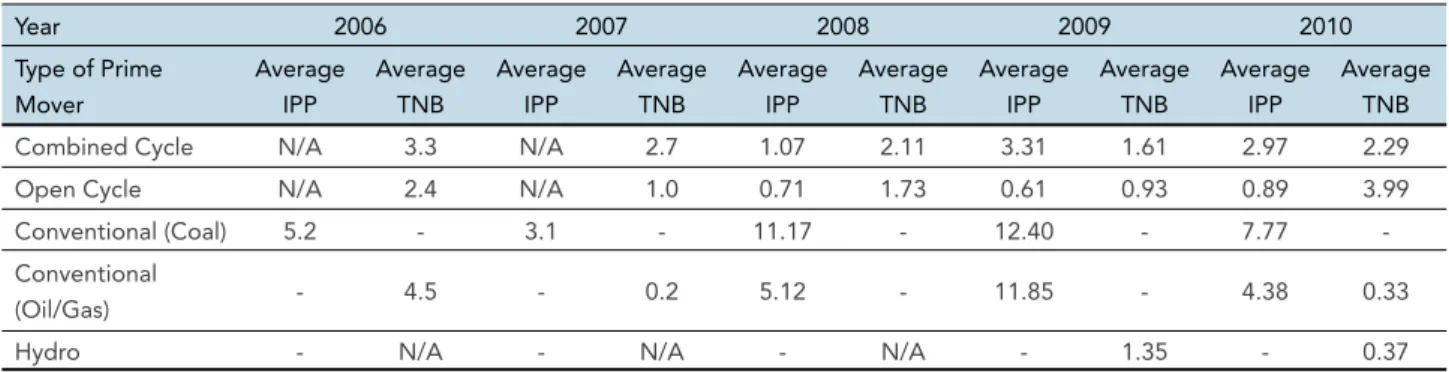
Table 3 : Average Equivalent Unplanned Outage Factor (EUOF) of TNB and IPP Generation Plant from 2006 to 2010
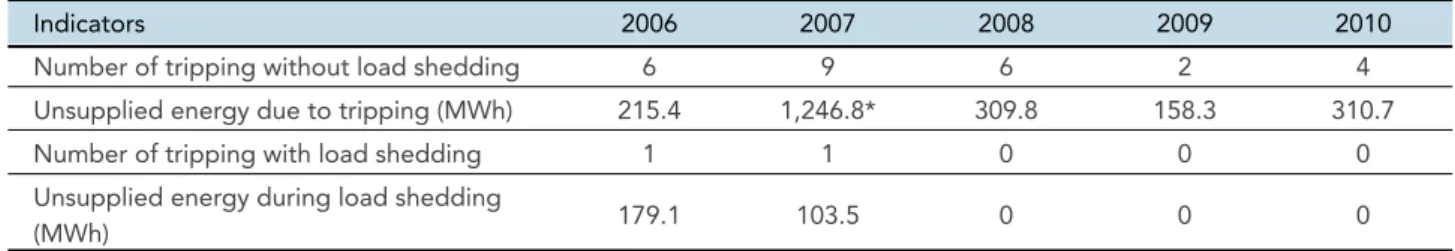
Table 4 : Transmission System Tripping with Load Loss above 50 MW from 2006 to 2010
Chart 6 : Number of Transmission System Tripping with Load Loss above 50 MW from 2006 to 2010
Indicators 2006 2007 2008 2009 2010
Number of tripping without load shedding 6 9 6 2 4
Unsupplied energy due to tripping (MWh) 215.4 1,246.8* 309.8 158.3 310.7
Number of tripping with load shedding 1 1 0 0 0
Unsupplied energy during load shedding
(MWh) 179.1 103.5 0 0 0
0 2
2006 2007 2008 2009
Number of Tripping
without Load Shedding Number of Tripping with Load Shedding
Year
2010 4
6 6 7
10
1 1
0 0
0 9
4 4 8
10 12 No. of Incident
Total Incident
6 6
2 2
Year 2006 2007 2008 2009 2010
Type of Prime Mover
Average IPP
Average TNB
Average IPP
Average TNB
Average IPP
Average TNB
Average IPP
Average TNB
Average IPP
Average TNB
Combined Cycle N/A 3.3 N/A 2.7 1.07 2.11 3.31 1.61 2.97 2.29
Open Cycle N/A 2.4 N/A 1.0 0.71 1.73 0.61 0.93 0.89 3.99
Conventional (Coal) 5.2 - 3.1 - 11.17 - 12.40 - 7.77 -
Conventional
(Oil/Gas) - 4.5 - 0.2 5.12 - 11.85 - 4.38 0.33
Hydro - N/A - N/A - N/A - 1.35 - 0.37
Note :
* Including Tripping Incident in Pulau Pinang on 20 November 2007
In 2010, TNB’s transmission system has lower performance compared to the previous year. This is due to the increment in the number of tripping to 4 in 2010 compared to only 2 in 2009. Meanwhile, the amount of unsupplied energy has also increased to 310 MWh, an increase of 96.2 percent from the previous year.
In general, the target of EUOF for both combined-cycle and open-cycle power generating plants are at 4 percent while the target of for oil/gas power generating plant is at 6 percent. It reflects the better performance of open-cycle and combined-cycle power plants compared to the conventional power plants based on oil/gas and coal.
2.0 PERFORMANCE OF TNB TRANSMISSION SYSTEM
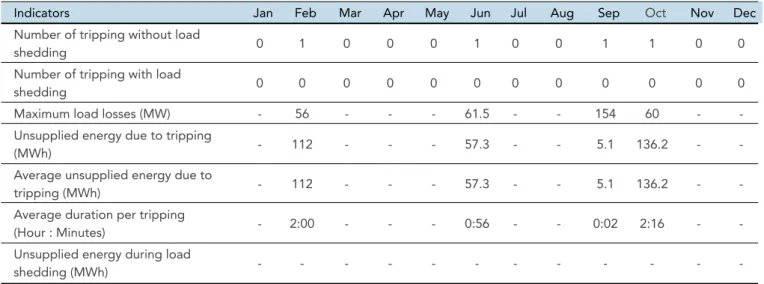
Indicators Jan Feb Mar Apr May Jun Jul Aug Sep Oct Nov Dec Number of tripping without load
shedding 0 1 0 0 0 1 0 0 1 1 0 0
Number of tripping with load
shedding 0 0 0 0 0 0 0 0 0 0 0 0
Maximum load losses (MW) - 56 - - - 61.5 - - 154 60 - -
Unsupplied energy due to tripping
(MWh) - 112 - - - 57.3 - - 5.1 136.2 - -
Average unsupplied energy due to
tripping (MWh) - 112 - - - 57.3 - - 5.1 136.2 - -
Average duration per tripping
(Hour : Minutes) - 2:00 - - - 0:56 - - 0:02 2:16 - -
Unsupplied energy during load
shedding (MWh) - - - -
Table 5 : Monthly TNB Transmission System Tripping with Load Loss above 50 MW in 2010
Chart 7 : Delivery Point Unreliability Index (DePUI) - System Minutes TNB from 2006 to 2010
Financial year 2009/10 0.0
2.0
2006 2007 2008 2009
Year
2010 4.0
6.0
7.3
9.3
6.6
1.02 0.85
8.0 10.0 Minutes
System minutes can be one of the indicators used to measure the performance of TNB transmission system with low system minutes indicating a better performance of TNB transmission system. The chart above showed that starting from 2007, TNB transmission system had been improving with lower system minutes being reported each year. In 2010, system minutes was reported at only 0.85 compared to 1.02 in the previous year.
Table 7 : Profile of Lines/Cables Tripping Incident per 100 cct-km in 2010
Voltage 2006 2007 2008 2009 2010
500 kV 0.2 0.16 0.72 0.00 0.00
275 kV 1.32 0.89 1.11 0.53 0.70
132 kV 1.66 1.14 1.45 0.96 0.84
Voltage level Total Circuit-km No. of Tripping Tripping Rates/100 circuit-km
66 kV 0.9 0 0
132 kV 11,415.39 114 1
275 kV 9,657.21 47 0.49
500 kV 667.7 0 0
Total 21,741.2 161 0.74
Table 6 : Lines/Cables Tripping Incident per 100 cct-km from 2006 to 2010
Financial year 2009/10
3.0 PERFORMANCE OF TNB DISTRIBUTION SYSTEM
TNB ELECTRICITY SUPPLY INTERRUPTIONS
In September 2007, TNB has started using new software namely Total Outage Management System (TOMS) to monitor and report the performance of electricity supply system. Based on the report obtained, the number of electricity supply interruptions per 1,000 consumers in 2010 has reduced by 15.7 percent compared to 2009. Out of the total, the number of unscheduled interruptions remains dominating the total number of interruptions. In general, reduction in the number of interruptions per 1,000 consumers indicates a better performance of TNB distribution system.
Monthly average is taken from the total number of interruption of a year divided by 12 months. From the chart, the average number of the interruptions has decreased by 12.4 percent from 9,616 number of average interruptions in 2009 to settle at 8,427 number of average interruptions in 2010.
0 2 4 6 8 10 12 14 16 18
Number of Interruptions/1,000 Consumers
2006 2007 2008 2009
Year
2010 0.17
0.35
0.76 0.86
0.71
8.50 10.95 15.98 15.01 12.68
Unscheduled Interruption Scheduled Interruption
0 2,000 4,000 6,000 8,000 10,000 12,000
Number of Interruptions
2006 2007 2008 2009 2010
4,718
6,367
9,783 9,616 8,427
Year Chart 8 : Number of Electricity Supply Interruptions per 1,000 Consumers from 2006 to 2010
Chart 9 : Monthly Average Electricity Supply Interruptions from 2006 to 2010
Note :
Chart 9 contains an updated 2009 figure
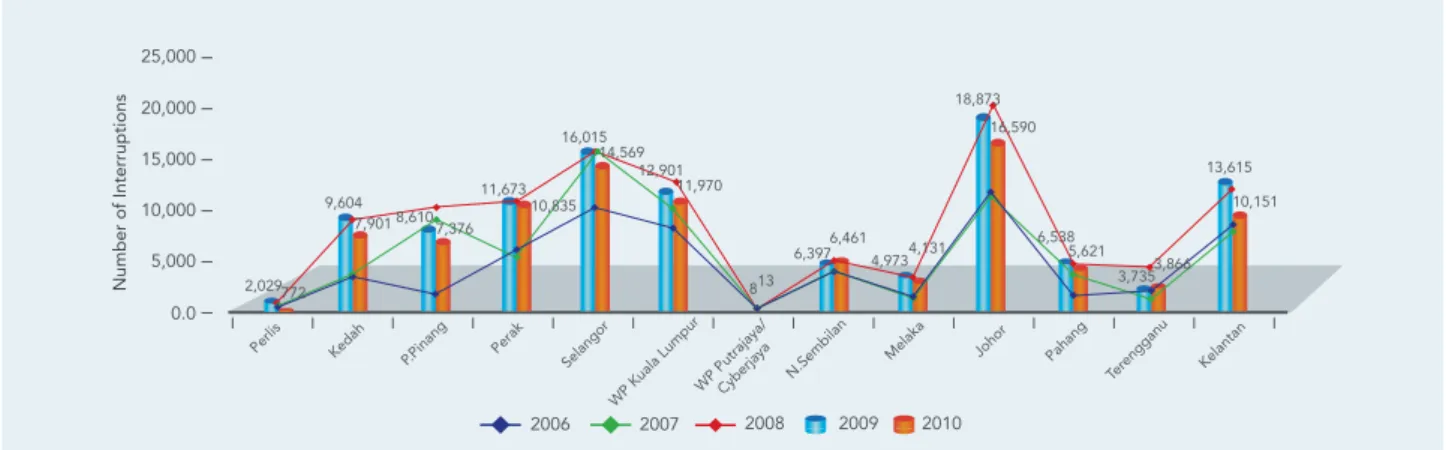
In total, the overall electricity supply interruption in Peninsular Malaysia in 2010 has decreased about 12 percent from the previous year. State of Johor recorded the highest number of electricity supply interruptions while WP Putrajaya/Cyberjaya recorded otherwise for both year 2009 and 2010.
In 2010, the state of Kelantan has recorded the highest number of electricity supply interruptions per 1,000 consumers with electricity supply interruptions of 26.10 per 1000 consumers compared to other states in Peninsular Malaysia. However, this figure was lower compared to the previous year with the electricity supply interruptions of 36.26 per 1,000 consumers.
0.0 5,000 10,000 15,000 20,000 25,000
Number of Interruptions
2010 2009 Kedah P.Pinang
Perlis Pera
k Selango
r
WP Kuala LumpurWP Putrajaya/Cyberjaya N.Sembilan
Melaka Joho
r Pahang
Terengganu Kelantan 2,029772
7,901 9,604
7,376
8,610 11,67310,835 14,569 16,015
11,970 12,901
6,461
6,397 4,131
4,973
16,590 18,873
5,621 6,538
3,866 3,735
10,151 13,615
813
2006 2007 2008
Number of Interruption/1, 000 Consumers
2010 2009 Keda
h P.Pinang
Perlis Pera
k Selango
r
WP Kuala Lumpur WP Putrajaya/Cyberjaya N.Sembilan
Melaka Joho
r Pahang
Terengganu Kelantan 29.37
10.77
2008
2006 2007
0 5 10 15 20 25 30 35 40
17.12 13.39 13.03
15.69
13.79 9.37 15.52
10.72 12.6111.72
16.80 16.82
18.06 14.55
18.39 15.25 16.48
13.48 13.3413.15 36.26
26.10
0.18 0.31
Chart 10 : Number of Electricity Supply Interruptions by State from 2006 to 2010
Chart 11 : Number of Electricity Supply Interruptions per 1,000 Consumers by State from 2006 to 2010
Table 8 : Percentage of Supply Interruptions by Voltage Level in 2010
Voltage level Number of Interruptions Percentage Share
High Voltage – HV (66 kV and above) 24 0.02
Medium Voltage – MV (6.6 kV to 33 kV) 12,170 12.03
Low Voltage – LV (1 kV and below) 88,932 87.95
Total 101,126 100.00
Low voltage interruptions have dominated the total of supply interruptions by 87.95 percent. However, in the case of the low voltage interruptions, it only involves a small number of consumers.
Table 10 : SAIDI, SAIFI, CAIDI in Peninsular Malaysia by Voltage Level in 2010 Table 9 : Number of Unscheduled Interruptions from 2006 to 2010
Voltage Level SAIDI SAIFI CAIDI
Low Voltage ( 1 kV and below) 6.98 0.05 136.9
Medium Voltage (6.6 kV - 33 kV) 88.10 1.17 75.5
High Voltage (66 kV and above) 1.17 0.01 114.6
Total 96.25 1.23 78.3
Year 2006 2007 2008 2009 2010
Number of Unscheduled Interruptions 55,523 74,058 112,064 108,708 94,940
CAUSES OF TNB ELECTRICITY SUPPLY INTERRUPTIONS
SYSTEM AVERAGE INTERRUPTION DURATION INDEX (SAIDI), SYSTEM AVERAGE INTERRUPTION FREQUENCY INDEX (SAIFI) AND CUSTOMER AVERAGE INTERRUPTION DURATION INDEX (CAIDI)
Process and Quality of Work#
Unknown
Falling of Tree
Vandalisme 57.6%
14.7%
10.6%
10.9%
2.0% 2.2%
<0.2%
Natural Disaster*
Equipment
Failures Damages caused
by Third Parties Others##1.8%
Chart 12 : Causes of Unscheduled Electricity Supply Interruptions in 2010
Nota :
* Natural disaster caused by wind, storm, flood, landslide and others.
# Loose contact, poor quality of work, overloading and improper maintainance.
## Other causes such as damaged installation, ageing of insulation, design defects, relay malfunction, transient overload, short circuit, encroachment/vandalisme and maloperation of protection system.
Total Number of Unscheduled Interruptions = 94,940
By using Enhanced TOMS, SAIDI recorded in 2010 was at 96.25 minutes/consumer/year. However, by using TOMS, SAIDI recorded was at 62.88 minutes/consumer/year.
SAIDI and SAIFI were contributed mainly by the medium voltage interruptions with 88.10 minutes/ consumer/
year and 1.17 interruptions/ consumer/ year respectively.
On the other hand, CAIDI was contributed mainly by the low voltage interruptions with 136.9 minutes/ interrupted consumer/year.
74.35
Minutes/Consumer/Year
41.94 9.08
81.29
60.47 74.35
55.57 109.62
119.95 127.66 194.71
85.01 79.73 64.64
194.71 127.66 119.95 109.62 85.01 79.73 64.64 41.94 9.08 81.38 60.47 55.57
SAIDI
Perak Kedah Johor P.Pinang Kelantan Selangor Perlis WP
Kuala Lumpur Putrajaya/WP
Cyberjaya N.Sembilan Melaka Pahang Terengganu
0.00 0.50 1.00 1.50 2.00 2.50
Number of Interruptions/Consumer/Year
Perli s
Kedah P.Pinan
g Pera
k
Selangor WP KualaLumpur
WP Putrajaya/Cyberjaya N.Sembilan Melaka Joho
r
Pahang Terengganu Kelanta
n
0.86
1.22 0.71
0.040 0.48 0.95
1.75 1.57 1.46
1.76 2.35
0.87 0.90
State
Minutes/Consumer/Year
0 20 40 60 80 100 120
2006 2007 2008 2009
Year
2010 103.5
75.7 87.3 66.1
96.25
TOMS Enhanced TOMS
62.88 Chart 13 : SAIDI (Minutes/Consumer/Year) in Peninsular Malaysia from 2006 to 2010
Chart 14 : SAIDI (Minutes/Consumer/Year) in Peninsular Malaysia by State in 2010
Chart 15 : SAIFI (Number of Interruptions/Consumer/Year) in Peninsular Malaysia by State in 2010
0.00 50.00 100.00 150.00 200.00 250.00
Terengganu 45.72
Pahang 82.16
Melaka 85.14
N.Sembilan 93.59
WP Putrajaya/Cyberjaya 211.99
Perlis
Kedah P.Pinang
Perak Selangor WP Kuala Lumpur
Johor Kelantan
82.93 72.50
76.19 75.09
83.77 75.49
87.30
48.53
CAIDI
4.0 POWER QUALITY
OVERVOLTAGE INCIDENTS
Power quality has showed an improvement since 2007 with lower number of reported overvoltage incidents each year.
In 2010, the number of overvoltage incidents has decreased by 27.7 percent from 183 incidents in 2009 to settle at 134 incidents in 2010. Most of overvoltage incidents occurred due to poor connection of neutral conductor because of loose IPC, missing of neutral busbar at substation due to theft or vandalism and neutral conductor snapped or dislodged due to tree falling on cable line.
Year
Number of Overvoltage Incidents No. of
Incidents
2006 2007 2008 2009 2010
250
0 50 100 150 200
100
219
188 183
134 Chart 19 : Number of Overvoltage Incidents from 2006 to 2010
Chart 18 : CAIDI(Minutes/Interrupted Consumer/Year) in Peninsular Malaysia by State
Note :
Including the number of overvoltage incidents in Peninsular Malaysia and Sabah
Year
Number of Interruption/Consumer/Year
0 0.2 0.4 0.6 0.8 1.0 1.2 1.4
2010 1.17
0.83 0.87
0.76
1.23
2008 2009
2007 2006
Chart 16 : SAIFI (Number of Interruptions/Consumer/Year) in Peninsular Malaysia from 2006 to 2010
0 20 40 60 80 100 120
Minutes/Interrupted Consumer/Year
2010 88.84 91.01
100.70
87.01
78.25
2008 2009
2007 2006
Year
Chart 17 : CAIDI (Minutes/Interrupted Consumer/Year) in Peninsular Malaysia from 2006 to 2010
VOLTAGE DIPS INCIDENTS
Voltage dips incident rose by 15 percent from the previous year to settle at 97 incidents in 2010. Meanwhile, the number of consumers affected in voltage dips incidents has increased by 64 percent with 175 consumers involved in voltage dips incidents in 2010.
0 20
2006 2007 2008 2009
Year
2010 40
60 106
96
84
97 80
100 120 No. of Incidents
113
Year No. of
Consumers
2006 2007 2008 2009 2010
250
0 50 100 150 200
230 218 212
107
175 Chart 21 : Number of Voltage Dips Incidents Reported in Major Industrial
Area in Peninsular Malaysia from 2006 to 2010
Chart 22 : Number of Consumers Involved in Voltage Dips Incidents from 2006 to 2010
Table 11 : Profile of Voltage Dips Incidents by State in 2010
State Number of Voltage Dips Incident Number of Consumer Affected by
Voltage Dips Incident
Pulau Pinang 2 3
Perlis 0 0
Melaka 2 2
Pahang 2 4
Terengganu 0 0
Kedah 2 2
Kelantan 9 9
Perak 14 22
WP Kuala Lumpur 11 18
WP Putrajaya / Cyberjaya 0 0
Johor 6 6
Negeri Sembilan 13 18
Selangor 36 91
Chart 20 : Reported Overvoltage Incidents by State in 2010
Note :
Including the number of reported overvoltage incidents in Peninsular Malaysia and Sabah
Number Of Incidents
State Keda
h Melaka
ST/ Head Quarte
r
P.Pinang Perli
s WP Kual
a Lumpur
Pera k
Joho r
Saba h Pahan
g
Selangor Kelanta
n
Terengganu N.Sembila
n
1 3
22
35
6 12
1 0
10 20 30 40 50 60
0 0 0
0 0 0
54
SARFI (SYSTEM AVERAGE RMS FREQUENCY INDEX) TNB
Table 12 : SARFI (System Average RMS Frequency Index) in 2010
Table 13 : SARFI (System Average RMS Frequency Index) Comparison among Power Utility Companies in Selected Countries in 2010
TNB system SARFI90 SARFI80 SARFI70
11 kV 33 19 11
22 kV 58 43 37
33 kV 31 19 14
Overall System 36 23 16
Power Company SARFI90 SARFI80 SARFI70
Singapore Power Grid 13.2 10.6 7.8
United State DPQ Project 49.7 27.3 17.7
Europe Mixed Systems (UNIPEDE) 103.1 0 44
Europe Cable Systems (UNIPEDE) 34.6 0 11
South Africa NRS-048 Indicate Levels 153 78 47
Tenaga Nasional Berhad 34 21 15
Financial Year 2009/10 Calender Year 2010
No.Service IndicatorPerformance LevelSept 09Oct 09Nov 09Dec 09Jan 10Feb 10Mar 10Apr 10May 10Jun 10Jul 10Aug 10 1.
Availability > 2 days
1a. Minimum duration of notice for planned / scheduled interruption of electricity supply Total notices served1,0061,8121,5811,5391,9361,4541,8041,8501,6681,4321,7551,369 Total notices served more than 2 days before planned/ scheduled interruption9251,6981,4851,4481,7921,3471,6861,7211,5871,3491,6681,323 (%) Compliance91.9593.7193.9394.0992.5692.6493.4693.0395.1494.2095.0496.64 1b. Upon request, time taken to provide initial information to consumer who report on electricity interruption < 1 hour Total requests from consumersN/AN/AN/AN/A3236551,6481,8792,4571,6071,5751,984 Total requests replied less than 1 hourN/AN/AN/AN/A2886301,6241,8632,4461,6011,5711,977 (%) ComplianceN/AN/AN/AN/A89.1696.1898.5499.1599.5599.6399.7599.65 2.
Quality of Supply < 2 days
2a. Time taken to rectify voltage complaint or limit violation Total complaints received677713566774 Total complaints solved less than 2 days564510433451 (%) Compliance83.3385.7157.1471.4376.9280.0050.0050.0057.1471.4325.000.00 2b. Time taken to correct voltage complaint which requires network reinforcement Total complaints received < 180 days
00010010000 Total complaints solved less than 180 days00010010000 (%) Compliance000100.000100.00000 2c. Time taken to complete investigation of over voltage and under voltage complaints from complaint received date< 30 working daysTotal complaints received6914141791811647 Total complaints solved less than 30 working days6714141791811647 (%) Compliance100.077.78100.0100.0100.0100.0100.0100.0100.0100.0100.0100.0
5.0 QUALITY OF SERVICES: TNB
PERFORMANCE REPORT OF TNB BASED ON MINIMUM SERVICE LEVEL FOR FINANCIAL YEAR 2009/10No.Service IndicatorPerformance LevelSept 09Oct 09Nov 09Dec 09Jan 10Feb 10Mar 10Apr 10May 10Jun 10Jul 10 Providing Supply < 14 days
3a. Time taken to process electricity supply application and to reply to applicant Total no. of contribution charge letters issued5,0646,4366,3956,5257,8345,1117,0396,6686,5966,5727,110 Total no. of contribution charge letters issued less than 14 days4,4185,8225,8765,9967,0994,5456,4156,1256,0626,0006,757 (%) Compliance87.2490.4691.8891.8990.6288.9391.1491.8691.9091.3095.04 3b. Time taken to implement electrification scheme requiring new substation after handing over of substation building (up to 33kV) by TNB < 120 days Total no. of projects given supply14020719018615813313390113166100 Total no. of projects given supply less than 120 days1362021861809789105748714696 3.(%) Compliance97.1497.5897.8996.7761.3966.9278.9582.2276.9987.9596.00 3c. Waiting time at site for appointment to connect electricity supply. (Unavoidable occurrence must be followed up by returning call in not less than 1 hour before the appointment time) < 1 hour Total appointment made21,89527,17427,40728,40931,96826,01528,24027,86128,67326,40230,421 Total appointment met in not less than 1 hour of appointment date21,89527,17427,40728,40831,96826,01528,24027,86128,67326,40230,421 (%) Compliance100.0100.0100.0100.0100.0100.0100.0100.0100.0100.0100.0 3d. Time taken to inform the developer of the connection charges to be paid upon receipt of complete application < 60 daysNo. of contribution charge letters issued1601912632238263115121116226144 No. of contribution charge letters issued less than 60 days1451662272054139938996188130 (%) Compliance90.6386.9186.3191.9350.0091.9080.8773.5582.7683.1990.28
No.Service IndicatorPerformance LevelSept 09Oct 09Nov 09Dec 09Jan 10Feb 10Mar 10Apr 10May 10Jun 10Jul 10 Consumer Contact < 7 working days
4a. Time taken to reply to written enquiry or complaint Total written enquiries/complaints received2,8612,9283,0833,3912,9742,3282,4642,9572,9382,3161,962 Total written enquiries/complaints replied less than 7 working days2,8102,8773,0013,3472,9492,2792,4572,9272,9122,2861,931 (%) Compliance98.2298.2697.3498.7099.1697.9099.7298.9999.1298.7098.42 4.4b. Average queuing time at consumer service counter < 20 minutesTotal consumer served269,497268,558211,148219,656298,280251,380337,570313,049318,690343,496342,032 Total consumer served less than 20 minutes254,731257,039198,329286,312281,027232,843307,376296,194295,332319,157322,310 (%) Compliance94.5295.7193.9389.5794.2292.6391.0694.6292.6792.9194.23 4c. Average time taken by consumer service officer at CMC 15454 to pick up ringing telephone < 30 secondsTotal incoming calls received186,773189,535190,129184,271182,580173,061213,392204,121222,820203,750214,488 Total incoming calls answered less than 30 seconds101,347103,729112,619113,562120,796103,912137,111113,194133,980135,582149,879 (%) Compliance54.2654.7359.2361.6366.1660.0464.2555.4560.1366.5469.88 Metering Services < 2 working days
5a. Time taken to attend to meter problem upon official notification/request by the consumer (appointment, site visit, meter testing, etc) No. of appointments, visit, testing completed5782695217532748945442 No. of appointments, visit, testing completed less than 2 working days2020171363263223 (%) Compliance35.0924.3924.6425.0035.295.667.4112.5034.0442.599.52 5.5b. Time taken to respond to metering problem or dispute upon official notification/request by the consumer (replace, relocate, etc) < 3 working daysNo. of meter replacement/relocation completed81260320523 No. of meter replacement/relocation completed less than 3 working days71230320311 (%) Compliance87.50100.050.000100.0100.0060.0050.0033.33100.0
No.Service IndicatorPerformance LevelSept 09Oct 09Nov 09Dec 09Jan 10Feb 10Mar 10Apr 10May 10Jun 10Jul 10 5.
5c. Time interval between successive rendering of bill(s) 1 monthTotal no. of consumer (OPC)7,129,3567,150,3847,171,4847,193,1097,217,9507,238,4427,260,3117,280,7327,302,2057,321,9417,345,706 Total no. of billed consumer7,127,0437,150,1577,171,1407,192,7387,216,9487,237,8657,258,0397,280,2367,301,6257,321,4797,343,898 (%) Compliance99.97100.0100.099.9999.9999.9999.9799.9999.9999.9999.98 Average Compliance (%)85.02 Source : T
ELECTRICITY SUPPLY INTERRUPTIONS
In total, the number of interruptions per 1,000 consumers in 2010 has increased slightly when compared to the previous year. This is contributed mainly by the increase in number of unscheduled interruptions per 1,000 consumers in KHTP from 13 interruptions per 1,000 consumers in 2009 to 18 interruptions per 1,000 consumers in 2010.
CAUSES OF NUR ELECTRICITY SUPPLY INTERRUPTIONS
32.08%
24.53%
18.87%
5.66%
18.87%
Natural Disaster*
Equipment Failures
Overload Inferior Workmanship
Damages by Third Parties
12 0 10 20
2006 2007 2008 2009
Industry Consumers (HV) Low Voltage Consumers (LV) Total Scheduled Interruption Year
2010 30
40 50 60 70 80 No. of Interruptions
70 61
76
15 39
51
41
15 55 65
56
14 15
51
Chart 23 : Number of Electricity Supply Interruptions in KHTP by NUR Distribution Sdn. Bhd. per 1,000 Consumers from 2006 to 2010
Chart 24 : Number of Scheduled Electricity Supply Interruptions in KHTP by NUR Distribution Sdn. Bhd. from 2006 to 2010
Chart 25 : Number of Unscheduled Electricity Supply Interruptions in KHTP by NUR Distribution Sdn. Bhd. from 2006 to 2010
Chart 26 : Causes of Unscheduled Supply Interruptions in KHTP by NUR Distribution in 2010
Note :
* Natural disaster caused by wind, storm, flood, landslides, etc Number of Unscheduled Interruptions = 53
6.0 PERFORMANCE OF NUR DISTRIBUTION SDN. BHD. IN KULIM HI-TECH PARK (KHTP)
8 0 10 20
2006 2007 2008 2009
Interruption-Industry Consumers Total Unscheduled Interruption
Interruption-Low Voltage Consumers Year
2010 30
40 50 60 Number of Interruptions
30
53 53
0 24
36 35
1 25
40 35
4 0
32
5 0 10 15 20 25 30 35
Number of Interruptions/1,000 Consumers
2006 2007 2008 2009
Year
2010
Scheduled Interruption Unscheduled Interruption
16.6 26.5
31.9
16.0 25.6
13.0 30.3
18.0 25.9 19.7
SYSTEM AVERAGE INTERRUPTION DURATION INDEX (SAIDI)
In 2010, the overall SAIDI indicator reported a decline in the performance of electricity supply in KHTP compared to the previous year. SAIDI was recorded at 8.84 minutes/consumer/year, an increase of 213%
from the previous year in 2009. However, the industrial SAIDI for 2010 showed a tremendous performance with zero incidents.
7.0 ELECTRICITY SUPPLY QUALITY OF NUR DISTRIBUTION SDN. BHD.
In 2010, the number of voltage dips incidents with magnitude below 70% caused by 70% of nominal voltage (SARFI70) remain unchanged as in 2009 with only 2 incidents.
0 20 40 60
2006 2007 2008 2009
Total SAIDI Industry SAIDI
2010 80
100 120 140
0 0.5 1.0 1.5 2.0 2.5 3.0 3.5
(Minutes/Consumers/Year)
Total SAIDI Industry SAIDI
0 5 10 15 20 25 30 35
2006 2007 2008 2009
Caused by NUR Distribution System Caused by TNB Transmission System
Year
2010 No. of Voltage
Dips Incidents
4 21
1 26
1 26
2 29
4 16
0 1 2 3 4 5
2006 2007 2008 2009
Caused by NUR Distribution System Caused by TNB Transmission System
Year
2010 No. of
Incidents
1
3 4
2
1 1
1 1 74
2006 2007 2008 2009
Voltage Dips Incidents Consumers involved in Voltage Dip Incidents Year
2010 25
10 20 30 40 50 65 70 80
0 0 5 10 15 20 25 30 35
42
20 No. of Voltage
Dips Incidents
No. of Consumers
27 47
27 27
25 31 Chart 27 : SAIDI (Minutes/Consumer/Year) NUR Distribution Sdn. Bhd.
from 2006 to 2010
Chart 28 : Number of Voltage Dips Incidents Reported In KHTP from 2006 to 2010
Chart 30 : SARFI70 for NUR Distribution Sdn. Bhd. from 2006 to 2010 Chart 29 : Number of Consumers Involved In Voltage Dips Incidents In KHTP from 2006 to 2010
Details 2007 2008 2009 2010 1. Connection of Electricity Supply
A. Change of Consumers
• No. of applications
• Percentage of connection within 1 working day after an appointment for connection
B. New Supply (Low Voltage)
i. Individual Applications Under Normal Conditions
• No. of applications
• Percentage of connection within 1 working day after an appointment for connection
ii. Bulk Supply Application And Housing Schemes
• No. of applications
• Percentage of connection within 1 weeks after an appointment for connection
20 100%
117 100%
0 N/A
21 100%
144 100%
0 N/A
6 100%
120 100%
0 N/A
13 100%
594 100%
0 N/A
2. Supply Restoration After Breakdowns i. Reports
• No. of complaints
• Percentage of consumers being given complaint numbers
ii. Minor Breakdowns
• No. of minor breakdowns
• Percentage of breakdown rectified within 2 hours iii. Major/Extra Ordinary Breakdowns
• No. of major breakdowns
• Percentage of restoration within 24 hours
0 N/A
16 100%
24 100%
0 N/A
20 100%
15 100%
0 N/A
13 86.7%
15 100%
0 N/A
33 93.9%
20 85%
3. Supply Reconnection After Disconnection
• No. of supply disconnections
• No. of consumer bills paid before 1:00 p.m. on disconnection day
• Percentage of supply reconnection on the same day for bills paid before 1:00 p.m.
152 152 100%
92 92 100%
85 85 100%
33 33 100%
4. Planned / Scheduled Supply Interruptions
• No. of scheduled interruptions
• Percentage of consumers given 7 days notice before scheduled interruptions
39 92%
32 88%
40 95%
46 91.3%
5. Meter Reading
• No. of consumers with estimated readings exceeding 2 consecutive months
• Percentage of consumers given notice with estimated readings exceeding 2 consecutive months
47 100%
59 100%
32 100%
73 100%
8.0 QUALITY OF SERVICES: NUR DISTRIBUTION SDN. BHD.
PERFORMANCE REPORT OF NUR DISTRIBUTION SDN. BHD. FROM 2007 TO 2010
Details 2007 2008 2009 2010 6. Enquiries / Written Complaints From Consumers
i. Written enquiries including question regarding accounts/bills
• No. of written complaints received
• Percentage of reply within 5 working days
54 100%
61 100%
115 100%
93 100%
7. Service Counter
• Percentage of consumers that the waiting time not exceeding 20 minutes
N/A N/A N/A N/A
8. Appointment for Meter Accuracy Check
• No. of appointments for meter accuracy check
• Percentage of meter accuracy check being carried out within 1 working day
14 100%
14 100%
5 100%
8 100%
9. Meter Replacement
• No. of meter replacement
• Percentage of meter replacement within 2 working days
5 100%
9 100%
5 100%
3 100%
10. Appointment With Consumers
i. For appointments Outside NUR Premises
• No. of appointments where NUR officers arrived not later than 15 minutes from the agreed time
ii. Postponement by NUR
• Percentage of subsequent appointment made within 1 working day
193
100%
316
100%
184
100%
648
98.5%
11. Deposits
• No. of consumers found after 6 months that their deposits exceed average consumption of 2 months
• Percentage of consumers who have the excess deposits returned
0 N/A
0 N/A
0 N/A
0 N/A
12. Refund of Consumer Deposits
• No. of consumers who have forwarded all required documents for refund of deposits
• Percentage of consumers who have their deposits refunded within 15 working days
88 88%
81 100%
124 100%
102 100%
13. Collection
• Percentage of proof of payment sent via mail within 5 working days
98% 100% 100% 100%
14. Supply Disconnection i. With 24 hours Notice
• No. of disconnections due to unsafe consumer installations
• No. of disconnections due to suspicion of electricity theft
• No. of disconnections due to electricity meter being tampered
0 0 0
0 0 0
0 0 0
0 0 0
Details 2007 2008 2009 2010 ii. Without Any Notice
• No. of disconnections due to failure to pay bills within 15 days after issuance of bill
• No. of disconnections due to failure to pay additional deposits within 7 days from the date of notice
• No. of disconnections due to unsafe installations
0 162
0
0 94
0
0 86
0
0 45
0 15. Special Consumers Who Face Problems in Paying
Electric Bills
• No of handicapped and senior consumers who face problems in paying electric bills. Special arrangement can be provided by NUR to collect bills from
handicapped and senior consumers
0 0 0 0
16. Voltage Outside Standard
i. No Enhancement Work on Network is Required
• No. of complaints
• Percentage of complaints settled within 2 days from the date of complaints made
ii. Network Enhancement Work is Required
• No. of complaints
• Percentage of complaints settled within 6 months from the date of complaints made
2 100%
0 N/A
1 100%
0 N/A
6 100%
0 N/A
3 100%
0 N/A
17. Reply to New / Increase of Supply Applications i. No New Substation Required
• No. of applications
• Percentage of applications replied within 1 weeks from the date of application made
ii. New Substation Required
• No. of applications
• Percentage of applications replied within 2 weeks from the date of application made
8 100%
0 N/A
10 100%
3 100%
3 100%
2 100%
7 100%
0 N/A
18. Application for Meter Relocation by Consumer
• No. of application for meter relocation
• Percentage of applications settled within 7 working days
1 100%
9 100%
2 100%
7 100%
19. Education on Energy Efficiency
• No. of education programmes on energy efficiency and safety, including activities near the installation and electricity line
4 4 4 4
20. Power Quality Improvement
• No. of activities to improve power quality 67 49 66 49
Source : NUR Distribution Sdn. Bhd.
1.0 PERFORMANCE OF SESB GENERATION SYSTEM
2.0 PERFORMANCE OF SESB TRANSMISSION SYSTEM
0 10 20 30 40 UOR (%)
IPP
Serudong IPP ARL IPP SPC IPP
SBPC
MFO = Medium Fuel Oil SESB
Pangi SESB Melawa
SESB Tawau
SESB Sandakan Patau-SESB
Patau IPP
Stratavest IPP Ranhill
3.6 40.0 18.8 21.3 4.4 0.7 9.2 2.1 19.2 19.9 33.24
UOR
Chart 31 : Unplanned Outage Rate (UOR) in Sabah in 2010
Table 14 : Transmission System Tripping with Load Loss above 50 MW in Financial Year 2009/2010
In 2010, most of the diesel generating power plants operated by IPPs and SESB recorded a high rate of forced outage. This situation was attributed by the unwarranted breakdowns caused by several factors such as aging installations, limited window for maintenance, “overworked” power plants, low quality of fuel, etc. Despite the poor performance of the diesel generating power plants, the new gas power plants showed a better performance with a lower unscheduled forced outage rate.
In 2010, the number of tripping without load shedding for SESB transmission system has decreased by 7 from 8 in 2009.
Meanwhile, the number of tripping with load shedding incidents showed otherwise with 75 incidents in 2010 compared to only 55 incidents in 2009.
Indicators Sept
09 Oct
09 Nov
09 Dec
09 Jan
10 Feb
10
March 10
Apr 10
May 10
Jun 10
Jul 10
Aug 10 Number of tripping without load
shedding 0 0 0 0 0 0 0 0 0 0 0 1
Number of tripping with load
shedding 10 11 14 9 3 4 6 8 7 3 0 0
Unsupplied energy due to tripping
(MWh) - - - - - - - - - - - 31
Average unsupplied energy due to
tripping (MWh) - - - - - - - 31
Average duration per tripping
(Hour : Minutes) - - - - - - - - - 1:38
Unsupplied energy during load
shedding (MWh) 4,192 4,105 5,515 5,159 1,143 1,081 2,579 2,405 3,439 1,577 0 0
SESB ELECTRICITY SUPPLY INTERRUPTIONS
In 2010, the average interruptions for every 1,000 consumers increased by 5.9 percent compared to its 2009 level.
Unscheduled interruptions contributes about 88 percent out of the total average interruptions.
The monthly average of electricity supply interruptions has increased by 11 percent from 1,815 interruptions in 2009 to 2,014 interruptions in 2010.
Table 15 : Delivery Point Unreliability Index (DePUI) - System Minutes SESB from 2007 to 2010
Table 16 : Lines/Cables Tripping Incident per 100 cct-km from 2006 to 2010
Financial Year 2009/10
Note:
Number of Electricity Supply Interruptions per 1,000 Consumers exclude the number of interruptions in SESB transmission and generation system
In 2010, total number of tripping incidents for both cables and lines per 100 cct-km has increased significantly by 276 percent when compared to its 2009 level. Among all, the cables and lines of 66 kV contributed the highest number of tripping incidents.
Note :
* Involving 3 major incidents :
• Tripping incident of both 275 kV Kolopis-Segaliud lines, in the East Coast Sabah with 124 MW of load loss on 30 September 2007;
• HV fault at Karamunting Sub-station with 308 MW of load loss on 6 November 2011; and
• Collapsed of 132 kV transmission tower of Kayu Madang lines inside the area of Universiti Malaysia Sabah (UMS) due to theft of metal part of the tower, causing a 459.3 MW of load loss on 21 April 2008.
Year Including Blackout Excluding Blackout
2007 (28 Jul - 31 Aug 2007) - 18.99
2008 154.38* 11.89
2009 - 31.58
2010 - 20.21
Voltage Level
2006 2007 2008 2009 2010
East Coast West Coast Sabah Grid Sabah Grid Sabah Grid Sabah Grid
275kV - - - - 0.20 0.20
132kV 0.46 0.7 5.35 0.28 0.44 0.12
66kV - 20.99 4.51 5.51 4.34 16.34
No. of Interruptions /1,000 Consumers 2006 2007 2008 2009
Year
2010
9.34 6.27 8.45 6.85
61.24 52.14 48.52 43.38 48.03
Scheduled Interruptions Unscheduled Interruptions 0
10 20 30 40 50 60 70 80
9.06
Chart 32 : Number of Electricity Supply Interruptions per 1,000 Consumers from 2006 to 2010
No. of Interruptions
Year
2006 2007 2008 2009 2010
2,200 2,100
1,600 1,700 1,800 1,900 2,000
2,146
1,966
1,826 1,815
2,014 Chart 33: Monthly Average Electricity Supply Interruptions from 2006 to 2010
Financial Year 2009/10