Can a Powerful CEO Affect the Effectiveness of Corporate Governance? Evidence from
CEO Turnover in Chinese State-Owned Enterprises
*Dai Bin, Peng Cheng
Research Center for International Business and Economy Sichuan International Studies University
Chongqing, 400031 China Email: *[email protected]
Liu Xing
School of Economics and Business Administration Chongqing University
Chongqing, 400030 China Abstract
The main purpose of this paper is to explore the impact of CEO power on the efficiency of corporate governance from the perspective of state-owned enterprises’ CEO turnover in China. Using data of listed SOEs from 2004- 2012, we find that: (1) CEO turnover is negatively correlated with company performance on the whole, yet the enhanced CEO power can reduce the possibility of being forcibly replaced due to the poor performance, showing that the power of CEO play a significant entrenchment role in the decision- making of executive turnover; (2) CEO turnover remarkably improves the company’s future performance. However, this promoting effect only appears after the turnover of CEO possessing less power; (3) Further studies also show that upgrading the administrative level and improving the institutional environment can inhibit the rent-seeking behavior of SOEs’ CEO. Our study is not only conducive to understanding the economic consequences of the power of SOEs’ chief executives, but also offers experiences and inspirations in terms of the policy-making on SOEs’ corporate governance and the mechanism reform of executive selection as well.
Keywords CEO power; corporate governance; state-owned companies; CEO turnover
INTRODUCTION
The separation of ownership and control laid the foundation for the development of modern joint-stock companies, but it also led to the agency conflict between shareholders and management (Jensen and Meckling, 1976).
The fundamental problem necessary to solve by the corporate governance is the use of effective incentive and restraint means to ensure that the management make the decisions and behavior consistent with the interests of shareholders. Among them, one important way is to provide appropriate forms of management incentive contract. In this theoretical framework, corporate governance system can play a role at two levels: First, from the perspective of static incentive contract, whether or not shareholders can establish the optimal compensation contract from their own interests, then reduce the agency cost between shareholders and CEOs through the incentive effects to maximize enterprise value; Second, from the perspective of dynamic incentive contract, executives with poor performance can be replaced timely to promote the operation performance (Bushman and Smith, 2001).
Since the 1980s, the key content of state-owned enterprises’ reform in China is the gradual transition to the market economy system whilst the enterprises establish a scientific and reasonable incentive mechanism.
However, the lack of effective supervision towards CEO power may cause serious “entrenchment effect” to managers, thus restrict the effectiveness of corporate governance mechanism represented by incentive contract. On the one hand, the highly fragmented nature of national shareholders leads to the situation that government officials perform the oversight functions of SOEs’
executives actually. The insufficient supervision initiative, rent-seeking lure from managers and lack of information and other factors likely to lead to the weakening of monitoring capability, making the internal management seize the control rights in essence (Oliver et al., 2014). On the other hand, in many listed companies transformed from SOEs, general manager is appointed by controlling shareholder and also serves as director or chairman of the board in the ordinary course of events, thus formed the situation of self-employment and self-supervision (Lu and Dranove, 2013). Therefore, in the state owned enterprises’ governance structure background mainly characterized by
“management control under administrative intervention”, taking the CEO owning actual control rights as the breakthrough point, it has the important practical significance to study the influence of CEO power toward the incentive contract and other corporate governance problems.
At present, some scholars have studied the relationship between CEO power and the static incentive contract based on the perspective of executive compensation. The conclusions of these studies have generally shown that CEOs can influence or even decide the pay structure and scale to a great extent (Bebchuk et al., 2002; Fahlenbrach, 2009; Essen et al., 2015), thus formed and developed the “managerial power theory” which explaining the static incentive contract. However, the current domestic and foreign research did
not directly touch the CEO power’s effect in the dynamic incentive contract, while the sticking to the position of bad managers is generally regarded as the most serious agency problem. Therefore, based on the perspective of dynamic incentive contract, it is a question of extraordinary importance to study how the CEO power affects the company’s decision of executive turnover. This study will contribute to the understanding of CEO power’s ways of operating mechanism and its implication for the corporate governance. At the same time, the answer to this question has a very clear guiding significance for a comprehensive understanding of China’s executive incentive status and efficient design for incentive contract. The above considerations naturally form the logical starting point and research motivation for this study.
Based on the institutional background of China’s economic transformation and state-owned enterprises’ reform, this paper uses data of listed SOEs from 2004-2012 and finds that: (1) CEO turnover is negatively correlated with company performance on the whole, yet the enhanced CEO power can reduce the possibility of being forcibly replaced due to the poor performance, showing that the power of SOEs’ chief executive play a significant entrenchment role in the decision-making of CEO turnover; (2) CEO turnover remarkably improves the company’s future performance. However, this promoting effect only appears after the turnover of CEOs possessing less power; (3) Further studies also show that upgrading the administrative level and improving the institutional environment can inhibit the rent-seeking behavior of SOEs’ chief executives.
Our study has the following contribution to existing literatures: through investigating the impact of CEO power on the efficiency of corporate governance based on the perspective of CEO turnover, this paper confirms the CEO power’s important role in corporate governance system and provides a useful complement and expand to the “managerial power theory” put forward by Bebchuk et al. and other scholars at the level of dynamic incentive contract.
Moreover, this study is not only conducive to understanding the economic consequences of the CEO power in SOEs, but also offers some experiences and inspirations in terms of the policy-making on SOEs’ corporate governance and the mechanism reform of executive selection as well.
The rest of the paper is as follows: Firstly, research hypotheses are proposed on the basis of institutional background and theoretical analysis. Then, we make an empirical test based on the sample data of state-owned listed companies in China and analyze the results. Finally, we summarize the research conclusion.
THEORETICAL ANALYSIS AND HYPOTHESIS DEVELOPMENT The primary purpose of corporate governance is to solve agency problems arising from the separation of ownership and control rights, so the ability to identify and replace underperforming executives is considered one of the important marks of governance mechanism’s efficiency (Jensen and Warner, 1988). That is to say, if the corporate governance arrangements are efficient,
then CEO will be replaced in time as a result of poor performance. Therefore, based on this perspective, this paper attempts to explore the CEO power’s function in corporate governance system by means of researching the effect of CEO power on executive turnover.
For the relationship between company performance and CEO turnover, scholars in China and abroad have done a lot of research on these issues. Based on the practice of corporate governance in America, Hermalin and Weisbach (1998)construct a multi-period model of how directors select, supervise, retain or fired CEO. Their theoretical analysis shows that the CEO’s change was negatively correlated with company performance. As a whole, the existing empirical studies have generally found that if the company performance is poor, then CEOs are more likely to be replaced (Defond and Hung, 2004;
Fisman et al., 2013; Park and Shaw, 2013). Similarly, for China’s state-owned enterprises, although there have some problems such as proprietor absence and soft budget constraint to some extent, we consider that even the listed SOEs should have a strong motivation to replace the inferior executives when the company faces with the poor performance or sinks into serious loss: first of all, state-owned enterprises with poor performance don’t have relatively abundant resources which can be used to serve the needs of government’s public governance such as economic development and social welfare; next, the economic losses of state-owned enterprises require to be resolved directly or indirectly through the governments at different levels; finally, the corporate governance level of state-owned enterprises is also experiencing a improvement in the course of exploration. Based on the above analysis, we present the first research hypothesis:
Hypothesis 1: Ceteris paribus, CEO turnover is negatively correlated with state- owned enterprise’s operating performance, while it’s positively correlated with enterprise’s loss status.
The relationship between CEO turnover and firm performance may be subject to various conditions and factors. In recent years, academics have begun to focus on whether this relationship varies in different patterns of corporate governance, especially the supervisory role from board of directors. But almost all the current studies failed to bring into consideration the mechanism about the CEO power’s influence on decision-making of executive’s turnover. It is a crucial function of corporate governance systems to identify and replace underperforming CEOs, which, however, might be obstructed by the power exertion of SOEs’ executives. To be more specific, CEO power may influence executive change through following channels. Firstly, the whole process of SOE reform also witnesses an increasingly evolving and upgrading process of CEO power in essence, since the decentralization of state-owned enterprises in early 1980s. In addition, since appropriate supervision and restraint system has not yet been effectively built in a relatively weak corporate governance environment, the reformed SOEs are prone to be at risk due to the fact that
managers interested more in personal gains than anything else (Brødsgaard and Li, 2014). As a result, senior managers, “insiders” in essence, driven by selfish motives, along with gradual accumulation and enhancement of power, might weaken the board’s oversight function through a variety of channels and leave much more room for CEOs’ power rent-seeking after taking practical control of the company, which is also confirmed in Hermalin and Weisbach (1998)’smodel analysis. They hold that the board will continue to decline in efficiency as the power increase of CEO over the board. Moreover, in view of China’s institutional background, a higher-ranked CEO of SOEs is more likely to have closer contact with the government in various interests, owing to a higher administrative level correspondingly. Although under the guideline of
“less government intervention, separate administration from management”, a variety of reform measures has been put forward to improve the economic efficiency of state-owned enterprises, so far the selection and appointment of SOEs’ CEOs are still following the party cadre selection and appointment rule mainly, which forms the so-called “internal labor market”(Li and Zhou, 2005).
On top of that, researches conducted by Chang and Wong (2009)indicate that, in addition to their business performance, non-economic political factors are also important indicators for the recruitment and replacement of SOEs’
executives, which in turn exacerbates CEOs’ entrenchment effect. Last but not least, executives possessing greater power are more likely to make exclusive investment in human capital through gradual accumulation and control of the key resources (suppliers, customers, etc.) of enterprises, through which, they have strengthened their irreplaceability and lead to a corresponding increase in the dismissing cost of the board of directors, according to Arrow (1962)’sview of “learning by doing”. Accordingly, in combination with realistic background and related researches, we assert that corporate governance mechanism based on principal-agent conflict may be distorted by CEO power’s rent-seeking behavior; yet enhanced CEO power could probably reduce their substitutability for their poor business performance.
Hypothesis 2: Ceteris paribus, the sensitivity between the odds of CEO turnover and company performance would be lessened with the enhancement of CEO power.
A good corporate governance system should not only make timely punishment for the poor performance of managers, but also be able to select and employ suitable successors (Denis et al., 1995). “Harvard Business Review”
has written: “The biggest challenge faced by U.S. companies is to find the ideal CEO successor.” Thus, whether CEO’ turnover can improve business performance have received the widespread attention of scholars, but there is no established acknowledgement in earlier related researches. Grusky (1963) believe that CEO turnover would result in further performance decline and a second round executives change, plunging the company into a vicious cycle, due to the instability of organizations and the discontinuity of policies.
Gamson and Scotch (1964)propose a “scapegoat hypothesis” that the change of executives is only a strategy to appease shareholders after the decline in company performance, and the replaced CEOs are nothing but “scapegoats”.
However, the following researches have got relatively positive conclusions in this respect. Denis et al. (1997)find that in those companies mandatory replacement is implemented, business performance will undergo a marked decline right before the CEO change, but will enormously improve 2 to 3 years after the replacement. Researches made by Huson et al. (2004)and Kato and Long (2005)all confirm that CEO replacement will significantly improve the performance of companies. It seems that domestic-related researches have also experienced a similar transition. For example, Beatty et al. (1987) and Bouaine et al. (2014) insist that CEO change fails to promote company performance while recent studies of Ting (2013) and Dimopoulos et al. (2012) provide evidence for upgraded company performance due to CEO turnover.
We believe that these differences may be largely due to the heterogeneity of research samples. It is universally acknowledged that the foundation of the State-owned Assets Supervision and Administration Commission in 2003 is a good start for a modern corporate governance system built in SOEs, which, through restructuring and listing, accelerate market-oriented operation of SOE.
To be specific, accompanied by the gradual progress of performance evaluation system and executives selecting and hiring mechanism, successor should be overall more capable and qualified for a better company performance on the one hand; company performance could also be improved on the other hand, if we view CEO turnover as a governance mechanism, successors would better restrain their self-benefit motive and behavior and work harder. Therefore, according to existing research and governance practices, we infer that the effect of corporate governance resulting from CEO change of SOE has been gradually strengthened and improved. Based on above analyses, the third hypothesis comes into being.
Hypothesis 3: Ceteris paribus, CEO turnover is set to improve company performance in the next stage.
The first question is whether the turnover of CEO possessing heterogeneous power results in difference in terms of governance effect. Executives change would bring great impact on the organizational structure and strategy implementation of the enterprise. Some companies may take the opportunity to seek change and breakthrough; some others may hope to maintain the original policy and operational status. Therefore, company’s future performance rests largely on the behaviors of successor. On the one hand, the current selection and appointment of SOEs’ executives mainly reflect an “internal labor market”. Executives possessing more power, as a rule, still in a relatively high administrative status after service, they tend to elect internal successors who can continue his policy or leadership style, if possible, to maintain the company’s pattern of interests. Fisman et al. (2013) also holds that who to be
selected and hired as successor by the board is susceptible to the interference of after-service executives and other stakeholders. It can be inferred that the organizational evolution could probably be constrained and the performance of enterprises could also be declined because of convergent and unchanging thinking patterns which, yet, exert little impact upon successors of top executives possessing less power. In light of this, the study of Yusuf et al. (2006) can serve as an evidence that over centralization of corporate internal power would exacerbate the succession crisis of top managers, found in SOEs of China. On the other hand, based on a dynamic incentive mechanism, the board of directors is inclined for an independent selection and recruiting mechanism for successors, for a forced demission may weaken predecessors’ influence towards the board of the company. Since CEO turnover is a kind of power restructuring, after executives possessing more power are forced to leave, their successors are more likely to implement a management mode different from their predecessors and seek organizational change in the company, in order to eliminate the “shadow effect” of their predecessors and make themselves official authorities much faster. From this perspective, the successors may have much more dramatic effect on the company performance after predecessors possessing more power are taken over. Based on above analyses, we propose two competing hypothesis:
Hypothesis 4A: Ceteris paribus, compared to CEO possessing more power, company performance promotion is more obvious if CEO possessing less power is replaced.
Hypothesis 4B: Ceteris paribus, compared to CEO possessing less power, company performance promotion is more obvious if CEO possessing more power is replaced.
RESEARCH DESIGN
Sample Selection and Data Sources
This paper takes the listed SOEs of A-share on the Shanghai and Shenzhen Stock Exchanges in China during the period 2004-2012 as initial samples, screened in the following procedures: (1) Exclude financial enterprises; (2) Exclude samples refused or negated by auditors; (3) Exclude samples listed or undergone control right transfer in a given year; (4) Exclude samples with missing data. Since company performance data two years before and the following year are necessary for the research, thus the actual samples used are from 2002-2013 and 8108 sample observations are gained finally after the above screening process.
Coupled with manual collection, the personal information of top executives and financial data used in this study mainly come from the CSMAR and CCER databases, which have undergone a sample checking and correction with the
annual report of listed companies. All the data were processed via the software Stata10.0. Furthermore, to mitigate the influence of potential outliers, this paper winsorized the main continuous varia
Variable Definition CEO turnover
There is no consensus on the defining scope of CEO in related domestic researches currently, primarily focusing on the posts of chairman and general manager on the whole. Based on the research objectives, this paper defines the subjects as general managers, CEOs or presidents—the so-called “core executives” of companies, who virtually have a final say to the company’s operation. Meanwhile, CEO turnover is usually divided into mandatory (unconventional, forced) and normal (regular, voluntary) turnover by scholars both at home and abroad, according to the reason why they leave office. Accordingly, if “core executives” still retain in the chairman post of the company after leaving office, or if it is clearly described in the report that the demission is caused by health, retirement, corporate governance structure upgrade, involvement in a lawsuit or death reason, it is generally recognized as a normal CEO turnover, otherwise it is a mandatory one. Mandatory turnover due to poor performance believed to be the key to judge corporate governance efficiency, so if mandatory “core executives” turnover took place in the sample firms that year, the variable turnover is 1, otherwise it’s 0. Moreover, if CEO turnover occurs multiple times in a fiscal year, the first one would be chosen as a turnover sample.
CEO power
CEO power is classified into power of structure, power of ownership, power of expertise as well as power of prestige, according to Finkelstein (1992). This paper, combining Finkelstein (1992)’s idea and existing researches on the basis of “core executives” defined previously, is going to portray CEO power in the following eight aspects:
1. CEO structural power: the power of structure of senior management reflects a positional power in the spatial dimension and core executives doubling as directors or chairmen of the board is bound to strengthen its de facto control over the business. The index of power of structure is considered 0 if the top management do not double as members of the board, 1 if they double as directors or vice-chairmen and 2 if as chairmen.
2. CEO ownership: shareholding CEO is both managers and shareholders, which would exert a greater influence upon the board of directors with dual identities. The index is 1 if senior management holds share of the company and 0 otherwise.
3. Board size: the larger scale the board has, the more the CEO power tends to be, according to Morse et al. (2011) and Albuquerque and Miao (2013). The index is 1 if the board size is above the median of the industry and 0 otherwise.
4. Workplace consistency between independent directors and listed companies: independent directors can better their oversight roles for they can have a better understanding of the overall situation of the company if the place is consistent, otherwise it may be difficult to form constraints and checks and balances on CEO power. The index would be 1 if independent directors work in a place where listed companies aren’t resided, otherwise it would be 0.
5. Possession of advanced degree and title: according to Finkelstein (1992)’sstudy, CEO with higher degrees and professional titles is more likely to possess a stronger power of prestige and expertise and construct leadership authority to strengthen his corporate control.
When CEO meets at least one of the two requirements1, this index would be 1 and 0 otherwise.
6. CEO tenure: it is believed that the longer senior management is in office, the greater the personal prestige is accumulated, as well as a stronger foothold, hence a stronger control over the enterprise. Morck et al. (1988)also agree that with the extension of the term of office, senior executives may probably build interest groups within the company, so as to lower the probability of being replaced. So the index is 1 if the tenure is above the median of the industry and 0 otherwise.
7. Part-time job in other companies: Belliveau et al. (1996) find that senior executives with more social capital tend to have greater corporate decision-making power. It is generally accepted that CEOs may own more social capital if they have a part-time job outside their own company. The index is 1 if senior executives are on the side and 0 otherwise.
8. Political connection: if CEOs have served in the government department, it would be much easier for them to build a variety of political and economic ties of interest with government officials, and the replacement cost may be higher when the government is faced with the decision of such CEO turnover. Fan and Wong (2007)argue that the political ties of executives will reduce the internal corporate governance efficiency and weaken the monitoring and constraining role of the board in the managerial level. The index is 1 if there is political connection and 0 otherwise.
The above indexes reflect the magnitude of CEO power in different aspects. However, each one has some limitations to some degree and is far from being comprehensive and integrated. So in light of practices made by
1 In this paper, advanced titles include senior engineer, senior accountant, senior economist, CPA, CPV, professor, etc.; advanced degrees include the master graduates or above.
Ammann et al. (2011) and other scholars, two composite indexes of CEO power come into being out of the eight measurement indexes above, by adoption of the following two methods: 1. Power_ave is obtained by averaging the sum of the eight measurement indexes; 2. Power_pca is obtained by constructing the composite score of principal component analysis. Thus, the greater the Power value is, the more the CEO power is going to be correspondingly.
Company performance
Given the low effectiveness and high volatility of share prices, along with other features of China’s stock market, market performance indicators such as Tobin’s Q, stock returns, etc., indicating long-term performance of enterprises to some extent, would result in enormous discrepancy between market performance indicators and the actual situation (Conyon and He, 2014), however. Therefore, we choose accounting index as a measure of operating results. Specifically, performance variable Perf is defined in three ways in the empirical process: Roa and Oroa are Return on Assets and Operating Return on Assets respectively and Loss for the loss status of companies. The value is 1 when loss occurs and 0 otherwise. On top of that, Roa and Oroa are adjusted by the industry median for the comparability of corporate performance between different industries.
Control variables
With reference to relevant studies, the main control variables in this paper encompass: 1. Asset size (Lnsize): CEO turnover is expected to be negatively correlated to the scale of companies, with higher structure stability and lower sensitivity to fluctuations of company operation as a rule, when company scale grows. 2. Growth: Revenue growth is chosen to represent companies’ growth in this paper. A better growth means on the one hand that there is to be a good prospect in terms of the development of the company, and it’s also an indicator of how hard the CEO has worked and how efficient their work turned out to be on the other hand. Thus it is expected that there is a negative correlation between CEO turnover and the growth of enterprises. 3. Asset-liability ratio (Lev): The presence of liabilities puts CEOs into the threat of losing control of the enterprise due to bankruptcy, thereby restraining CEOs’ self-interest behavior and reducing agency cost as a result. Combined with the existing literature and researches, we expect CEO turnover is positively correlated to debt ratio of enterprises. 4. Age of senior management (Age): Executive turnover is found in existing researches to be, more or less, correlated to their age. The age of 60 is chosen to be a critical control point according to the actual situation of SOEs.
1 is recorded when the age of CEOs is ≥ 60 and 0 otherwise.
Research Model
In order to test hypothesis 1 as well as to base this study, Logistic regression model is conducted first for analysis of the correlation between corporate
performance and CEO turnover occurred in SOEs. The performance indicator (Perf) used in this sample is one-year lagging, considering the governance practices of listed companies.
Logit(Turnover)t=α+β1Perft-1+β2Lnsizet+β3Growtht+β4Levt+β5Aget+∑Year+
∑Ind+ε
(1) Model (2) is used to test hypothesis 2. If enhanced CEO power could reduce the possibility of CEO replacement because of poor company performance, we expect the regression coefficient of cross term β3 to be significantly positive in this model.
Logit(Turnover)t = α+β1Powert+β2×Perft-1+β3Powert×Perft-1+β4Lnsizet+β5Growtht+ β6Levt+β7Aget+∑Year+∑Ind+ε
(2)
Model (3) is used to test hypothesis 3 naturally, of which, ΔPerft+1 indicates the change of company performance in the following year compared to a given year and, Roa (Return on Assets) and Oroa (Operating Return on Assets) are taken as measure of performance for context consistency. The regression coefficient β1 can offer us a window of how company performance in the following year is to be changed under the impact of executive turnover in the t year. In order to investigate the difference existed in the change of corporate performance when CEO possessing heterogeneous power is replaced, the entire sample is divided into two groups of high-power and low-power, according to whether the Power index is greater than the industry median, and test of significance is conducted by Chow-test on group difference of the regression coefficient β1.
The regression coefficient β1 in low-power group is expected to be positive and remarkably greater than that in high-power group if hypothesis 4A is true, otherwise it means hypothesis 4B is true.
ΔPerft+1=α+β1Turnovert+β2Lnsizet+1+β3Growtht+1+β4Levt+1+β5Aget+1+∑Year+
∑Ind+ε
(3) The specific definition and calculation of the variables in the paper can be seen below.
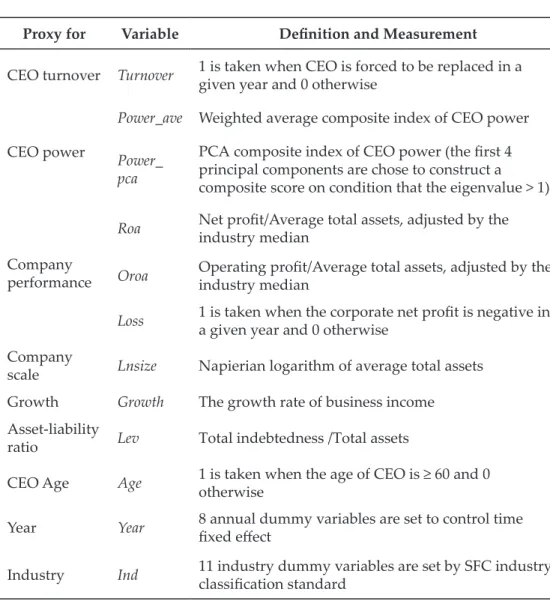
Table 1 List of variables’ definition and measurement
Proxy for Variable Definition and Measurement CEO turnover Turnover 1 is taken when CEO is forced to be replaced in a
given year and 0 otherwise
CEO power
Power_ave Weighted average composite index of CEO power Power_
pca
PCA composite index of CEO power (the first 4 principal components are chose to construct a composite score on condition that the eigenvalue > 1)
Company performance
Roa Net profit/Average total assets, adjusted by the industry median
Oroa Operating profit/Average total assets, adjusted by the industry median
Loss 1 is taken when the corporate net profit is negative in a given year and 0 otherwise
Company
scale Lnsize Napierian logarithm of average total assets Growth Growth The growth rate of business income
Asset-liability
ratio Lev Total indebtedness /Total assets
CEO Age Age 1 is taken when the age of CEO is ≥ 60 and 0 otherwise
Year Year 8 annual dummy variables are set to control time fixed effect
Industry Ind 11 industry dummy variables are set by SFC industry classification standard
EMPIRICAL RESULTS Descriptive Statistics
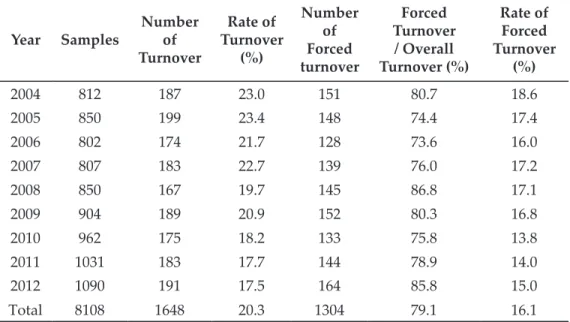
A basic situation of CEO turnover in listed SOEs during 2004-2012 is described in Table 2. As is seen from the table, the overall turnover rate of these companies’
core executives is 20.3%, including 16.1% of mandatory change. Besides, the annual CEO turnover rate remains relatively stable chronologically and shows no sign of significant fluctuations. Previous studies have found a relatively high CEO turnover rate in Chinese listed companies from 1999-2003, while in contrast, the CEO turnover rate in SOE listed companies displays a slow decline
trend since 2004, but still higher than the primary global capital markets2. In addition, the time when CEO turnover occurs is accumulated in this paper and it turns out that some 60 percent occur in the first half year, which accords with usual decision logic that board of directors evaluate and decide whether or not to dismiss senior management according to companies’ operating results in the previous year.
Table 2 Statistics of CEO turnover in SOEs from 2004-2012
Year Samples Number Turnoverof
Rate of Turnover
(%)
Number Forced of turnover
Forced Turnover
/ Overall Turnover (%)
Rate of Forced Turnover
(%)
2004 812 187 23.0 151 80.7 18.6
2005 850 199 23.4 148 74.4 17.4
2006 802 174 21.7 128 73.6 16.0
2007 807 183 22.7 139 76.0 17.2
2008 850 167 19.7 145 86.8 17.1
2009 904 189 20.9 152 80.3 16.8
2010 962 175 18.2 133 75.8 13.8
2011 1031 183 17.7 144 78.9 14.0
2012 1090 191 17.5 164 85.8 15.0
Total 8108 1648 20.3 1304 79.1 16.1
Descriptive statistical results of other major variables are displayed in Table 3, which shows that though some differences do exist in each subset of Power_ave and Power_pca, the overall trend of change is relatively consistent, indicating that little bias is made in portraying the strength of CEO power by varying approaches. And the mean of Loss (corporate performance variable) implies that 8.7% companies in the study sample are in the case of loss.
Moreover, the average business revenue growth in the sample firms remains relatively high, at 22.7%, while about a quarter of the companies stay less than 2%, demonstrating a large variance in companies’ growth.
2 Gibson (2003) finds that the average rate of CEO turnover reaches 12.2% in the eight emerging markets surveyed while the rate of the primary global capital market is 15%, found by Defond and Hung (2004).
Table 3 Descriptive statistics of main variables Proxy forVariableSamplesMeanMedianSDMinimum25% quantile75% quantileMaximum CEO powerPower_ave81080.4830.5000.18200.3750.6251.125 Power_pca81080.0000.0220.371-0.893-0.2560.2611.099
Company performance
Roa81080.00400.062-0.231-0.0210.0320.170 Oroa81080.00300.050-0.229-0.0220.0290.166 Loss81080.08700.2820001
Company scale Lnsize810821.77221.6911.09719.01220.90622.37125.083 GrowthGrowth81080.2270.1760.464-0.9280.0180.3413.031
Asset-liability ratio
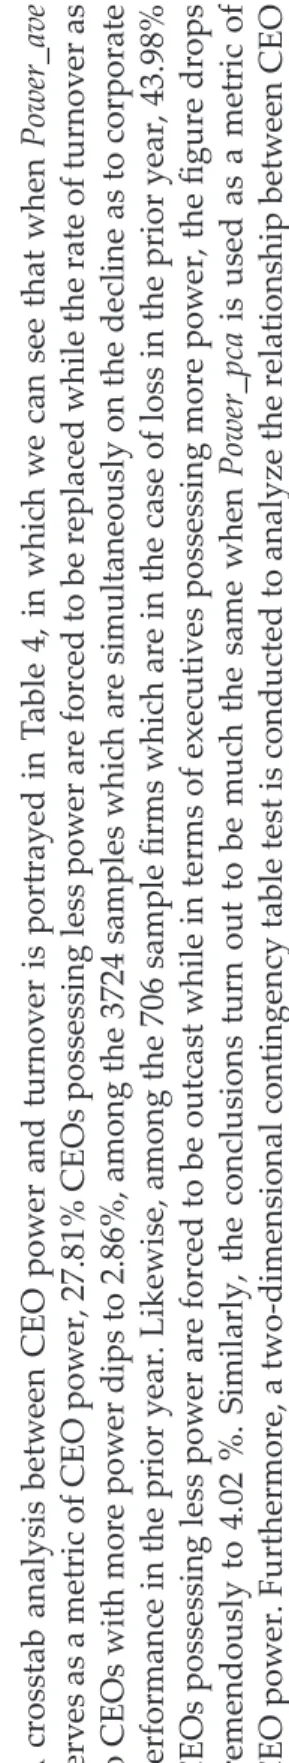
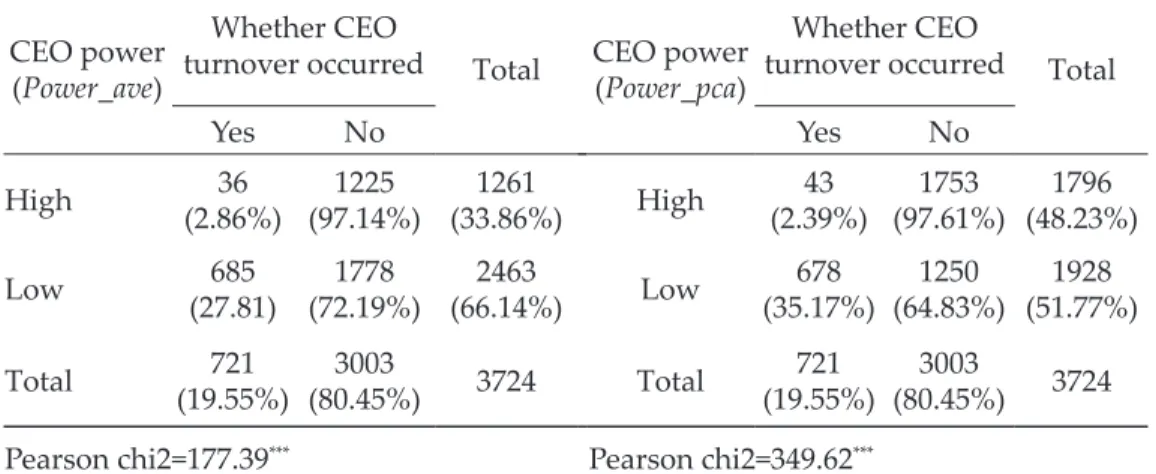
Lev81080.5160.5300.1950.0780.3620.6540.972 CEO AgeAge810848.012476.90227425276 Note: The indicator of company performance used is one-year lagging and the main financial indicators are winsorized. Univariate Analysis A crosstab analysis between CEO power and turnover is portrayed in Table 4, in which we can see that when Power_ave serves as a metric of CEO power, 27.81% CEOs possessing less power are forced to be replaced while the rate of turnover as to CEOs with more power dips to 2.86%, among the 3724 samples which are simultaneously on the decline as to corporate performance in the prior year. Likewise, among the 706 sample firms which are in the case of loss in the prior year, 43.98% CEOs possessing less power are forced to be outcast while in terms of executives possessing more power, the figure drops tremendously to 4.02 %. Similarly, the conclusions turn out to be much the same when Power_pca is used as a metric of CEO power. Furthermore, a two-dimensional contingency table test is conducted to analyze the relationship between CEO
power and turnover, from which we could see that Pearson chi2 is significant at the 1% level, indicating that with strengthening power, the likelihood of CEOs being replaced due to poor performance decreases remarkably, which also preliminarily support hypothesis 2 proposed previously.
Table 4 Cross-Tabulation test between CEO turnover and power
Panel A: Samples of declining performance over the prior year CEO power
(Power_ave)
Whether CEO
turnover occurred Total CEO power (Power_pca)
Whether CEO
turnover occurred Total
Yes No Yes No
High 36
(2.86%) 1225
(97.14%) 1261
(33.86%) High 43
(2.39%) 1753
(97.61%) 1796 (48.23%)
Low 685
(27.81) 1778
(72.19%) 2463
(66.14%) Low 678
(35.17%) 1250
(64.83%) 1928 (51.77%)
Total 721
(19.55%) 3003
(80.45%) 3724 Total 721
(19.55%) 3003
(80.45%) 3724 Pearson chi2=177.39*** Pearson chi2=349.62***
Panel B: Samples of loss over the prior year CEO power
(Power_ave)
Whether CEO
turnover occurred Total CEO power (Power_pca)
Whether CEO
turnover occurred Total
Yes No Yes No
High 8
(4.02%) 191
(95.98) 199
(28.19%) High 16
(5.86%) 257
(94.14%) 273 (38.67%)
Low 223
(43.98%) 284
(56.02%) 507
(72.93%) Low 215
(49.65%) 218
(50.35%) 433 (61.33%)
Total 231
(32.72%) 475
(67.28%) 706 Total 231
(32.72%) 475
(67.28%) 706 Pearson chi2=68.04*** Pearson chi2=87.17***
Note: Those whose power value is greater than the industry median is identified as high-power group, otherwise as low-power group. Roat-1–Roat-2 is the benchmark for declining corporate performance over the prior year. Figures in brackets are proportions of group samples to the entire samples. ***, **and * mean significance in the 10%, 5% and 1% level respectively.
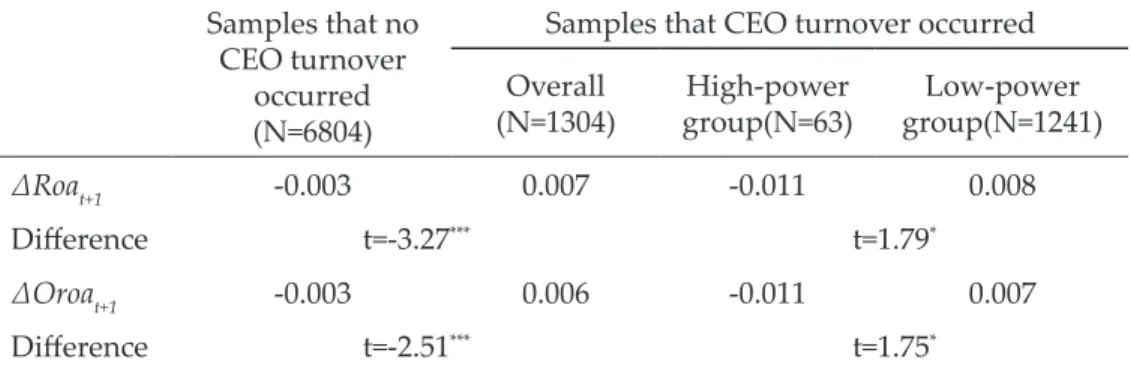
Table 5 below reports the influence made by CEO turnover and CEO power upon company’s performance over the next year. It can be seen that, overall, company performance can be boosted a lot when there occurred CEO turnover compared to those who didn’t, implying that some governance function lies in the CEO turnover mechanism of SOEs in China. However, some interesting
change appears when we group CEO power by its strength: corporate performance does not ascend but descend when CEOs possessing more power are forced to leave, whereas when executives possessing less power undergo mandatory turnover, company performance unexpectedly goes up in the next year and significant difference in the level of 10% exists between the two, to say the least. Blending these together, hypothesis 3 and 4A could be verified tentatively.
Table 5 Univariate test between CEO turnover and performance change over the next year Samples that no
CEO turnover occurred (N=6804)
Samples that CEO turnover occurred Overall
(N=1304) High-power
group(N=63) Low-power group(N=1241)
ΔRoat+1 -0.003 0.007 -0.011 0.008
Difference t=-3.27*** t=1.79*
ΔOroat+1 -0.003 0.006 -0.011 0.007
Difference t=-2.51*** t=1.75*
Note: Performance variables listed are mean and significant difference is tested by t-value calculated by Cochran-Cox (1950) to eliminate the impact of variance inequality in the two groups. Power_ave is used as a metric of CEO power. ***, **and * mean significance in the 10%, 5% and 1% level respectively.
Regression Analysis
The magnitude of CEO power is merely distinguished in univariate analysis by grouping dummy variables, making us difficult to observe in detail the different transmission mechanism of heterogeneous CEO power and unable to control the impact probably made by other factors. Hence, further regression analysis and more robust test remain to be done in order to know the exact relationship.
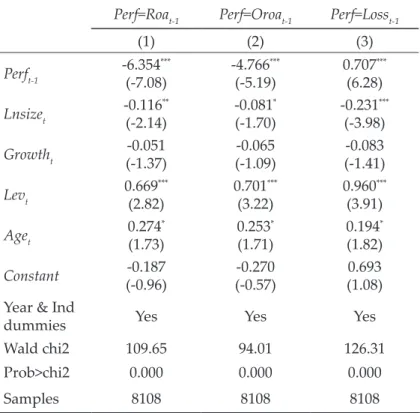
Logistic regression results between CEO turnover and company performance are reported in Table 6. Overall, CEO turnover is negatively correlated with accounting performance which is measured by Oroa and Roa and positively correlated with variable Loss, both significant in the 1% level, indicating that CEOs with poor performance are more likely to be forced to leave, which supports hypothesis 1. The empirical results are somewhat consistent with the researches home and abroad, and in the meantime have confirmed the “ability hypothesis” proposed by Hermalin and Weisbach (1998), namely:
firm performance serves as a barometer for the board to make judgment of executives’ ability as well as their efforts, CEOs more likely to be replaced with poor performance. Evidences above reflect that the current corporate governance structure of SOEs in China, despite questioned and accused by the public of its effectiveness in the process of progressive elaboration, embodies
in a way the principle of governing efficiency that “corporate performance does affect position change”. What’s more, the regression results of control variables are basically consistent with the conclusions drawn by domestic researches related, which need no more elaborations here.
Table 6 Regression results on hypothesis 1
Perf=Roat-1 Perf=Oroat-1 Perf=Losst-1
(1) (2) (3)
Perft-1 -6.354***
(-7.08) -4.766***
(-5.19) 0.707***
(6.28) Lnsizet -0.116**
(-2.14) -0.081*
(-1.70) -0.231***
(-3.98)
Growtht -0.051
(-1.37) -0.065
(-1.09) -0.083
(-1.41)
Levt 0.669***
(2.82) 0.701***
(3.22) 0.960***
(3.91)
Aget 0.274*
(1.73) 0.253*
(1.71) 0.194* (1.82)
Constant -0.187
(-0.96) -0.270
(-0.57) 0.693
(1.08) Year & Ind
dummies Yes Yes Yes
Wald chi2 109.65 94.01 126.31
Prob>chi2 0.000 0.000 0.000
Samples 8108 8108 8108
Note: Figures in brackets are statistic Z through White (1980) heteroscedasticity-robustness. ***, **and * mean significance in the 10%, 5% and 1% level respectively.
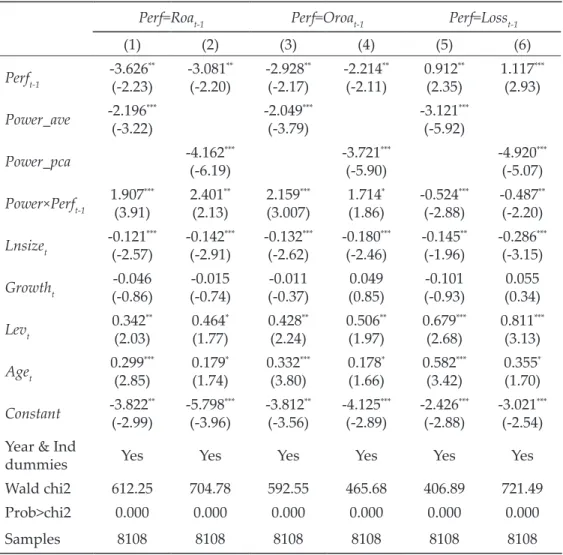
The testing results of hypothesis 2 are presented in Table 7 below. As can be seen, whether CEO power is measured in Power_ave or Power_pca, enhanced CEO power does have an adverse impact on the effectiveness of corporate governance, with the regression coefficient of Power×Perft-1, cross-term of CEO power and accounting performance (Oroa and Roa), being positive and Power×Perft-1, cross-term of CEO power and corporate Loss, negative with significance level being 10% or above. Meanwhile, the significance level of the three company performance indicators is also on a downward trend in varying degrees. The data above suggest that the role of company performance indicators in the decision-making alteration of CEO is weakened with an increasing CEO power in SOEs, and in the same time, distort the dynamic incentive contract by reducing the likelihood of forced dismissing of senior executives due to poor management, which supports hypothesis 2.
Table 7 Regression results on hypothesis 2
Perf=Roat-1 Perf=Oroat-1 Perf=Losst-1
(1) (2) (3) (4) (5) (6)
Perft-1 -3.626**
(-2.23) -3.081**
(-2.20) -2.928**
(-2.17) -2.214**
(-2.11) 0.912**
(2.35) 1.117***
(2.93) Power_ave -2.196***
(-3.22) -2.049***
(-3.79) -3.121***
(-5.92)
Power_pca -4.162***
(-6.19) -3.721***
(-5.90) -4.920***
(-5.07) Power×Perft-1 1.907***
(3.91) 2.401**
(2.13) 2.159***
(3.007) 1.714*
(1.86) -0.524***
(-2.88) -0.487**
(-2.20) Lnsizet -0.121***
(-2.57) -0.142***
(-2.91) -0.132***
(-2.62) -0.180***
(-2.46) -0.145**
(-1.96) -0.286***
(-3.15) Growtht -0.046
(-0.86) -0.015
(-0.74) -0.011
(-0.37) 0.049
(0.85) -0.101
(-0.93) 0.055 (0.34)
Levt 0.342**
(2.03) 0.464*
(1.77) 0.428**
(2.24) 0.506**
(1.97) 0.679***
(2.68) 0.811***
(3.13) Aget 0.299***
(2.85) 0.179*
(1.74) 0.332***
(3.80) 0.178*
(1.66) 0.582***
(3.42) 0.355* (1.70) Constant -3.822**
(-2.99) -5.798***
(-3.96) -3.812**
(-3.56) -4.125***
(-2.89) -2.426***
(-2.88) -3.021***
(-2.54) Year & Ind
dummies Yes Yes Yes Yes Yes Yes
Wald chi2 612.25 704.78 592.55 465.68 406.89 721.49
Prob>chi2 0.000 0.000 0.000 0.000 0.000 0.000
Samples 8108 8108 8108 8108 8108 8108
Note: Figures in brackets are statistic Z through White (1980) heteroscedasticity-robustness. ***, **and * mean significance in the 10%, 5% and 1% level respectively.
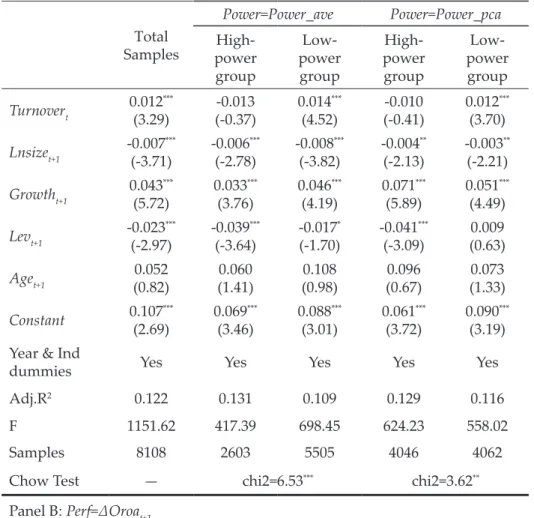
Table 8 demonstrates further regression results on corporate performance change of the next year, under the influence of CEO turnover and corresponding power characteristics. Overall, the regression coefficient of Turnover is positive in the 1% significance level whether corporate performance is measured by Roa or Oroa, indicating that the policy-making of CEO turnover in SOEs does have positive effect on corporate performance, which, in turn, support hypothesis 3. Further analyses show that whether CEO power is grouped by Power_ave or Power_pca, the enhancing effect of CEO turnover on corporate performance only appears when CEO possessing less power is replaced. In comparison, when CEO possessing more power is replaced, there’s no improvement in terms of corporate performance. In order to make a more reliable verification on the impact of heterogeneous power characteristics on CEO turnover,
significance test is made with Chow-Test on the group difference of regression coefficient of the variable Turnover. Research results are significant at least in 10% statistic level, which confirms research hypothesis 4A, i.e. the facilitating effect on corporate performance is more apparent when CEO possessing less power leaves office.
Table 8 Regression results on hypothesis 3
Panel A: Perf=ΔRoat+1 Total Samples
Power=Power_ave Power=Power_pca High-
power group
power Low- group
High- power group
power Low- group Turnovert 0.012***
(3.29) -0.013
(-0.37) 0.014***
(4.52) -0.010
(-0.41) 0.012***
(3.70) Lnsizet+1 -0.007***
(-3.71) -0.006***
(-2.78) -0.008***
(-3.82) -0.004**
(-2.13) -0.003**
(-2.21) Growtht+1 0.043***
(5.72) 0.033***
(3.76) 0.046***
(4.19) 0.071***
(5.89) 0.051***
(4.49) Levt+1 -0.023***
(-2.97) -0.039***
(-3.64) -0.017*
(-1.70) -0.041***
(-3.09) 0.009 (0.63)
Aget+1 0.052
(0.82) 0.060
(1.41) 0.108
(0.98) 0.096
(0.67) 0.073 (1.33) Constant 0.107***
(2.69) 0.069***
(3.46) 0.088***
(3.01) 0.061***
(3.72) 0.090***
(3.19) Year & Ind
dummies Yes Yes Yes Yes Yes
Adj.R2 0.122 0.131 0.109 0.129 0.116
F 1151.62 417.39 698.45 624.23 558.02
Samples 8108 2603 5505 4046 4062
Chow Test — chi2=6.53*** chi2=3.62**
Panel B: Perf=ΔOroat+1
Total Samples
Power=Power_ave Power=Power_pca High-
power group
power Low- group
High- power group
power Low- group Turnovert 0.009***
(3.06) -0.010
(-0.48) 0.009***
(3.10) -0.006
(-0.24) 0.009***
(2.91) Lnsizet+1 -0.005***
(-3.21) -0.006***
(-3.54) -0.005***
(-2.87) -0.006***
(-3.19) -0.005***
(-2.67)
Growtht+1 0.033***
(5.64) 0.031***
(3.92) 0.038***
(4.90) 0.041***
(5.19) 0.032***
(4.22) Levt+1 -0.021**
(-1.99) -0.024***
(-2.64) -0.012
(-1.39) -0.018**
(-2.20) -0.010 (-0.78)
Aget+1 -0.003
(-0.49) -0.003
(-0.50) -0.004
(-0.75) -0.002
(-0.24) -0.004 (-1.01) Constant 0.116***
(3.94) 0.103***
(2.79) 0.093***
(2.89) 0.120***
(3.78) 0.116***
(3.07) Year & Ind
dummies Yes Yes Yes Yes Yes
Adj.R2 0.114 0.105 0.120 0.097 0.106
F 1068.24 330.37 775.67 459.60 506.62
Samples 8108 2603 5505 4046 4062
Chow Test — chi2=3.54** chi2=3.07*
Note: High-power group are those whose power value is greater than industry median, otherwise it’s low-power group. Data in Table 8 are OLS regression coefficient and t-value is showed in brackets.
Heteroscedasticity robustness is not made due to the Chow test of the group difference of the variable Turnover. ***, **and * mean significance in the 10%, 5% and 1% level respectively.
Robustness test
To test the robustness of the conclusions above, sensitivity tests are conducted here: (1) With a view to eliminating the potential impact of distribution bias of CEO power, all the samples are divided into ten groups based on the magnitude of CEO power index (Power_ave and Power_pca), and sample companies whose CEO power are relatively in minimum and maximum scale constitute the first and the tenth group respectively. CEO power variables are assigned by group number and regression analysis is made again on the models by the newly- made power index. (2) Regression analysis is also made again on the related models by company performance indicators Roe and EPS which modified by industry median. (3) Given that company performance may be hardly affected if the CEO tenure is too short, sample companies in which the tenure of outgoing CEO is less than one year are kicked out and regression analysis is renewed on the main model.
All in all, there is no substantial difference between the robustness test results above and the previous findings, so that conclusions made previously are somewhat confirmed.
Continue... (Table 8)
FURTHER STUDY: CONTROL LEVEL, INSTITUTIONAL ENVIRONMENT AND GOVERNANCE EFFECT
Previous studies in this paper show that accumulating and enhancing CEO power in SOEs can significantly reduce the probability of forced dismission which may result from poor performance, thus distorting the dynamic incentives mechanism and impeding the functioning of corporate governance.
So, the question is how to suppress the out-of-self-interest-motif “managerial entrenchment” behavior? Based on related research findings home and abroad, government control level and institutional environment are taken into account for the governance effect of CEO power’s rent-seeking behavior.
Level of Government Control
With a management system in which shareholders of state-owned assets perform varied duties at varied levels, the ultimate control in state-owned listed companies is characterized by respective administration by central and local SASAC (State-owned Assets Supervision and Administration Commission).
There is remarkable difference in their behavior paradigm of SOEs controlled by central and local government, because of varied management objectives as well as varying degree of restraint mechanism and government intervention (Su and Fung, 2013). As for centrally-administered SOEs, CEO power’s rent- seeking behavior is likely to be curbed to a large extent, since their operation tends to be widely concerned and supervised by central government and international media as well. In contrast, local SOEs may weaken to a larger extent the incentive to maximize economic benefits due to their goal-oriented diversification, which naturally weakens the proportion of operating performance in the performance evaluation of CEOs, thus “entrenchment effect” may be more obvious.
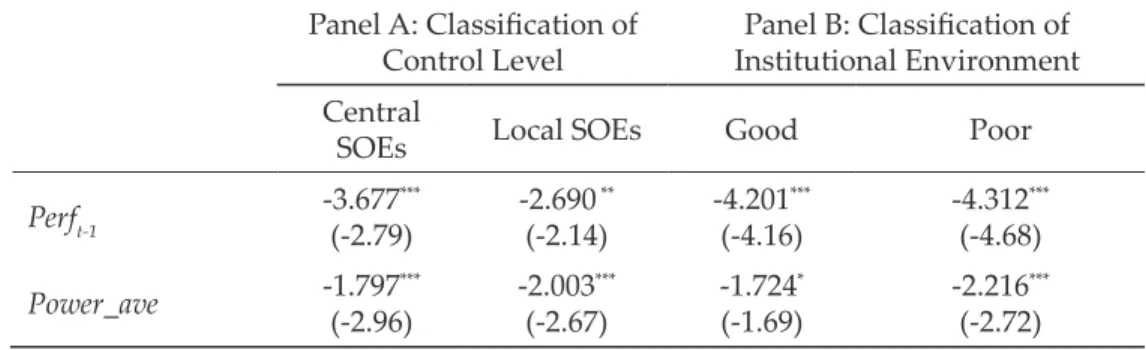
So learning from the practice of relevant literature, samples are divided into central SOEs and local SOEs according to the nature of the ultimate controller, and Model (2) has also been regressed once again3. From the regression results in column A, Table 9, we know that the coefficient of cross-term Power_
ave×Perft-1, is negative but not that significant in the sub-samples of central SOEs, but it is significantly positive in the sub-samples of local SOEs, with this difference at 5% statistical significance in Chow test. The evidence indicate that the upgrading of government control level could effectively strengthen the mandatory replacement mechanism, especially for those underperformance CEOs, which could in turn, to some extent, inhibit CEO power’s rent-seeking behavior.
3 The regression results indicate almost the same conclusions could be drawn whether CEO power is measured by Power_ave or Power_ave. For simplicity, this paper merely presents the results of Power_ave measurement, the same below.
Institutional Environment
As a crucial external governance mechanism, institutional environment plays an evident role in the effective functioning of the internal corporate governance mechanism, from which corporate governance structure rises, by and large (Claessens and Fan, 2002). Meanwhile, process of marketalization is also an important driving force for the evolution of executives’ static incentive contract (Li et al., 2013). Then here comes the question: whether institutional environment improvement could have a corresponding constraining effect on top management self-interest behaviors under the dynamic incentive contract?
Based on the common practice by scholars nationwide, marketization index compiled by Fan et al. (2011)4 is used to portray the institutional environment discrepancy in varied regions of each year, with the index the higher the better. If the index is greater than the median, its institutional environment is good, and vice versa. From the regression results in column B, Table 9, the regression coefficient of Power_ave×Perft-1 is positive but not significant in the sub-samples of “good institutional environment”, but significantly positive in the sub-samples of “poor institutional environment”, with this difference at 10% statistical significance in Chow test, suggesting that improvement in the institutional environment can weaken the impediment of CEO power on corporate governance mechanism, hence improving the efficiency of the company’s internal governance.
Meanwhile, conclusions above also give support to the applicability of
“outcome hypothesis” in Chinese SOEs, which concerns the relationship between institutional environment and corporate governance (Doidge et al., 2007). It claims that corporate governance is merely a response to external institutional environment and the former could only play an effective role under the premise of good institutional environment. Therefore, the research findings above are valuable references for a better understanding of the role of corporate governance in China.
Table 9 The governance efficiency of control level and institutional environment Panel A: Classification of
Control Level Panel B: Classification of Institutional Environment Central
SOEs Local SOEs Good Poor
Perft-1 -3.677***
(-2.79) -2.690 **
(-2.14) -4.201***
(-4.16) -4.312***
(-4.68) Power_ave -1.797***
(-2.96) -2.003***
(-2.67) -1.724*
(-1.69) -2.216***
(-2.72)
4 The marketization index compiled by Fan et al. (2011) has only been renewed by 2009.
Therefore, the marketization index of 2010-2012 is actually the data of 2009 in view of the stability and continuity of institutional environment in adjacent years.
Power_ave×Perft-1 -0.945
(-0.59) 2.747***
(3.03) 0.116
(0.95) 2.092**
(2.21)
Lnsizet 0.101
(0.28) -0.154***
(-2.69) -0.091
(-1.26) -0.143* (-1.66)
Growtht -0.142*
(-1.76) -0.037
(-0.63) -0.257*
(-1.70) -0.063
(-0.61)
Levt 0.230
(1.31) 0.398*
(1.71) 0.332***
(2.55) 0.211
(1.08)
Aget 0.311***
(2.92) 0.224***
(2.65) 0.393**
(2.19) 0.479***
(3.17)
Constant -1.685*
(-1.74) -0.792
(-0.95) -1.979
(-1.21) -2.681**
(-2.01) Year & Ind
dummies Yes Yes Yes Yes
LR chi2 241.52 418.51 284.55 316.81
Prob>chi2 0.000 0.000 0.000 0.000
Samples 2116 5992 3990 4118
Chow Test chi2=5.29** chi2=3.17*
Note: company performance=Roa. Z value of regression coefficient is showed in brackets. Heteroscedasticity robustness is not made due to the Chow test of the group difference of Power_ave×Perft-1. ***, **and * mean significance in the 10%, 5% and 1% level respectively.
CONCLUSIONS AND RECOMMENDATIONS
Pillar of national economy, SOEs are of paramount significance to the superiority of our socialist system, economic growth, national defense capability and national cohesion, so we must make every endeavor to enhance its vitality and competitiveness to the fullest potential. Among other things, the construction and upgrading of the turnover mechanism for those underachieved CEOs, based on dynamic incentive contract, is the core for the reform of SOEs, both the need for sustainable development of SOEs and the key for improvement of supervision system on SOEs.
By inspecting the impact of CEO power on policy-making of top management turnover in SOEs, this study offers a more detailed clue on a better understanding of the role of executive power in corporate governance.
Based on the sample analysis of the listed SOEs from 2004-2012 in China, the empirical study finds: (1) CEO turnover is significantly correlated with company performance, either deterioration or loss, while enhanced CEO power reduces the correlation between the likelihood of top management turnover and poor company performance, indicating that CEOs in SOEs do have a detrimental effect on the efficiency of corporate governance through Continue... (Table 9)
their exertion of power; (2) CEO turnover does have an improving effect on companies’ future performance, yet it only appears after CEOs possessing less power are replaced and future company performance show little improvement if CEO possessing more power are changed; (3) Further studies also show that the upgrading of the administrative level and the improvement of institutional environment may weaken the negative impact of CEO power upon corporate governance efficiency, thus inhibiting the rent-seeking behavior of SOEs’ chief executives. Evidence presented in this paper reveals that the self-interested behavior of CEO power in SOEs impede the regular functioning of dynamic incentives and affect, accordingly, the efficiency of corporate governance.
To sum up, it is of important theoretical and policy implications for the continual promotion and deepening of SOEs’ reform in an era of economic restructuring: to start with, as no signs of improvement have been showed on company performance after CEOs possessing more power leave office yet they do hold sway over their turnover policy-making, then how to select and recruit “successors” after those CEOs are dismissed is the top concern under a management dynamic incentive mechanism in which a company- performance-oriented barometer is taken, by means of restructuring SOEs’
power supervision system, enhancing board independence, etc.; furthermore, the study could offer confirmations to the idea that, as opposed to centrally- administered SOEs, position entrenchment effect in local SOEs may be more serious due to senior executives’ self-interested motives. As a result, under the guidelines of “company law” and “securities act”, it is a pressing fact for local SASAC, the ultimate controller of local SOEs at varied levels, to exercise their power as large shareholders in the board structure, so that the effectiveness of oversight over senior management could be enhanced; lastly, this research reveals that institutional environment, as external surroundings of corporate governance, plays a certain “refuge effect” on internal corporate governance mechanisms, telling us that structure reform of SOEs should not only focus on internal governance, but also base on external institutional environment in the meantime. Therefore, a progressive market-oriented process, strengthened industry competiveness and a raising level of the rule of law are in dire need so that external governance milieu of companies could be fundamentally improved.
Of course, the study is also deficient in the following: 1. In light of China’s governance practices, CEO turnover includes multiple complications such as promotions within the parent firms or up to higher-ranking government officials, an ignorance of whose examination would lead to the scarcity of a whole understanding of the distorting effect of incentives on senior executives;
2. Sample analysis of company performance change conducted in this paper only extends to the first following year after CEO turnover, yet some current studies reveals that a longer window period is in need to observe the performance of successor, which may involve some degree of earnings management. Hence, the reliability of the conclusions in this article may discount a little bit with these limitations, but they also, fortunately, pave the way for future studies which are worth exploring in depth.