Malaysia Cataloging-in-Publication Data Rqjort of Core Group Meeting on Identification of Indicators. Report of the Core Group Meeting on the Identification of Indicators for Sustainable Development and Management of Capture Fisheries in the ASEAN Region. REPORT FROM THE MEETING OF THE CORE GROUP ON THE IDENTIFICATION OF INDICATORS FOR SUSTAINABLE DEVELOPMENT AND MANAGEMENT.
The Assembly was informed about the format and work plan for the preparation of the Final Draft. The points presented by Members of the Core Group are summarized and combined into a draft of the Regional Guidelines.
LIST OF PARTICIPANTS
TECHNICAL WORKING GROUP MEETING ON THE IDENTIFICATION OF INDICATORS FOR THE
The status of the implementation of the pilot projects and the Work Plan 2004 and Revising the Work Plan 2005
Work Plan and Strategies for Preparation of the Regional Guidelines on Use of Indicators for Sustainable Development and Management of Capture Fisheries in the
Dr. Yasuhisa Kato
Discussion on other issues related to the projects Chairman 4: Mr. Rosidi Ali
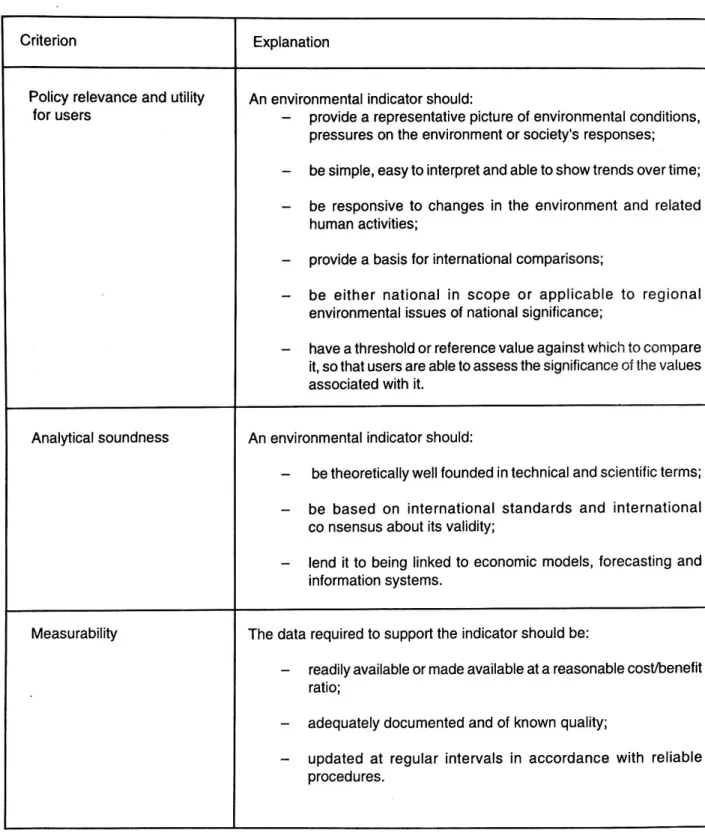
Ease of availability
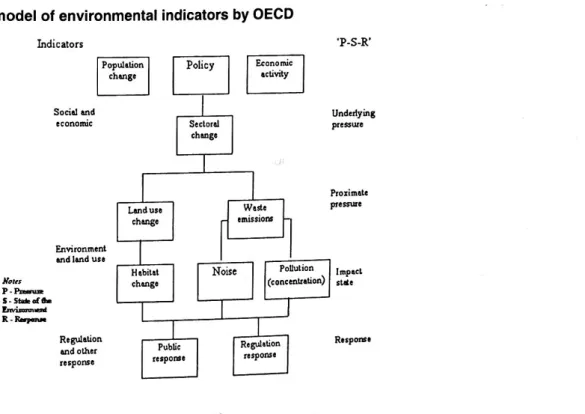
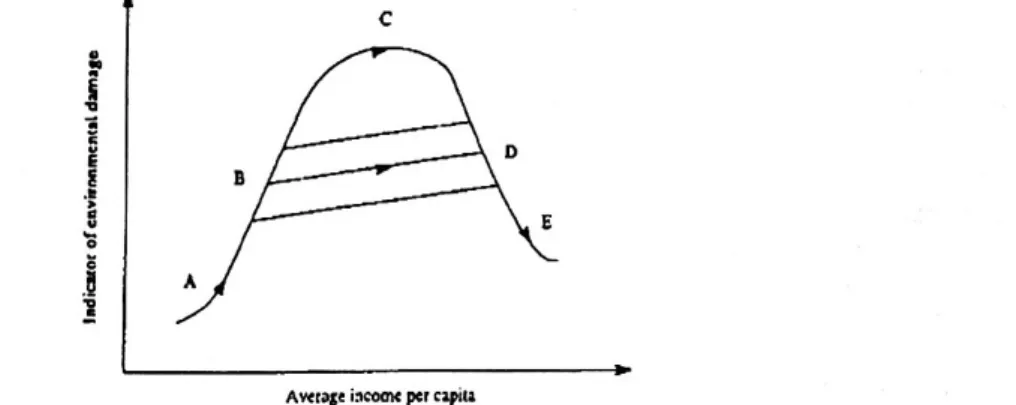
It is not clear that the use of the "pressure-state-response" model is applicable to the ecological modernization interpretation of sustainable development. Another interesting example of the extension of environmental indicators to include the assessment of sustainable development is the development of 'environmental Kuznets curves' (World Bank 1992, Grossman 1995). Part of the economic development process involved changes in the composition of production as well as its scale.
Even without changes in technology, this modification of the composition of output will reduce the adverse impact of economic growth on the environment. Living standards expressed as a proportion of purchasing power-adjusted GDP per head using a logarithmic scale (in which incomes above a threshold level of PPP$5,711 • the average world income - are subject to discounting, while those below are not).

OBJECTIVES AND TARGETS
DATA COLLECTION (to include standardization), ANALYSIS AND INTERPRETATION
- The data collection depends on the indicators identified. In the case of demersal trawl fishery , the following is the required data and information
The data will initially be standardized on the days of trawling effort in zone 2, which cover the majority of trawl catches. A basic statistical treatment will be used to determine the likelihood of error in the estimates. Changes in the species composition of the trawl catch are used as an indicator as this would indicate the impact of the fishery on the catch species and biodiversity.
In addition, the change in the composition of the community of exploited species will also indicate the state of the general state of the ecosystem, especially biological overfishing due to the capture of parent fish stocks or juvenile fish stocks. Species identification will be an important part of the analysis to separate low-value fish from marketable fish reported only by fishermen. Standardization will be carried out after operational days or fishing effort of trawlers.
A community analysis (such as twin space use) will be performed to determine the surface distribution of species as well as some temporal distributions. This will contribute to the management of important fish stocks, such as Changes in the size of the fish in the catch is used as an indicator as it can be observed by a decrease in landings, a greater effort to catch, or a decrease in the average size of the fish that can prompt the adoption of management measures.
In addition to this, available data from the trawl survey conducted in with sporadic surveys from 2000 to 2004 are also used to check the status of biomass and fish stock density in a particular area. As mentioned above, these are some of the indicators identified and used for the implementation during the pilot project, but the use of other indicators such as economic, social-cultural and environmental related indicators and other scientific data such as the size of spawners has not implemented , which are necessary and necessary to ensure greater achievement of fisheries management objectives. EXAMPLES OF INDICATORS (including methodology for pelagic, bottom and inland fishing) 5.1 The following indicators are used in the bottom trawling project based on the following criteria:- 5.1 The following indicators are used in the bottom trawling project based on the following criteria :-.
USE OF INDICATORS (in planning, communication, monitoring and evaluation)
MONITOR3NG AND REVIEW OF MANAGEMENT PERFORMANCE
STAKEHOLDER CONSULTATION AND PARTICIPATION
However, there is still a need to strengthen and improve the current fisheries statistics, which must be timely, reliable and readily available.
ANNEX TO INCLUDE
- Definition of indicator (include categories of indicators) Definition of indicator
- How to develop indicators
- Data collection
Stakeholders meet to discuss the type of indicators that will be used for fisheries management. Use of indicators (in planning, communication, monitoring and evaluation) Information on the status of fish resources and fisheries. Countries should implement the regional guidelines on the use of indicators for the development and implementation of indicators for responsible fisheries management in Southeast Asia.
Social Acceptance Indicators Good indicators include; .. i) Cost-benefit ratio ii) Monthly income iii) Number of fishermen iv) Landing value v) Investment vi) Employment .. vii) Profitability/cost per trip Fleet/capacity indicator. Changes in the percentage of waste fish, catch composition, exploitation levels and the number of illegal vessels/gear are among the indicators used to monitor or evaluate the performance of management measures. The first workshop focuses on introducing the use of indicators in fisheries management.
This should be a planned meeting to monitor and evaluate the use of the indicator, the number of staff and the training required. Sometimes, however, the effort of a unit should be the number or size of fishing gear, for example, in the case of a gillnet, the effort would be the length of the net in 180 meters, or the effort of the ash of fish traps would be the number of those traps. Effort Number of working hours according to the type of tool Type of tool Operating time Drag net.
Number of standard trawlers (taking into account the type of boat) Number of standard trawler days. For handline fishing, it may be more appropriate to consider the number of fishing days or the number of hooks used times the number of days. In this case, it may be necessary to take into account that the fisherman on the same boat are competing, so that the effort is not a linear function of the number of fishermen.
For example, the number of hours fished :i?nes engine horsepower may be an appropriate measure of effort in some bottom trawl fisheries, while in a trawl the type and number of hours are likely to be less important than the number of gill nets set per day. In the above-mentioned case boats, the number of fishermen may not be linearly related to the fishing power.
TROLLING 3. POLE AND LINE
- Stakeholder consultation & Participation
- Development of national system to use indicators
- Follow-up aciions (to promote use of guidelines and to include HRD and capacity building) DOF should formulate guidelines to promote the use of practical and simple indicators for multi-species
- Annex to include -Glossary
The indicator is used as a tool to indicate the status of fisheries resources to decision makers and all stakeholders should develop an appropriate policy and management plan for sustainable use. When fishermen realized that they had to present the status of fish stocks, they had to be convinced to take action for each implementation. A legitimate forum among the stakeholders should be provided to raise issues and problems, then select the problem at hand and carry out consensus building activities to craft a suitable solution.
Stakeholder consultation between the main stakeholders within the fisheries system should be organized for effective fisheries management in the development and application of indicators. After the selection of indicators is completed, the selected indicators should be tested for suitability and feasibility of use in each local area. The Government/Fisheries Department should investigate and identify the current limitations of the fisheries statistical system.
Mechanisms to improve system, regional compatibility and standardization should be sought to meet management requirements. DOF should initiate and maintain its service to improve the regional fisheries statistics mechanisms in cooperation with the government and relevant organizations. DOF should consider providing ongoing management support for the improvement and refinement of national fisheries statistical systems.
The DOF should expand the classification of some major economic species in the national fisheries statistics to take into account national fisheries in marine resources. Stakeholders within the fisheries system should be researchers who conduct studies to monitor the status of fishery resources as an input to management decision. Trash fish: The Department of Fisheries (DOF) defines trash fish as ash and invertebrate species, which can be used as animal feed.
Type of Long - term Asset
- Body (include navigation instruments and other composition except engine)
Variable Cost
Rental fee and other fees 3.1 Rental fee (Luring . boat per bag) Registration fee Fishing license fee Otehr fee. Master Fishermen Assistant Steersman Steersman Assistant Machinist Machinist Assistant Cook Chief Deck hand Deck hand Diver Other Total.
Income
- Fisheries income
- Landing place
- Debt burden of fisheries operation
- Fisheries Problems 2
Final Draft
- DEFINITION
- HOWTO DEVELOP INDICATORS
- STAKEHOLDER CONSULTATION AND PARTICIPATION
- DEVELOPMENT OF NATIONAL SYSTEM TO USE INDICATOR
- FOLLOW-UP ACTIONS TO PROMOTE THE USE OF INDICATORS
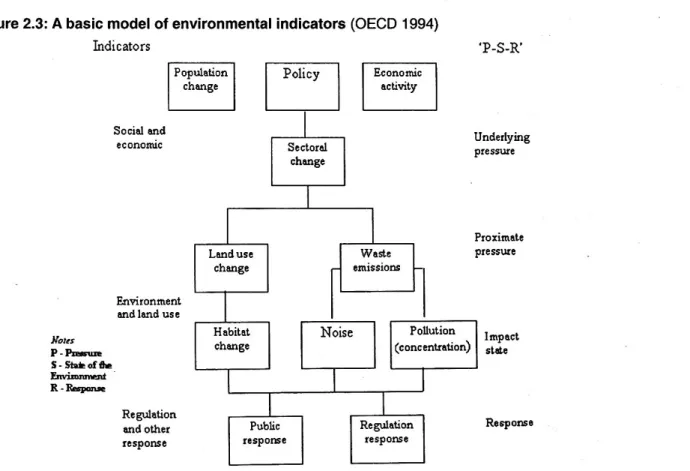
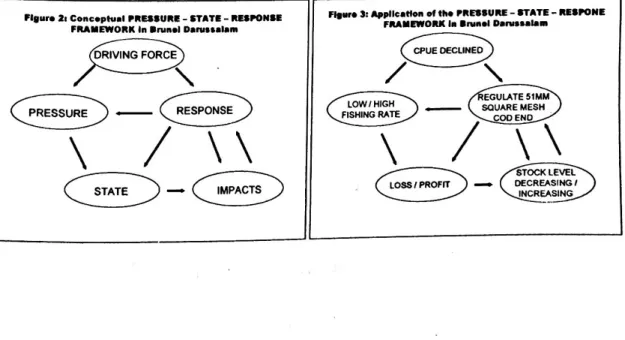
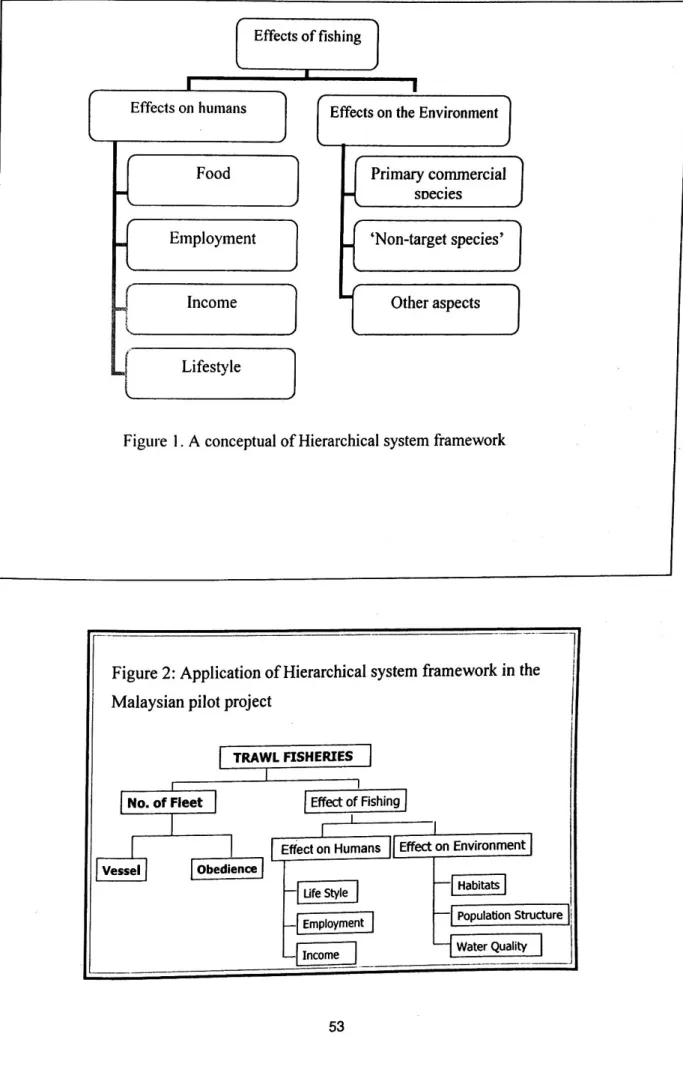
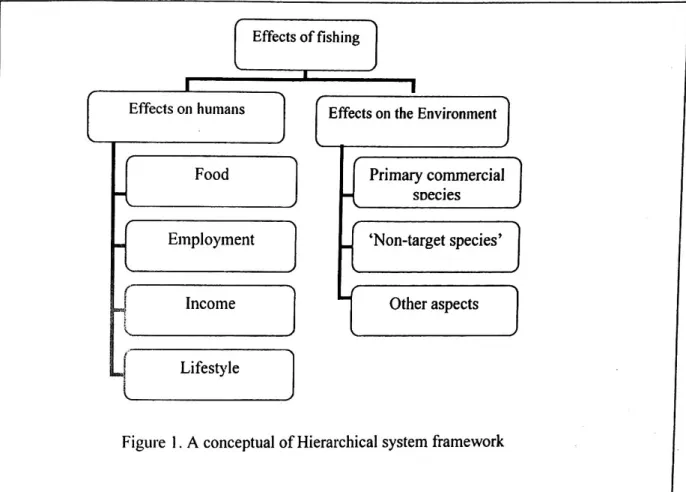
In accordance with the “Regional Guidelines for Responsible Fisheries in Southeast Asia: Responsible Fisheries Management*', the use of practical and simple indicators should be promoted to supplement classical fisheries management models within national management frameworks, especially in relation to with the relief of the local level in time. fisheries management decision. For manageable and successful implementation, the coverage area should focus on sustainable fisheries development and management. Three types of framework recommended based on experiences during the implementation of pilot projects. i) Pressure-State-Response (PSR) - used by Brunei Darussalam and the Philippines in the pilot project. ii) Hierarchical System Method - used by Malaysia and Indonesia (iii) Standard Score Method - used by Thailand.
Mechanisms to improve the system must be developed to ensure regional compatibility of data for timeliness, reliability and availability of the information. The committees will regularly give advice on the use of indicators in the management of the fisheries. However, because they ignore socio-economic considerations, such indicators can only provide a necessary rather than a sufficient test of the ecological modernization interpretation of sustainable development.
Nevertheless, environmental indicators provide a starting point for many of the attempts to develop suitable indicators for the broader concepts of sustainable development, and a brief review of such developments provides a useful introduction to the general methodological issues involved. Nearby pressures then produce impacts on the current state of the environment, which are measured in terms of changes in habitat, noise, ambient pollution levels and concentrations of waste in the environment. There should be a small delay between the element being measured and the availability of data about it.
Comparability Ideally, international comparisons should be possible through the use of appropriate indicators, but those chosen should not be chosen solely to simplify international comparisons at the ex. The implementation of the model in the pilot project in Brunei Darussalam is shown in Figures 2 and 3. onai Technical Guideline on the Use of Indicators for Sustainable Development Fisheries in the ASEAN Region prepared by Ranimah HjAbd Wahab. The authors emphasize that the value of some elements of the structure can be negative. These weights will be used to combine the values of the indicators from the bottom level of the hierarchical tree.