Beberapa sifat asas kritikal natrium glisinat berair diukur untuk pelbagai masalah berat. %) pada suhu yang berbeza. Beberapa sifat asas kritikal dalam larutan akueus natrium glisinat telah diukur dengan berat. %) pada suhu yang berbeza. Ujian penyerapan untuk mengukur keterlarutan karbon dioksida dalam larutan akueus natrium glisinat menggunakan sel keterlarutan tekanan tinggi SOLTEQ BP-22.
INTRODUCTION
- Background
- Natural Gas History
- Natural Gas Constituents
- Problem Statement
- Research Objective
- Research Scope
The water content in natural gas must be removed to improve its heating value. Aqueous alkanolamine solutions are widely used as a reactive solvent for acid gas removal in natural gas processing. The performance of amino acid salt as a sour gas absorber at higher pressure systems is required for natural gas processing applications.
![Table 1.1 Malaysia’s oil and gas energy data (Source: EIA Report, 2008 [2])](https://thumb-ap.123doks.com/thumbv2/azpdforg/10248820.0/16.892.155.811.174.581/table-malaysia-oil-energy-data-source-eia-report.webp)
LITERATURE REVIEW
- Natural Gas
- Acid Gases
- Absorption
- Alkaline Salt
- Alkanolamines
- Amino Acid Salt
Alkaline salt, alkanolamine and amino acid salt are among the solvent types suitable for acid gas removal. The application of amino acid salts for the removal of acid gas has been used by BASF with their Alkacid process. Acid gas removal from natural gas is another possible application for CO2 removal using amino acid salt.
METHODOLOGY
- Amino Acid Salt Preparation
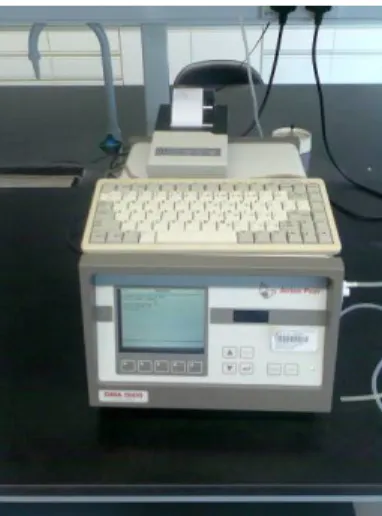
- Density
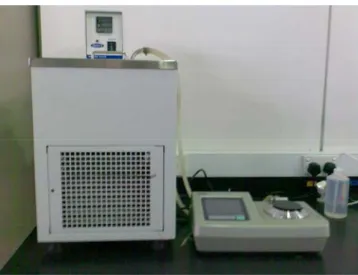
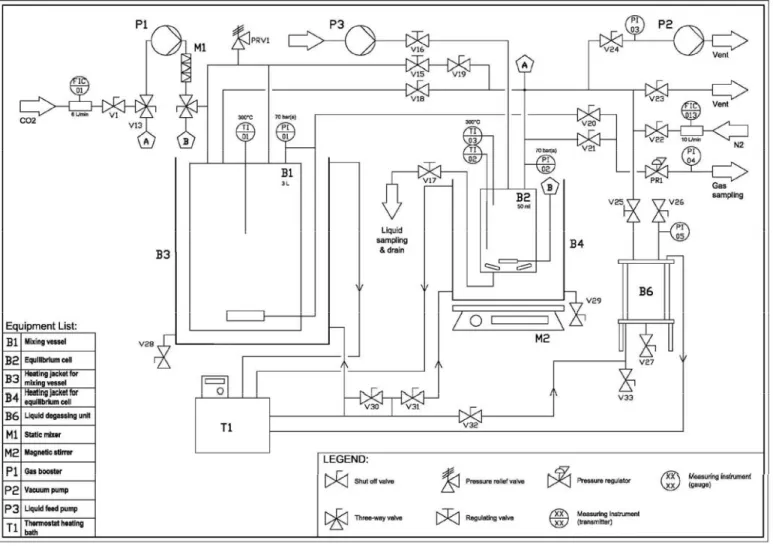
- Equipment description
- Measurement method
- Kinematic Viscosity
- Equipment description
- Measurement method
- Calculation method
- Heat Capacity
- Equipment description
- Measurement method
- Calculation method
- Refractive Index
- Equipment description
- Measurement method
- Acidity
- Equipment description
- Measurement method
- Conductivity
- Equipment description
- Measurement method
- Surface Tension and Contact Angle
- Equipment description
- Equipment description
- Experimental method
- Regenerability test
The density, ρ, of an aqueous sodium glycinate solution is measured using an Anton Paar DMA-5000 digital vibrating tube density meter. The pH of the sodium glycinate solution before and after absorption is measured at a temperature of 298.15 K. The conductivity of the aqueous sodium glycinate solution is measured before and after the absorption test at a temperature of 298.15 K.
RESULT
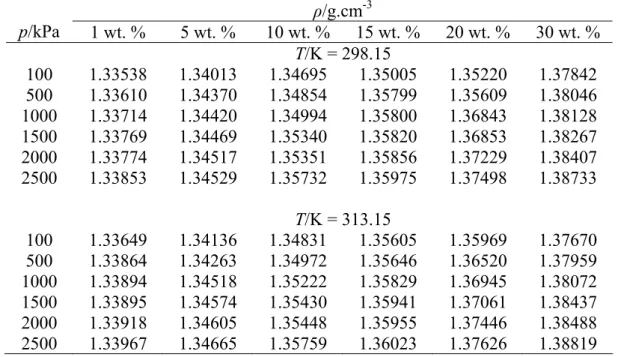
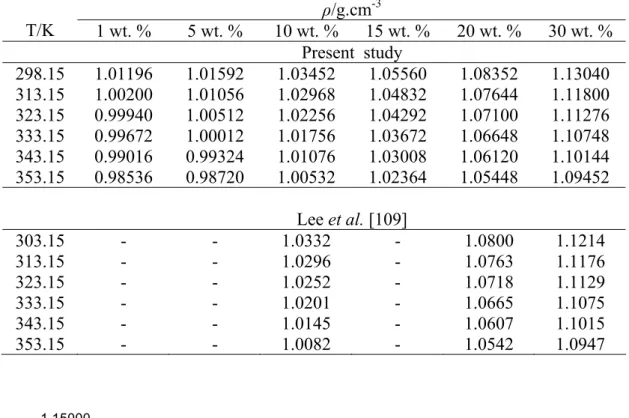
Density
The minimum and maximum absolute errors of the data within the study interval are found to be 0.00125 and 0.01115, respectively. Similarly, the density measurement of sodium glycinate aqueous solution after CO2 absorption was carried out and the result is shown in Table 4.2. The density of aqueous sodium glycinate after CO2 absorption gave higher values compared to the solution before absorption and increased with increasing pressure.
The multiple regression method is applied to the density data after absorption to quantify the effect of absorption pressure and solution concentration at constant temperature. The small value of error and RSME proves that equation 4.4 could be used to represent the effect of absorption pressure and solution concentration on the density of CO2-loaded aqueous sodium glycinate within the range studied.
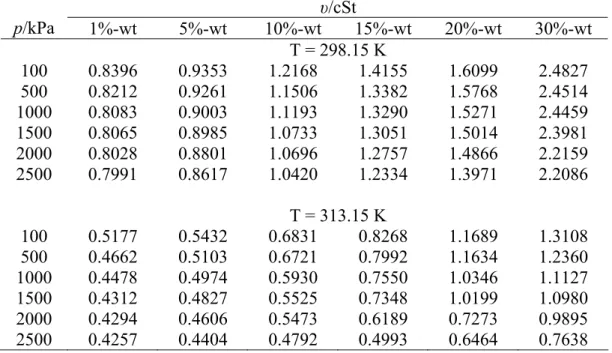
Kinematic Viscosity
The calculation error (ε) and root mean square error (RMSE) of the data are calculated using Equation 4.2 and Equation 4.3. Based on the correlation result in Table 4.6, Equation 4.6 is appropriate to represent the effect of absorption pressure and concentration on the kinematic viscosity of sodium glycinate aqueous solution within the studied range.
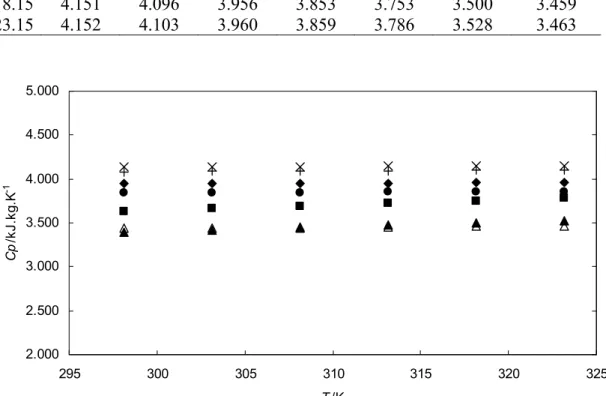
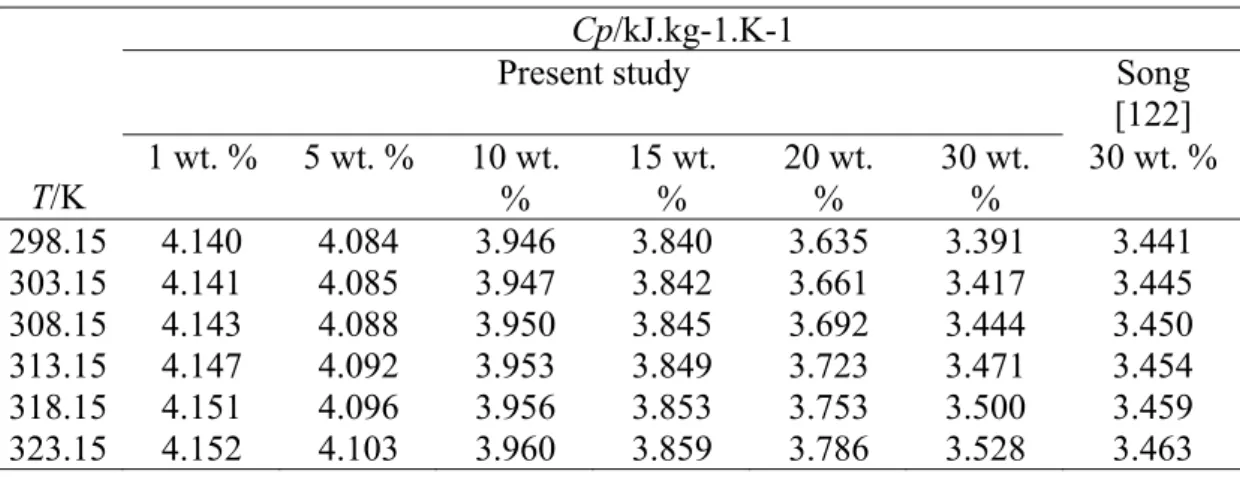
Heat Capacity
Similarly, the measurement was done for solution after CO2 absorption at 298.15 K to avoid the effect of temperature change on the CO2 charge of the initial sample [123]. Heat capacity of the solution after CO2 absorption at 298.15 K is expressed as a function of CO2 loading factor (α). As observed from the result, the heat capacity of the CO2 loaded solution increases with temperature but decreases with the CO2 loading.
Therefore, it was found that the heat capacity of an aqueous solution of sodium glycinate loaded with CO2 is lower than that of an unloaded solution. The computational error (ε) and root mean square error (RMSE) of the data are calculated using Equation 4.2 and Equation 4.3.
Refractive Index
Therefore, equation 4.9 could be used to estimate the concentration of an unknown sodium glycinate solution based on its refractive index and temperature for a concentration range of 1 to 30 wt.
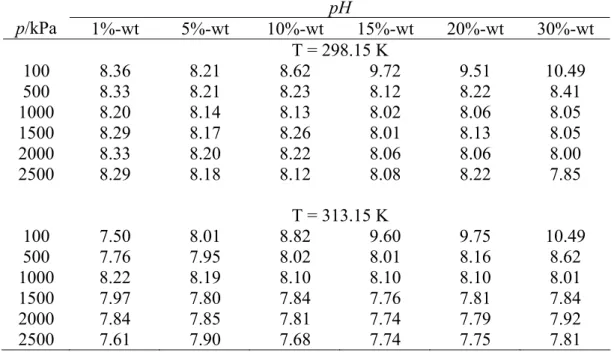
Acidity
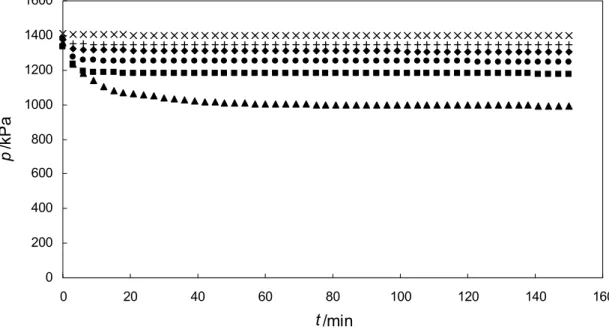
The acidity of solution at high concentration is still at base condition with pH more than 9. From the observation of the system pressure profile during absorption process, it is found that amount of available CO2 is the factor that limits the absorption for high solution concentration at 100 kPa. From Figure 4.3 it can be observed that the system pressure is limited to a certain value.
The absorption process is stopped in this condition, thus resulting in a lower amount of CO2.
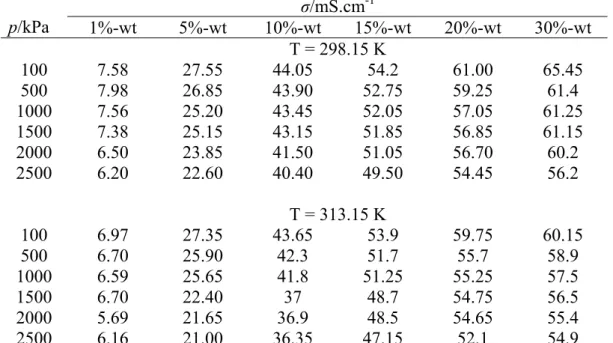
Conductivity
The effect of CO2 absorbed by the solution at constant temperature is expressed in Equation 4.10 as a function of the solution conductivity before absorption and absorption pressure using multiple regression method.
Surface Tension and Contact Angle
Absorption Test
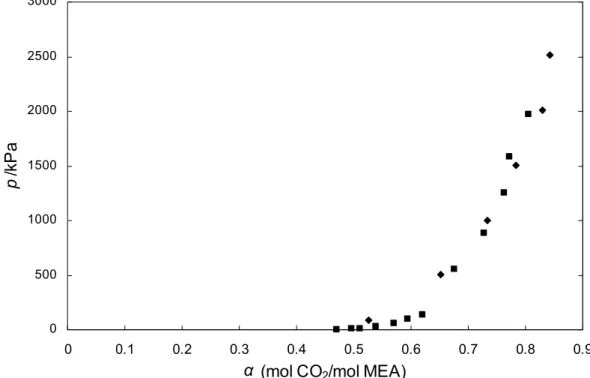
The solubility of carbon dioxide in aqueous solutions of sodium glycinate is expressed as CO2 loading factor (α = mol CO2/mol SG). The measured values of carbon dioxide solubility in aqueous sodium glycinate solutions for temperatures of 298.15 K and 313.15 K are shown in Table 4.24. It is observed that at the same temperature, the CO2 charge factor increases with the increase in CO2 partial pressure, but decreases with the increase in sodium glycinate concentration.
The results agree with this theory, the CO2 loading factor of aqueous sodium glycinate solution at temperature 313.15 K is lower than at temperature 298.15 K within the pressure range studied. Based on the CO2 absorption mechanism explained in section 2.6, one mole of CO2 will react with 2 moles of amino acid salt, therefore the increase in the amount of absorbed CO2 will be lower than the increase in concentration. Statistical analyzes for full factorial designs estimate the effect of the interaction strength of pressure and concentration on the solution's CO2 loading factor.
The loading capacity of aqueous sodium glycinate at 313.15 K is compared with those of Song et al. Comparison of loading factor for aqueous sodium glycinate solution with published data for MEA [81] is shown in Figure 4.10. It has been found that sodium glycinate has higher loading capacity compared to MEA for the same solution wt.
This result indicates that aqueous sodium glycinate solution has a good potential as an alternative absorbent for acid gas removal.
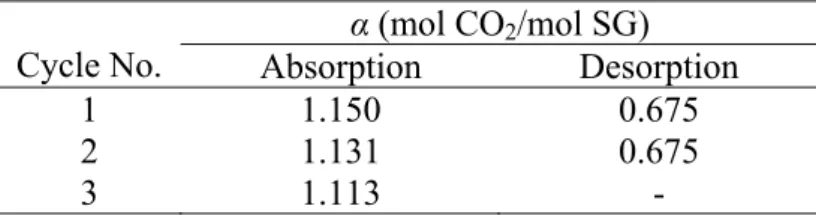
Regenerability test
Several correlations have been proposed to quantify the effects of temperature and solution concentration on the physical properties of the solution. The results of the adsorption test and the regeneration test showed that the sodium glycinate aqueous solution has a good potential as an alternative absorbent for acid gas removal. Several correlations have also been proposed to quantify the effect of CO2 loading on the physical properties of sodium glycinate as a function of the physical properties of the uncharged solution and the adsorption state.
Some of the results are compared with previous published data and they are in good agreement with the published data. These results will be a valuable addition to the information database needed to support the absorber design with sodium glycinate as absorbent.
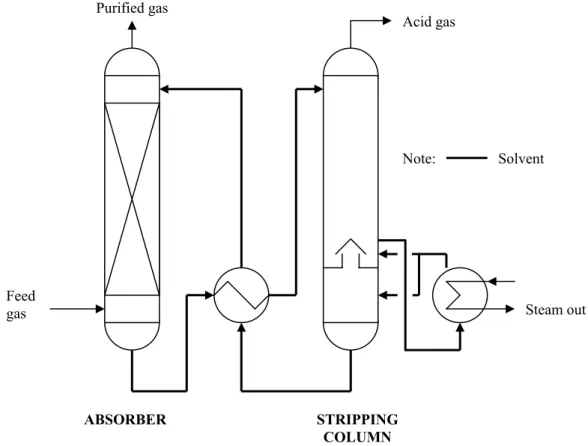
DESIGN OF ABSORPTION PROCESS
- Absorber
- Design of Absorber
- Material and Energy Balance around Absorber
- Process description
- Calculation method
- Design parameter
- Diameter of Absorber Calculation
- Calculation method
- Design parameter
- Absorber Design Result
During this contact, the acid gas will be transferred from the feed gas to the absorbent. The feed gas consists of hydrocarbon gas, acid gas and water vapor for natural gas feed. Then calculate the acid gas vapor pressure at used solution temperature for the assumed acid gas load.
The vapor pressure of the acid gas at the temperature of the spent solution can be obtained from the vapor-liquid equilibrium (VLE) data of the acid gas absorbent. Calculate the required inlet flow rate of the regenerated absorbent based on the total acid gas uptake (AGPU) of the absorbent. AGPU) is the difference between the acid gas load of the spent solution and the inlet absorbent.
The flow ratio is the ratio of the minimum or maximum allowable flow to the design flow at which the process can operate without affecting its performance. 2; ρL is the liquid density in kg.m-3; σ is the surface tension of the liquid in N.m-1; dh is the diameter of the hole in m; Lw liquid flow in kg.s-1; lw is the height of the dam in m. The hole spacing is the center distance between the holes in the screen tray according to the configuration of the holes.
Nevertheless, these results suggest that sodium glycinate could be a potential alternative absorbent for acid gas removal.
![Figure 5.1 Typical commercial tray; (A) Sieve tray (Source: Kohl [5]); (B) Bubble cap tray (Source: Millard [131]); (C) Valve tray (Source: Nutter [133])](https://thumb-ap.123doks.com/thumbv2/azpdforg/10248820.0/82.892.170.809.386.637/figure-typical-commercial-source-bubble-source-millard-source.webp)
CONCLUSION AND RECOMMENDATION
Conclusion
The test result shows slight reduction in CO2 loading capacity of regenerated sodium glycinate solution. This result indicates that aqueous sodium glycinate is suitable as absorbent for continuous acid gas removal system. In order to quantify the effect of CO2 loading on the physical properties of absorbent, the physical properties of CO2-loaded absorbent are measured.
Therefore, the density, kinematic viscosity, heat capacity, acidity, and conductivity of aqueous sodium glycinate after CO2 absorption are measured and reported in this present work. Several correlations have been proposed to quantify the CO2 loading effect to the physical properties of sodium glycinate as a function of the physical properties and absorption state of the unloaded solution. In general, CO2 loading increases the density and kinematic viscosity of aqueous sodium glycinate solution.
Heat capacity, acidity and conductivity of aqueous sodium glycinate solution are found to decrease with CO2 loading. Case study comparing absorber design of monoethanolamine and sodium glycinate is done to provide an overview of the overall performance of sodium glycinate in actual acid gas removal system compared to commercial absorbent, MEA. It is observed that the required solution flow rate for sodium glycinate absorber is slightly lower than MEA.
The result only serves as an estimation and there are other parameters that are required to be adapted to the design of the actual absorber, such as feed quality, other impurities present in the system, the stability of the solution system, etc.
Recommendation
Kinetics of carbon dioxide absorption in mixed aqueous solutions of 2-amino-2-methyl-1-propanol and piperazine. Process for removing carbon dioxide and/or hydrogen sulfide and other acid gases from gas mixtures. Gas Sweetening Data: Equilibrium Solubilities of Hydrogen Sulfide and Carbon Dioxide in Aqueous Monoethanolamine and Aqueous Diethanolamine Solutions.
Solubility of single gases Carbon dioxide and hydrogen sulfide in aqueous solutions of N-methyldiethanolamine in the temperature range 313−413 K at pressures up to 5 MPa, Solubility of hydrogen sulfide and carbon dioxide in a sulfinol solution, J.Chem. 2005) Absorption of carbon dioxide at high partial pressures in aqueous solutions of di-isopropanolamine, Ind.
Solubility of carbon dioxide in aqueous solutions of 2-Amino-2-methyl-1-propanol and N-methyldiethanolamine and their mixtures in the temperature range from 313 to 353 K and pressures up to 2.7 MPa. Correlation and prediction of carbon dioxide solubility in aqueous solutions of alkanolamines and mixed alkanolamines. Solubility of hydrogen sulfide and carbon dioxide in a solution of methyldiethanolamine mixed with ethylene glycol.
Comparative analysis of carbon dioxide absorption and recovery capacities in aqueous 2-(2- Aminoethylamino)ethanol (AEE) and mixtures of aqueous solutions of AEE and N-methyldiethanolamine. Heat of absorption of carbon dioxide (CO2) in monoethanolamine (MEA) and 2-(aminoethyl)ethanolamine (AEEA) solutions. Carbon dioxide solubility and density of aqueous solutions of sodium glycinate before and after CO2 absorption.
![Figure 1.1 World energy consumption for the year 2007 in Million tonnes oil equivalent (Source: BP Report, 2008 [1])](https://thumb-ap.123doks.com/thumbv2/azpdforg/10248820.0/15.892.264.690.691.996/figure-world-energy-consumption-million-equivalent-source-report.webp)
![Figure 2.4 Reaction scheme for carbon dioxide absorption into sodium glycinate [106]](https://thumb-ap.123doks.com/thumbv2/azpdforg/10248820.0/32.892.210.725.681.1052/figure-reaction-scheme-carbon-dioxide-absorption-sodium-glycinate.webp)