Furthermore, there are also limited studies on the awareness and component of sustainable smart city in Malaysia. Five (5) dimensions, seven (7) components and seventeen (17) sub-components of the sustainable smart city were discovered.
Introduction
Background of the Study
In a nutshell, a smart sustainable city is not only a city that has ICT technology, but also implements the technology in a way that will bring positive impacts to the local citizens and community.
Problem Statement
Based on previous smart city research, it is very clear that most of the research focused and tried to define the smart city concept. However, there are limited studies focused on the elements and components of the smart city and how it achieves sustainability.
Research Aim
According to Mora and Deakin (2019), many attempts have been made to define the concept of smart city, but they tend to mark each other, which makes it difficult to achieve a common understanding of what smart city entails. For example, Schaffers et al. 2012) described the smart city as a future scenario based on technology and improving people's lives.
Research Objectives
Alkandari, Alnasheet and Alshekhly (2012) conducted a smart city survey and concluded that smart city uses an intelligent network consisting of the interaction of resources, land, attitudes and cultures and then achieved through integration. In addition, there are also limited studies on the awareness and concept of smart sustainable city in Malaysia.
Research Methodology
Research Scope
Chapter Outline
Chapter Summary
To pave the way for this research, the research objective and research objectives were identified.
Introduction
Smart Sustainable City
- Definition of a Smart Sustainable City
- Approaches of Smart Sustainable City
- Benefits of Smart Sustainable City
- Dimension of Smart Sustainable City
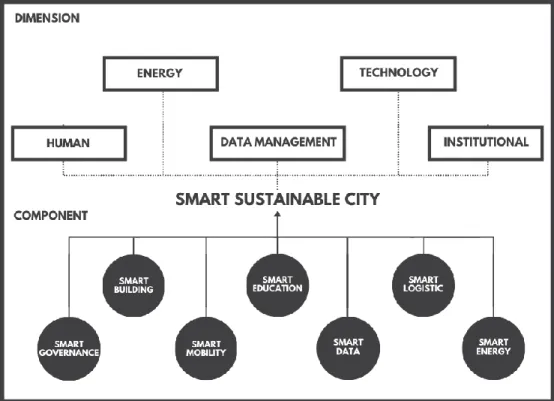
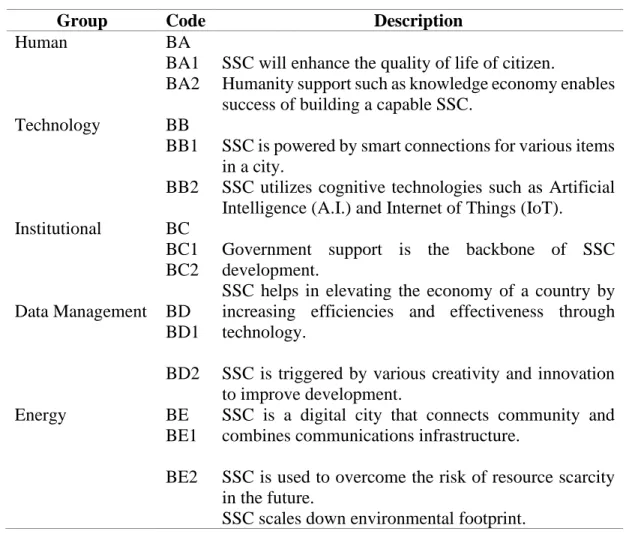
Sharifi (2019) distinguished that frameworks can be categorized into 5 (five) key dimensions that compromise different relevant categories of sustainable smart city development. Moving forward, Lindskog (2004) mentioned the institutional dimension must be present in order to promote the sustainable smart city.
Concept of Smart Sustainable City
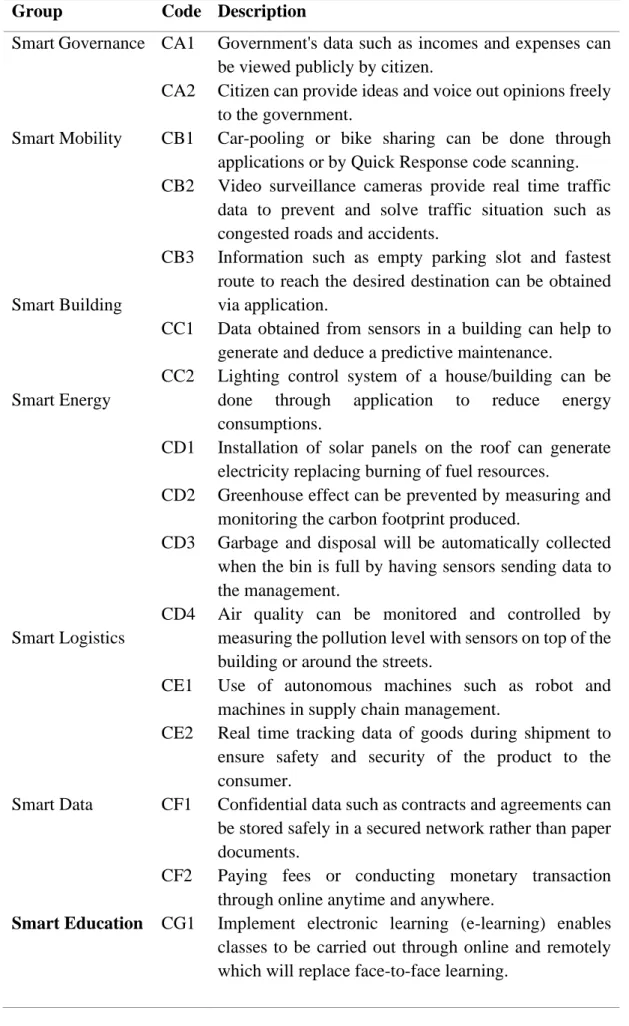
- Smart Governance
- Smart Mobility
- Smart Building
- Smart Energy
- Smart Data
- Smart Logistic
- Smart Education
Moreover, smart waste management is also part of the smart energy that improves the quality of life of citizens. In a nutshell, smart data provides convenience and empowers the quality of life of the people.
Smart Sustainable City Conceptual Framework
In addition, smart learning, also known as electronic learning (e-learning), plays an important role in promoting smart education. Smart learning includes new educational methods that focus on the importance of using technologies at hand (Morze and Glazunova, 2013). Smart learning is the future of higher education, providing flexibility for everyone, whether students or adults.
In smart education, all knowledge can be found on the Internet and thus offers the possibility of lifelong learning, since all knowledge is just one click away.
Chapter Summary
Introduction
Research Method
Quantitative Research Method
To continue, there are two key designs that build this research method, namely experiment research and survey research. Survey research includes longitudinal and cross-sectional studies based on widely used opinion surveys. On the other hand, experimental research that is not as commonly used compared to survey research because it is only conducted to identify a specific treatment that affects the result.
The larger sample makes it less likely that differences in the study group will unbiasedly affect the desired results.
Qualitative Research Method
Justification of Selection
Literature Review
At the same time, it is important to identify the research questions and to organize the literature around the topics of the questions into logical categories. The questions of the survey must be precise enough to serve as a reference to the relevant literature. All these summaries will be combined and included in the literature review of the study.
The literature review should conclude with a summary of key concepts and themes.
Quantitative Data Collection
Questionnaire Design
The reason for this is because the content and order of presentation will act as a guide that takes the respondent in the direction they wanted. If the content and arrangement of the questionnaire is messy and disorganized, the respondent would be confused about the purpose and goal of the questionnaire survey. A long questionnaire will make the respondent bored and distracted closer to the end of the survey and will not focus on answering the question.
What's worse is that the respondent may pause or stop at some point, realizing that there are still many questions that need to be answered.
Sampling Determination
Sarmah and Hazarika (2012) reported that probability sampling makes it possible to obtain survey data that is representative of the intended respondents of the study. The requirements stated that it is critical that the data to be collected is performed randomly in a sufficiently large population and that the target sample size should not exceed 10% of the population. In addition, the sample of the population must be authentic and independent to avoid the purity of the data collected.
For this study, a sample size of thirty (30) is determined for each of the construction practitioners who are Architect, Engineer, General Contractor and Quantity Surveyor.
Questionnaire Distribution
On the other hand, Islam (2018) mentioned that statistically, CLT can be applied in a sufficiently large sample, and the sample distribution of the mean for a variable should reflect a normal distribution, despite the large dispersion in the population. Brussolo (2018) stated that a pattern would appear when the sampling size was very large and too wide, and the mean and standard deviation of the sampling distribution would actually represent the mean and standard deviation of the normal distribution, therefore it provides efficiency and effectiveness in estimating and plotting characteristics population. Kwak and Kim (2017) found that a sample size of thirty (30) is adequate to reflect that the sample distribution is represented fairly normally when the population is symmetrical.
This will increase the quality of the response and comments received as the respondent is not pressured and stressed.
Data Analysis
Cronbach’s Alpha (α) Reliability Coefficient
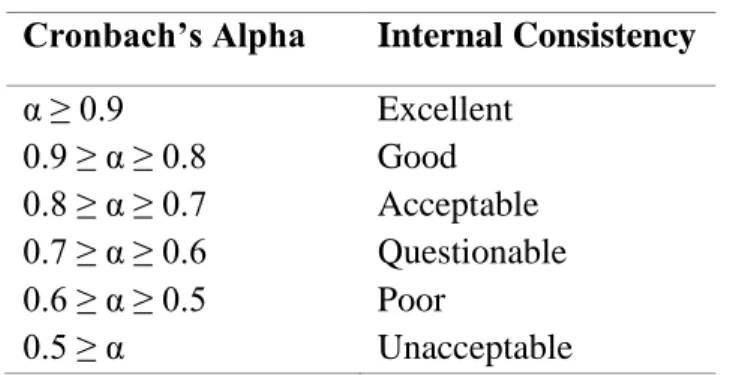
Bonett (2014) published that Cronbach's alpha reliability is used to measure the reliability or internal consistency of data. Taber (2017) said that Cronbach's alpha is considered a measure of scale reliability or a reliability coefficient and it is not a statistical test. In this research, Cronbach's alpha is used to determine the reliability of data for Section B and Section C, which is the awareness and importance of components of smart sustainable city.
The Cronbach's alpha is calculated by comparing the score of each scale of the Likert scale with the total score of each respondent.
Arithmetic Means
Kruskal-Wallis Test
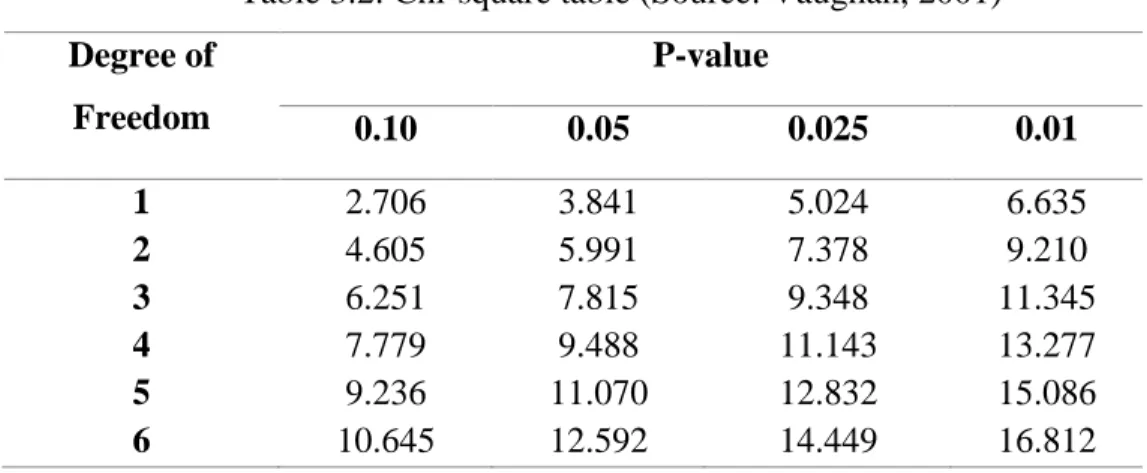
Vaughan (2001) mentioned that the calculated H-value is used to determine hypotheses by comparing the chi-square critical value. The null hypothesis (H0) cannot be rejected when the H-value is less than the critical chi-square. However, if the H-value is greater than the critical chi-square, the alternative hypothesis (H1) is accepted.
The critical chi-square value depends on the value of alpha and degrees of freedom, as shown in Table 3.2.
Introduction
In this chapter, the data collected and collected from the questionnaire survey will be detailed and discussed. Next, all the collected data will be analyzed using Cronbach's Alpha Reliability Test to identify and determine the reliability of the data obtained. Kruskal-Wallis test is performed as the last data analysis method to identify the significant difference of smart sustainable city components between the different groups of construction practitioners.
Finally, a conclusion is derived to summarize the result of the study and present the whole chapter.
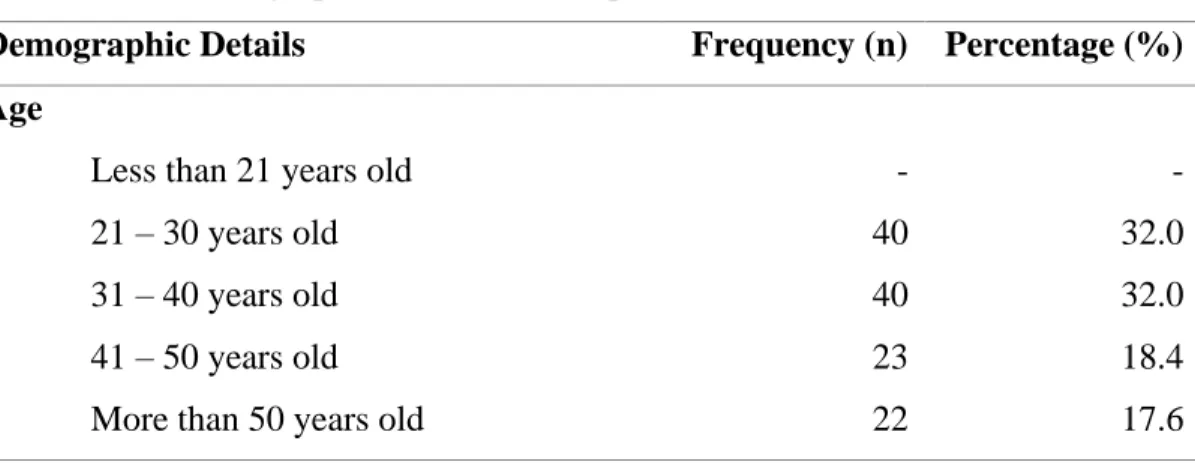
Demographic of Respondents
Moving on to work experience, it can be seen that most of the respondents had “less than 6 years” of work experience, while twenty-five (25) respondents had “6 – 10 years” of work experience. Before Table 4.1, the respondents were asked to rate the smart and sustainable situation of the current urban situation in Malaysia based on their personal opinion. The majority of respondents, 93.6%, pointed out that the current city is not considered smart and sustainable, while there are a few respondents, 6.4%, who are neutral about the current situation.
One hundred and one (101) of the respondents agreed that the city will be smart and sustainable in the future while only one (1) of the respondents felt that it is difficult for the city to become smart and sustainable.
Cronbach’s Alpha Reliability Test
Arithmetic Means of Smart Sustainable City
- Mean Ranking of Smart Sustainable City Awareness
- Mean Ranking of Smart Sustainable City Main Component
- Mean Ranking of Smart Sustainable City Sub-Component
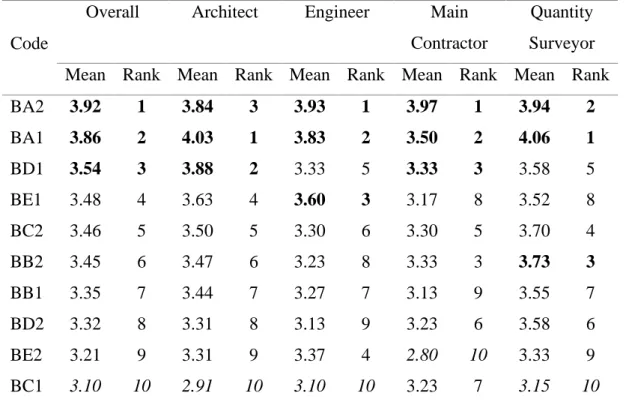
Therefore, all the collected data should be handled in a proper way to increase the smoothness of the smart sustainable city system. BA1 stated that a smart sustainable city will improve the quality of life of citizens and most of the respondents agreed with this. A minority of respondents agreed that government cooperation is essential in implementing a smart sustainable city.
Thus, the majority of respondents chose CB3 as the most important sub-component of the sustainable smart city.
Kruskal-Wallis Test
Referring to table 4.11, there is a significant difference between main contractor and quantity surveyor on the sub-component of CB3 = "Information such as empty parking space and fastest route to reach the desired destination can be obtained via application". The general contractor mean is 69.17, while the quantity surveyor mean score is 50.98. It can be inferred that the main contractor has higher level of agreement on the importance of CB3 compared to quantity surveyor.
While the general contractor on the other hand does not rely on autonomous machines as much as the quantity surveyor because the general contractor's sole focus is on construction progress.
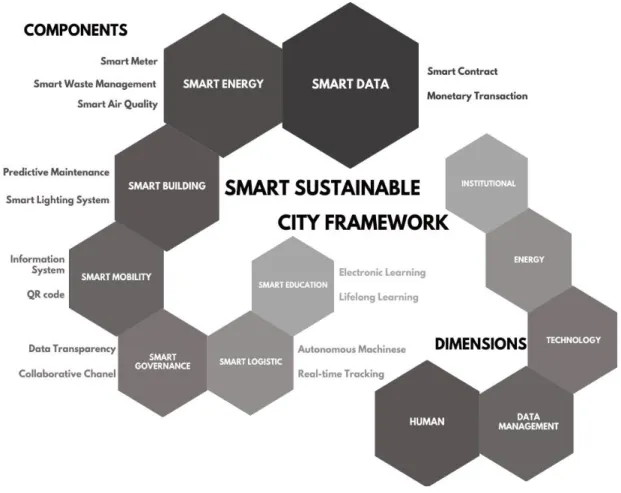
Refined Smart Sustainable City Framework
The quantity inspector thus relies heavily on the autonomous machines to produce all the required documents. In this chapter, the awareness and sub-components of a smart, sustainable city among construction workers have been thoroughly discussed. Further on, the components and sub-components of smart sustainable city were scaled and ranked based on.
Based on the results generated by the mean test, a modified and refined proposed smart sustainable city framework was shown.
Introduction
Accomplishment of Research Objectives
- Objective 1: To determine the awareness of smart sustainable city in Malaysia
- Objective 2: To identify the components of smart sustainable city in Malaysia
- Objective 3: To propose a smart sustainable city framework for Malaysia
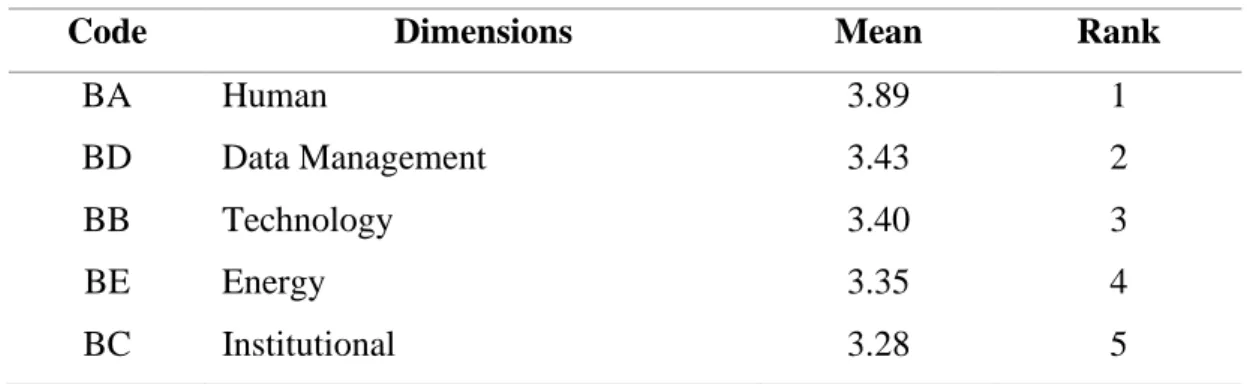
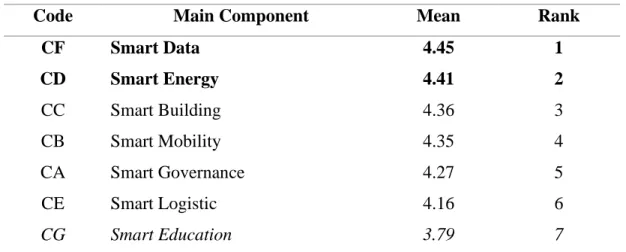
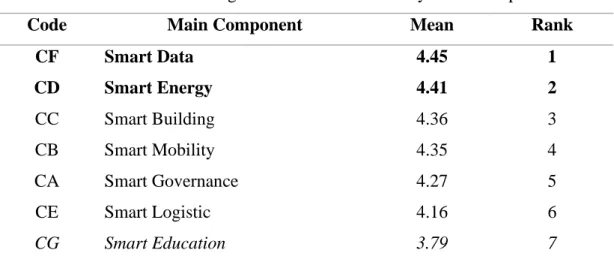
Based on Table 4.5, respondents are most aware of the human aspect in the sustainable smart city dimension among all other elements. The components of the sustainable smart city were ranked based on the mean score value. There are seven (7) main components of the sustainable smart city ranked based on the average value achieved by the arithmetic test.
In addition, the dimensions of smart sustainable city were evaluated by the respondents and the ranking of dimensions is done based on the average value calculated.
Research Limitations
After performing average ranking based on the data obtained from the respondents, a refined proposed smart sustainable city framework was depicted as shown in Figure 4.1. The human factor emerged as the top dimension voted by the respondents, which also depicted that the respondents realize the importance of human support in pursuing smart sustainable city. Nevertheless, institutional did not receive as many recognitions as human factor and therefore ranked last among all the dimensions.
Finally, the proposed framework for smart sustainable cities has not been verified by any professional party during the entire period of this study.
Research Recommendations
Research Contribution
Chapter Summary
A conceptual framework for aligning infrastructure assets with citizen demands within a smart cities framework. The Smart City Hospitality Framework: Creating a Foundation for Collaborative Reflections on Tourism Underpinning Destination Design. Urban monitoring lessons learned from resilient and sustainable cities to better address the smart cities initiative.
2018) Towards sustainable smart cities: an overview of trends, architectures, components and open challenges in smart cities.