THE IMPACT OF LIVE STREAMERS’ SOCIAL CAPITAL ON VIEWERS’ PURCHASE INTENTION
HONG KAI SONG
MASTER OF BUSINESS ADMINISTRATION
UNIVERSITI TUNKU ABDUL RAHMAN
FACULTY OF ACCOUNTANCY AND MANAGEMENT
DECEMBER 2022
The Impact of Live Streamers' Social Capital on Viewers' Purchase Intention
Hong Kai Song
A research project submitted in partial fulfillment of the requirement for the degree of
Master of Business Administration
Universiti Tunku Abdul Rahman Faculty of Accountancy and Management
December 2022
The Impact of Live Streamers' Social Capital on Viewers' Purchase Intention
By
Hong Kai Song
This research project is supervised by:
Corrinne Lee Mei Jyin Assistant Professor
Department of International Business
Faculty of Accountancy and Management
Copyright @ 2022
ALL RIGHTS RESERVED. No part of this paper may be reproduced, stored in a retrieval system, or transmitted in any form or by any means, graphic, electronic, mechanical, photocopying, recording, scanning, or otherwise, without the prior consent of the authors
DECLARATION I hereby declare that:
(1) This Research Project is the end result of my own work and that due acknowledgement has been given in the references to all sources of information be they printed, electronic, or personal.
(2) No portion of this research project has been submitted in support of any application for any other degree or qualification of this or any other university, or other institutes of learning.
(3) The word count of this research report is 12213.
Name of Student: Hong Kai Song Student ID: 21UKM02534
Signature:
Date: 6 December 2022
ACKNOWLEDGEMENT
First and foremost, I want to express my deepest appreciation to my MBA research project supervisor, Assistance Professor Dr.Corrinne Lee, for her guidance, wisdom, and support. I can't thank her enough for all of the helpful suggestions she gave me throughout my study.
Next, I'd want to express my gratitude to everyone who has encouraged me to obtain an MBA at Universiti Tunku Abdul Rahman (UTAR). Their
constant motivation and spiritual support has given me the fortitude to finish my MBA while continuing to work full-time.
Last but not least, I would want to thank each and every one of my MBA lecturers.
Gaining insight and information from you that I can use in my professional life has been a rewarding experience.
ABSTRACT
In 2020, the Covid-19 pandemic causes dramatic shifts in almost all industries, most notably the internet realm. Fewer people visit the business in person because they are urged to shop online instead. Customers are distancing themselves from traditional brick-and-mortar establishments. Because of this reality, most
companies are shifting their focus to live streaming. Live streaming allows for two-way communication between the live streamers and the viewers, which improves the viewers knowledge of the product and boost viewers purchase intention. Why do viewers put their faith in anonymous and unproven live
streamers from internet? This study examined the impact of live streamers' social capital on viewers' purchase intention in order to better understand this
phenomena. The results demonstrated that the the live streamer's social capital which professionalism, trust and reciprocity all contributed to in the viewer's purchase intention.
TABLE OF CONTENTS
Copyright @ 2022 ... IV DECLARATION ... V ACKNOWLEDGEMENT ... VI ABSTRACT ... VII TABLE OF CONTENTS ... VIII LIST OF TABLES ... XI LIST OF FIGURES ... XII LIST OF ABBREVIATIONS ... XIII
Chapter 1 INTRODUCTION ...1
1.1 Research Background ...1
1.2 Problem Statement ...4
1.3 Research Questions ...4
1.4 Research Objective ...5
1.5 Significant of Study ...5
Chapter 2 LITERATURE REVIEW ...6
2.1 Social Capital ...6
2.2 Purchase Intention ...8
2.3 Structural Capital ...9
2.4 Cognitive Capital ... 10
2.5 Relational Capital ... 11
2.6 Online Involvement ... 12
2.7 Conceptual Framework ... 13
Chapter 3 RESEARCH METHOD ... 14
3.1 Research Design ... 14
3.2 Data Collection Method ... 14
3.3 Sampling Design ... 15
3.4 Research Instruments ... 16
3.4.1 Self-Administrative Survey ... 16
3.4.2 Questionnaire Design ... 16
3.4.3 Pilot Test ... 17
3.5 Construct Measurement ... 18
3.6 Data Processing ... 20
3.7 Common Method Bias ... 21
3.8 Data Analysis ... 21
3.8.1 Descriptive Analysis ... 21
3.8.2 Inferential Analysis ... 22
3.8.3 Reliability Analysis ... 22
Chapter 4 RESEARCH RESULTS ... 23
4.1 Descriptive Analysis ... 23
4.1.1 General information ... 23
4.1.1.1 Gender ... 25
4.1.1.2 Age ... 25
4.1.1.3 Race ... 26
4.1.1.4 Location ... 27
4.1.1.5 Education level ... 27
4.1.1.6 Employment Status ... 28
4.1.1.7 Individual Income Level ... 29
4.1.1.8 Household Income Level ... 30
4.1.1.9 Live Streaming Shopping Purchase Frequency (Times Per Month) ... 31
4.2 Inferential Analysis ... 32
4.2.1 Reliability Test ... 32
4.2.2 Pearson’s Correlation Analysis ... 33
4.2.3 Relationship between Variables ... 34
4.2.3.1 Moderating Effect of ONL Towards SI & PI ... 34
4.2.3.2 Moderating Effect of OI Towards POP & PI ... 35
4.2.3.3 Moderating Effect of ONL Towards SL & PI ... 36
4.2.3.4 Moderating Effect of OI Towards PRO & PI... 37
4.2.3.5 Moderating Effect of OI Towards TRU & PI ... 40
4.2.3.6 Moderating Effect of ONL Towards REC & PI ... 41
4.3 Hypotheses Testing ... 45
Chapter 5 DISCUSSION AND CONCLUSION ... 46
5.1 Discussion ... 46
5.2 Implication ... 49
5.3 Limitation and Future Research... 50
5.4 Conclusion ... 51 REFERENCES ... 52 APPENDIX ... 57
LIST OF TABLES
Table 3.1: Reliability Test... 17
Table 3.2: Construct of Measurement ... 18
Table 3.3: Cronbach’s Strength of Reliability ... 22
Table 4.1: Summary of Respondents ... 24
Table 4.2: Reliability Test... 32
Table 4.3: Pearson’s Correlation Analysis... 33
Table 4.4: Coefficient ... 34
Table 4.5: Moderating Effect of OI Towards SI & PI ... 35
Table 4.6: Moderating Effect of ONL Towards POP & PI ... 36
Table 4.7: Moderating Effect of ONL Towards SHA & PI ... 36
Table 4.8: Moderating Effect of OI Towards PRO & PI ... 37
Table 4.9: Conditional Effects of Professionalism At Values of Online Involvement ... 38
Table 4.10: Online involvement value defining Johnson-Neyman significance region ... 39
Table 4.11: Moderating Effect of OI Towards TRU & PI ... 40
Table 4.12: Moderating Effect of OI Towards REC & PI ... 41
Table 4.13: Conditional Effects of Professionalism At Values of Online Involvement ... 42
Table 4.14: Online involvement value defining Johnson-Neyman significance region ... 43
Table 4.15: Test of Significant ... 45
LIST OF FIGURES
Figure 2.1: Conceptual Framework ... 13
Figure 4.1: Gender of Respondents ... 25
Figure 4.2: Age of Respondents ... 26
Figure 4.3: Race of Respondents ... 26
Figure 4.4: Location of Respondents ... 27
Figure 4.5: Education level of Respondents ... 28
Figure 4.6: Employment Status of Respondents ... 29
Figure 4.7: Individual Income Level of Respondents ... 30
Figure 4.8: Household Income Level of Respondents ... 31
Figure 4.9: Live Streaming Purchase Frequency (Times / Month) of Respondents32 Figure 4.10: Moderating effect of Online Involvement on the relationship between professionalism and viewers purchase intention ... 40
Figure 4.11: Moderating effect of Online Involvement on the relationship between reciprocity and viewers purchase intention... 44
LIST OF ABBREVIATIONS
MBA Master of Business Administration
PI Purchase Intention
SI Social Interaction
POP Popularity
SL Shared Language
PRO Professionalism
TRU Trust
REC Reciprocity
OI Online Involvement
Chapter 1
Introduction
This chapter provides an overview on the impact of live streamers' social capital on viewers' purchase intention. The chapter will begin with an overview of the study's background, then go on to the problem statement, research questions and objectives. At the conclusion of this this chapter will discuss about the significant of study of the research.
1.1 Research Background
In 2020, the Covid-19 pandemic causes dramatic shifts in almost all industries, most notably the internet realm. Fewer people visit the business in person because they are urged to shop online instead. As a result, consumers are increasingly turning to the internet to stock up on necessities like food, clothing, and household supplies. Customers are distancing themselves from traditional brick-and-mortar establishments. Because of this reality, most companies are shifting their focus to live streaming. Recent research (Mastercard, 2020) has shown that a majority of consumers 74% are increasing their expenditure on internet purchases. Because of the epidemic, people's shopping and selling habits have changed.
According to Chanrit (2021) estimation that 47% of viewers of live streaming are spending more time on live streaming than ever before. There has been a recent
uptick in the number viewers making their purchases through live streaming. Thus, competition in live streaming platform is heating up, yet opportunities abound.
The business landscape is shifting across the world. Live streaming and live selling are the most well-liked developments nowadays. In today's ever-evolving social commerce landscape, most online stores recognize that consumer interaction is of utmost importance.
With raising of live streaming, customers may experience e-commerce as closely as possible to the in-store purchasing experience. Live streaming is the newest and most dynamic method for companies to communicate with stakeholders, just how Zoom has made meetings virtual. Brands are avidly seeking for new methods to communicate with their customers as the popularity of digital channels and social media continues to rise and people spend more and more time on these platforms.
Customers' undivided attention and active participation in a live streaming makes it an ideal medium for two-way communication. When viewers add comments in real time during a live streaming, it turns the presentation into a two-way conversation with the audience. The ability to reach a large audience, improved presentation, rich content, several platforms, and enhanced contact with the target market are all benefits of online gushing. By 2021, the live streaming market is projected to be worth $70.5 billion (Rajasekar & Aithal, 2022). Live streaming is favoured by many consumers because they believe it provides a more open and transparent relationship with companies and influencers than other digital platforms. They get to try the product out for themselves, witness the brand speakers in action, and learn about the product's advantages firsthand. Live streaming retail has to improve customer service, usability, and interaction to boost loyalty and sales (Chen, 2019).
Using the concept of social capital theory, we seek to give concrete form to the one-to-many connection in live streaming platforms. An area's ties among its residents are the unseen source of its social capital. Recent studies on the topic of social capital show that it may be used in a wide variety of contexts, from government and citizens (Myeong & Seo, 2016), to entrepreneurial enterprise (Wang, Li, & Ma, 2019), to social networking sites (Zhao, Huang & Su, 2019).
Using the framework of social capital theory, this research explores the dynamics
between a live streamer and their viewers. In live streaming, the live streamer serves as a link between the products and its customers. Viewers are influenced by the streamer's reputation and the feedback they hear about the product. According to two separate studies (Ang et al., 2018; Wongkitrungrueng et al., 2020), a streamer's positive reputation may inspire viewers to make a purchase after seeing them use a product they saw them use during a live broadcast.
Live streaming are accessible over the Internet and may be accessed on desktop computers, laptops, tablets, and smartphones. According to Zhao et. al. (2019), the primary characteristics of mobile internet are portability, accessibility, convenience, and portability. The Internet has several benefits, including its portability, accessibility, and two-way communication. Unlike other channels, Live streaming platforms allow for instantaneous bidirectional dialogue between streamers and viewers, who may then quickly share and discuss their thoughts with one another. Conversations between streamers, viewers, and other viewers are mediated by the mechanisms through which they communicate with one another. In the first place, a live streaming platforms convenient, portable, customization, and easily accessible features enable viewers locate remarkable, instructive, and useful streams. Positive feelings may be created between a streamer and their viewers when they interact with one another. When people have a common interest in a streamer's material, they are more likely to interact with one other, learn about issues that matter to them, and establish social networks as a result.
The purpose of this research is to apply the concepts of social capital theory to the realm of live streaming in order to better understand the influence of the streamer's social capital on the viewer's purchase intention, as well as the role that the streamer's sales model and social influence play in the consumer purchase process. Empirical testing of this model is then performed by collecting survey data from viewers engaged in live streaming purchases and analyzing it in light of the social capital theory to determine the effect of social capital on viewers purchase intentions. Finally, we explore how the empirical findings may aid in the expansion of social capital theory, and we learn more about how the streamer's social capital might boost viewers' intention to buy.
1.2 Problem Statement
As post-lockdown of Covid-19, streaming audiences shrink across the board.
According to Ethan (2022) most recent research, growth across all platforms has slowed when compared to the same period last year. Streaming volumes have increased and decreased respectively because to the Covid-19 pandemic.
Streaming viewership rose as more individuals started working from home and thus spent less time engaging in outside leisure activities. But, as the globe once again opened up, viewership has begun to fall. Although the industry's rapid growth over the last decade indicates it has enormous promise for advancing people's professional lives. It's easy to lose sight of emerging markets like live streaming as post-lockdown of Covid-19, the questions and problems are how live streamers remain competitive in this industry to competitive as post-lockdown of Covid-19. Streamers who want to be successful will need to experiment to find a method that works for them and then stick to it. A live streamer's long-term objective can be to increase the visibility of their channel throughout the whole streaming platform. a successful streamer will development a high degree of social capital that they will be reliable, and will have figured out what their viewers wants to keep them even post-lockdown of Covid-19. Post-lockdown of Covid-19 might lead to reduced purchase intention if you fail to establish your own brand in a manner that correctly matches the viewers. Since this is the case, it is essential that the significance of streamer' social capital and the formation of social capital based on it be investigated and emphasized. So, let's talk about why we're doing this research.
1.3 Research Questions
Research questions raised at the beginning of a challenge are essential for getting a handle on the material and locating the relevant data later on. The following are the three questions that have been developed for further study:
RQ1: Does streamers structural capital has a positive direct effect on the viewers purchase intention?
RQ2: Does streamers cognitive capital has a positive direct effect on the viewers purchase intention?
RQ3: Does streamers relational capital has a positive direct effect on the viewers purchase intention?
1.4 Research Objective
The study's main goal is to identify the key factors that impact viewers' intentions to make purchases in streaming. The other goals are as follows:
RO1: To examine the relationship between structural capital and viewers purchase intention.
RO2: To examine the relationship between cognitive capital and viewers purchase intention.
RO3: To examine the relationship between relational capital and viewers purchase intention.
1.5 Significant of Study
Marketers may use the study's findings to their advantage by better understanding the impact of live streamers' social capital on viewers' purchase intention.
Marketers may then use this information to better position their products for the target audience and increase sales. As a result, marketers may better anticipate the viewers preferences of streamers if they have a deeper grasp in live streaming.
Thus, revenues might rise if the company successfully caters to viewers expectations for streaming despite of post-lockdown of Covid-19. Future scholars have a lot to learn from this study, therefore it will serve as a useful resource for them as well. In addition, this study can aid future researchers in gathering more data and gaining a better understanding of whether the live streamers' social capital impact viewers' purchase intention.
Chapter 2
Literature Review
This chapter covers the relevant literature of social capital, online involvement and viewers purchase intention. The chapter will begin with the concept of social capital and the three core dimensions of social capital, which includes structural capital, cognitive capital and relational capital. Next, the concept of online involvement and viewer purchase intention will be discussed, followed by a review of the relevant models of social capital, online involvement and viewer purchase intention. Theoretical frameworks from the past are also discussed in this chapter. Together with the research hypotheses, a conceptual framework will be created. As a conclusion, this chapter will conduct an empirical assessment of the connection between social capital, online involvement, and viewers' purchase intention.
2.1 Social Capital
Nahapiet and Ghoshal (1998) stated that the concept of "social capital"
encompasses a variety of factors, including strong interpersonal connections (structural capital), the capacity to comprehend and apply new information (cognitive capital), and a variety of other desirable traits (relational capital). Each of these types of social capital is a part of the social structure and helps to facilitate the flow of information within it. To put it another way, social capital is a measure of the value of the resources contained inside a person's web of social
connections. It's built into communities and may make it easier to trade goods and services. Based on Benton (2016) favorable resources may be obtained via a network of people who were both diverse and well-informed. Technology transfer (Grzegorczyk, 2019), employee performance and satisfaction (Sheer & Rice, 2017), contract length (Ravindran, Susarla, Mani & Gurbaxani, 2015), information disclosure (Chen & Beaudoin, 2016), electronic word-of-mouth and online purchasing (Horng & Wu, 2020), information sharing and knowledge exchange (Lee, Tsang & Pan, 2015), user-generated content popularity (Yang &
Li, 2016), and crowdfunding (Zheng, Li, Wu & Xu, 2014) may all benefit from these resources.
According to the standard definition, social capital refers to "resources entrenched in the social structure that may be approach or deployed in meaningful acts". A number of pro-social behaviors, including as collaborative action, community involvement, and differential social accomplishment, which are built on unaccountable personal wealth, have been explained in terms of social capital.
The social context of social capital is an important distinguishing feature from other types of capital. It is generally agreed that social capital is two-fold, reflecting both the collective emotional climate and the quality of interpersonal connections as well as the individual incentives and opportunities afforded by one's social networks. From the standpoint of an individual, one's social capital consists of their standing and identity within their social network. A person's true aspirations are heavily influenced by the roles and identities they have in society (Putnam, 1995).
There are three components to social capital: structural capital, cognitive capital, relational capital (Nahapiet & Ghoshal, 1998). Social interaction is one manifestation of structural capital, which relates to the structure of actors' relationships. Data and assets that are rooted on interpersonal relationships may be accessed via social network linkages, and players in crucial positions within the social network, such as those holding the position of a structural hole, are given preferential access to these resources (Chang & Chuang, 2011). Shared language is a manifestation of cognitive capital because it represents the resources that allow participants to work together toward a common goal and follow a set of
agreed-upon standards (Nahapiet & Ghoshal, 1998). Relational is indicative of the trust and norm of reciprocity in a relationship. Individuals' prior contacts with one another may foster relational capital (Tsai & Ghoshal, 2008).
2.2 Purchase Intention
Purchase intention is the phenomenon where a customer wants to buy a product but does not necessarily make the purchase (Jayesh, 2015). This is similar to the argument made by Morwitz (2014), who claims that the desire to make a purchase is distinct from the actual conduct of making a buy. Consideration of societal, emotional, logical, ethical, psychological, and economic variables is essential since they may affect purchase intentions (Renu, 2020). The likelihood of a customer making a purchase when shopping online is a major factor in their actions while doing so.
The term "purchase intention" according to Hajli et. al. (2017) refers to the stage of negotiations between a buyer and seller before the latter finally accepts a sale from the former. A customer has a purchase intention if they go into a store with the mindset that they will buy the product or service because they are looking for a certain feature or advantage, or if they have an overall favourable impression of the product or service. As described by the authors of this research, "Consumers' readiness to buy a product or service from a specific website" captures the essence of what it means to make a purchase decision in this context. Once a customer has decided on a product, however, their intentions will determine whether or not they go through with the purchase (Raza et. al., 2014). The decision to buy a product begins with a thorough examination of the product. Individuals draw on their own prior experiences, new learning, and other sources of data to construct their assessments (Bukhari et al. 2013). Consequently, customers' opinions are heavily influenced by extraneous circumstances, which in turn affects their propensity to make a purchase. The decision to buy is influenced by a wide variety of circumstances.
2.3 Structural Capital
Structural capital is an essential predictor of collective behaviour because it is a link in a network that is formed via human contacts. The greater the density of a social network, the more probable it is that its members will engage in coordinated efforts and share knowledge and resources (Marwell & Oliver, 1988).
Social interaction is an example of structural capital, which represents the structure of the actors' relationships. The sharing of knowledge and resources may be aided through social contact. One of the most important factors influencing customer purchasing decisions is social interaction (Xiang, Zheng, Lee & Zhao, 2016). Based on Li, Yang, Xu, and Zhu (2017), structured capital has a direct impact on the purchasing decisions of consumers. Because streamers in the social network's highest reaches are able to use personal connections to get specialized resources and knowledge, consumers who engage more in social interaction are able to receive adequate production suggestions more quickly. Customers who get these product suggestions may be more likely to buy streaming services in the future, which in turn may lead to increased revenue.
H1: Live streamer’s social interaction has a positive direct impact on viewers purchase intention
An individual streamer's level of popularity inside a network is used to measure the network's structural capital, which is expressed as the number of viewers linked to the streamer. As a result, a streamer's structural position in online streaming is expressed in the amount of viewers they have. As evidenced by the reality that celebrities, politicians, and other influential people with a strong social impact have used live streaming platforms to promote things for sale, the amount of viewers represents its popularity, it serves as a link to encourage people to buy the goods.(Park & Yang, 2010).
H2: Live streamer’s popularity has a positive direct impact on viewers purchase intention
2.4 Cognitive Capital
Cognitive capital is defined as the resources that allow knowledge to have a common interpretation in the community (Taegoo et al., 2013). Knowledge sharing is only effective if both sides have some common ground to work from, such as a common language and norms. Cognitive capital grows in parallel with the amount of time they spend collaborating with others on the acquisition of common or shared learning objectives and engaging in professional discourse.
Professional knowledge and the ability to put that knowledge into practise are both components of what economists call "cognitive capital." The live streamer has an expansive role in the viewers experience in live streaming, from assisting with product research and selection to demonstrating how to interact with the viewers. Viewers report a much increased feeling of experience and happiness as a result of the complete spectrum of internet merchandising promotion being linked to consuming scenarios of offline physical locations (Lin et. al., 2021).
Cognitive capital is a measure of the resources that allow parties to work together toward a common objective and establish a common set of norms via the use of shared language (Nahapiet & Ghoshal, 1998). In live streaming, viewers purchase intentions are influenced by their ability to communicate in a shared language. In the first place, the use of a shared language may help people understand one other better and minimize their cognitive barriers (Ganguly, Talukdar, & Chatterjee, 2019). It was easier for people to make future purchases when they were able to communicate clearly about their shopping experiences and product recommendations with the online streamers who had high levels of cognitive capital.
H3: Live streamer’s shared language has a positive direct impact on viewers purchase intention
The streamer's "professionalism" is evident in his or her thorough and exhaustive presentation of the goods. In a short amount of time, the streamer explains how the product works and how to use it, saving customers both time and money. The streamer takes on the role of shopper's guide during the online streaming.
Customer experience and happiness have been substantially enhanced as the
complete spectrum of online goods marketing has been matched to offline consumption circumstances in physical stores. As a result, viewers' desire to purchase is increased when streamers with greater levels of professional (Lin et.
al., 2021).
H4: Live streamer’s professionalism has a positive direct impact on viewers purchase intention
2.5 Relational Capital
When talk about relational capital, it referring to the strength of a group's emotional ties. It is easier for members to trust one other, think they must engage in the group, and identify and adhere to the group's cooperative rules when they have a solid sense of group identity. Finally, relationship capital is created (Lewicki & Bunker, 1996).
As a result, the streamer focuses more on the viewer's feeling of duty and moral obligation throughout the online streaming and often uses the promise-making method to help the online streaming viewer better grasp the product and have better trust on the streamers. Viewer’s purchasing intentions are influenced by their trust in an online marketing scenario (Cheng, Gu & Sheng, 2019).
H5: Live streamer’s trust has a positive direct impact on viewers purchase intention
The term "reciprocity" is used to describe an attitude of justice in the sharing of resources. For resource trade to be mutually beneficial, there must be a strong feeling of reciprocity (Chiu, Hsu & Wang, 2006). Individuals' actions may be affected by the quality of their connections, which may be represented by the concept of reciprocity in the context of internet marketing. In the first place, relational capital may be seen as a kind of governance that lessens the amount of unknowns and perceived dangers in entwined connections. More specifically, relational capital may lessen opportunism and inconsistency in social interactions while simultaneously increasing commitment to such connections (Chen, Huang
& Davidson, 2017). In addition, a high amount of relational capital between two
people makes them more likely to share resources, which in turn increases shoppers' propensity to make a purchase (Cheng, Gu & Sheng, 2019).
H6: Live streamer’s reciprocity has a positive direct impact on viewers purchase intention
2.6 Online Involvement
How often and for what kinds of things you shop online depends on how much time you spend on the internet. When a viewers core beliefs and values are inextricably linked to a certain product category online, that viewer becomes actively invested in that category. High-involvement states occur when viewers realize a product has significant personal value, and high-involvement states motivate viewers to seek out online information about the product, as well as to carefully weigh and compare the merits of various brands, products, and prices before settling on the best option (Ballon, Van Hoed & Schuurman, 2018). In contrast, a lack of engagement makes viewers less active in their pursuit of information online and more likely to utilize indirect routes to process what they find, including being more likely to be swayed by advertisements and more likely to alter their previous plans to buy (Jimenez, San-Martin & Puente, 2019).Thus, social capital and viewers purchase intention hypothesis can be form followed by:
H7: Moderated mediating role of online involvement on social interaction to viewers purchase intention.
H8: Moderated mediating role of online involvement on popularity to viewers purchase intention.
H9: Moderated mediating role of online involvement on share language to viewers purchase intention.
H10: Moderated mediating role of online involvement on professionalism to viewers purchase intention.
H11: Moderated mediating role of online involvement on trust to viewers purchase intention.
H12: Moderated mediating role of online involvement on reciprocity to viewers purchase intention.
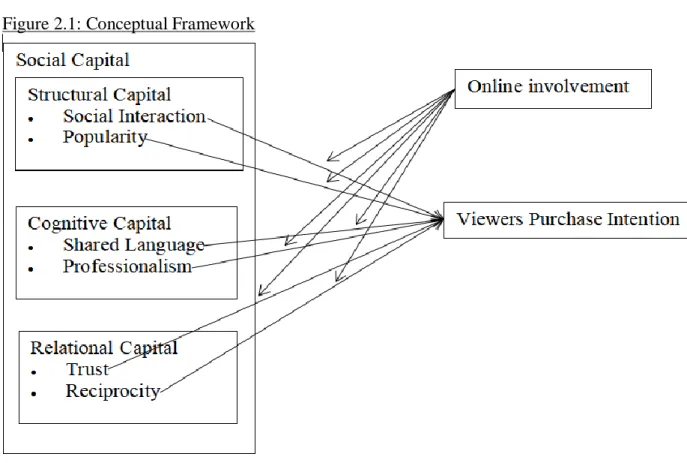
2.7 Conceptual Framework Figure 2.1: Conceptual Framework
Source: Self-Develop
Figure 2.1 depicts the conceptual model. Though Nahapiet and Ghoshal's (1998) model emphasizes group-level elements of social capital, social capital may also explain the viewers' purchase intention connect in live streaming e-commerce, according to study. In order to better connect the people and groups that engage in live streaming’ connection and sales relationship, live streaming is being brought to the medium through technological platforms. To a large extent, the success of live streaming depends on the confidence that viewers have in the streamer's conduct as a result of the streamer's personal connections. The streamer's individual degree of social interaction and popularity is assessed by structural capital. While doing so, it assesses the influence of the streamer's cognitive capital and the viewers' impression of relational capital on the viewers' desire to make a purchase while watching the stream. Besides, the framework examines how online involvement moderate social capital towards viewers purchase intention.
Chapter 3
Research Method
This chapter will detail the research method employed by the author. Research instruments, construct measurements, pilot tests, data processing, and analyses are all discussed in this chapter. The primary goal of this section is to guarantee that all appropriate research methods were used throughout the duration of the study.
3.1 Research Design
The process of conducting a study is guided by the research design created for that purpose (Celsi et al., 2011). Williams (2007) stated that research conducted using a quantitative methodology include not only the quantification of data, but also the acquisition of numerical data for further analysis using mathematical models.
3.2 Data Collection Method
Taking measurements and collecting data are two aspects of data collection. In order to answer research questions, verify hypotheses, and assess results. This study makes use of primary data, collected in the form of completed questionnaires, to draw conclusions (Saunders, 2014)
Researchers collect primary data, often known as "raw data," from a statistically valid and reliable sample of the population (Sekaran & Bougie, 2019). To investigate the impact of live streamers' social capital on viewers' purchase intention, a questionnaire-based research methodology was chosen for this study.
This is because it is a more time- and cost-effective strategy for gathering and processing data.
3.3 Sampling Design
A sampling design should specify a sample, a sampling method, and a sample size (Celsi et al., 2011). Researchers will first choose who they want to reach and then where they want to go to do it. After that, we'll talk about how we'll be selecting our samples and how many of them we'll take. A research project's target population consists of all the things or parts of the population in whom the researchers have an interest. The chosen group will be significant because they possess the data that the researchers want for a certain study study (Celsi et al., 2011).
In this research, we use a convenience sample. To choose examples from a population when doing so is practical for the researcher; this is the idea behind convenience sampling, a non-probability sampling technique (Sekaran & Bougie, 2019). According to Zikmud (2010) unlike probability sampling, these approaches do not call for a certain sample frame and are more flexible since they do not impose a prohibition against non-probability sampling. In fact, when studying consumer behaviour, convenience sampling is the method of choice.
The sample size of a study is the predetermined number of components that will be used in that research. In most cases, a sample size between 30 and 300 people is suggested by Sekaran and Bougie (2019). As a result, 30 to 300 prospective respondent participants have been suggested for this study's sample size. That is to say, in order to accomplish the study's aims. The accuracy and validity of a questionnaire may be tested via a pilot test, which is a smaller version of the full
survey used as a preliminary test. Before sending out questionnaires to participants, we ran a pilot test with 30 sets of questionnaire.
3.4 Research Instruments
Information about the survey's self-administration, questionnaire design, and pilot test are presented here.
3.4.1 Self-Administrative Survey
Self-administered surveys, According to Burns and Bush (2006), provide for more freedom in terms of sample size and flow of data collection. Data for this study was gathered by MS Team Form and questionnaires filled out by the respondents themselves. Electronic data collection is also used in the study process. Chua (2012) argues that questionnaires filled out by the study's participants themselves were the most appropriate methods for gathering the necessary quantitative data.
The use of a questionnaire makes it simple for the intended respondents to submit feedback in a short amount of time. Since the cost per response to a questionnaire is often rather minimal, this is a major advantage. In addition, there is no need to schedule an interview time for either the researchers or the respondents when using a self-administered questionnaire. The questionnaires are also made available online, making it easier for respondents to take part. Additionally, employing digitally stored data allows researchers to gather and evaluate the data more quickly.
3.4.2 Questionnaire Design
In this research, we use multiple-choice and likert-scale questions to ask participants closed-ended questions. In addition, respondents spend less time on the predetermined set of surveys since close-ended questions only need quick answers (Saunders, 2014). This makes it simpler to draw conclusions from the
data. Each questionnaire began with a cover page that provided context for the study and introduced the topic. The questionnaires include two parts: Section A (Demographic) and Section B (Constructs Measurement)
Respondents' demographic information (such as age, gender, race, state of origin, education level, employment status, monthly personal income, monthly household income, number of hours spent watching live stream in weekly and live streaming shopping purchase frequency in monthly basis) will be gathered in Section A.
Researchers may learn more about the demographic make-up of the sample population by asking the appropriate questions.
Questions in Section B are intended to probe every factor that impact of live streamers' social capital on viewers' purchase intention. To facilitate responses, the following Likert-scale questions have been included in this section;
respondents should indicate their answers with each question by selecting one of the following options from the scale: 1 = strongly disagree, 2 = disagree, 3 = neutral, 4 = agree, and 5 = strongly agree.
3.4.3 Pilot Test
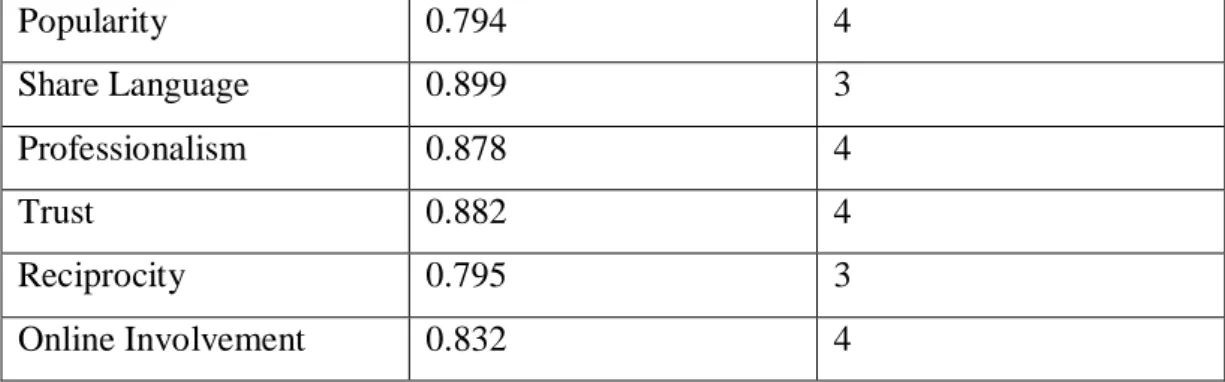
A pilot study is a small-scale research project used for validating and reliability testing a questionnaire before administering it to a larger sample of people (Saunders, 2014). Therefore, researchers should do a test run with a small sample size before releasing questionnaires to the general public. Thus, a pilot study is conducted with 30 Malaysian respondents. Results from this pilot test will help the researcher reduce survey errors and enhance the instrument's quality. The reliability of the scale was calculated using SPSS and Cronbach's alpha. The output is seen below:
Table 3.1: Reliability Test
Variables Cronbach’s α Number of items
Purchase Intention 0.923 4
Social Interaction 0.832 4
Popularity 0.794 4
Share Language 0.899 3
Professionalism 0.878 4
Trust 0.882 4
Reciprocity 0.795 3
Online Involvement 0.832 4
Source: Self-Develop
3.5 Construct Measurement
A survey questionnaire is a method for gathering information for a study. Part A and Part B make up the whole of the questionnaire used in this study. The nominal scale has been used in Part A. Ordinarily, one uses a nominal scale to assign numerical values to the various classes of a variable. Nominal scales are used to create questions on the respondents' demographics. Section A of the questionnaire deals with the respondents' demographic information, and the researchers are using an ordinal scale to create the questions. Finally, in Section B, we use an interval scale to evaluate respondents' perspectives.
Table 3.2: Construct of Measurement
Variable Item Adapted from
(cronbach alpha) Social
Interaction
The live streamer shows his enthusiasm to me
The live streamer shows his care for me
If I ask questions, the live streamer will always answer them positively
My attention is always drawn to the products when the live streamer abruptly changes the volume
Zhong et. al.,
2022 (CA=
0.730)
Professionalism The live streamer knows his recommended products well
The live streamer has enough experience (e.g. working experience, trial experience) to judge the products he recommends
Zhong et. al.,
2022 (CA=
0.827)
The live streamer’s introduction of the product provides me with a complete understanding of it
The live streamer only recommends the products after doing his research
Trust The information provided by the live streamer is authentic with the actual condition of the products
The live streamer is responsible for the products he promotes
The live streamer has earned my trust based on the knowledge I have of him from different online platforms
The platform where the live streamer does his job, makes me feel that he is a trustworthy anchor
Zhong et. al.,
2022 (CA=
0.871)
Purchase intention
I would recommend others to buy the products promoted by the live streamer
I think the product recommended by the live streamer is worth purchasing
I want to buy the product that the live streamer recommends
When I need any products, I will consider buying them from the live streamer
Zhong et. al.,
2022 (CA=
0.832)
Popularity The live streamer is famous
The live streamer has a large number of followers
The popularity of the live streamer is growing
My favorite live streamer receives a lot of comments while streaming
Ladhari et. al., 2022 (CA=
0.782)
Share language The live streamer uses common terms or jargons
The live streamer uses understandable communication pattern during streaming.
The live streamer uses understandable narrative forms to post messages during streaming
Chiu et. al.,
2006 (CA=
0.840)
Online involvement
I will take the initiative to go online to ask about the product I want to buy
I will actively refer to business intelligence and product/service reports
Liao et. al.,
2021 (CA=
0.716)
I often discuss products/services online with friends or colleagues
Online shopping appeals to me
Reciprocity Live streamers will spend time and effort explaining the products to me, so I will help them to promote their stream.
Live streamer will help me if any defect with the promoted product .
When I receive help from live streamer, I feel it is only right to give back and help others.
Yang, 2021 (CA= 0.711)
Source: Self-Develop
3.6 Data Processing
If the information is not gathered and categorized correctly, the findings from the study will be disregarded as useless. Before the data can be evaluated, it must first pass through many procedures. Before the data is transmitted for analysis, it goes through a series of processes including verification, editing, coding, transcription, and maybe others (Zikmund et al., 2010).
Researchers should double check the questionnaire to ensure it is comprehensive and suitable before distributing it to respondents. When information has to be made more coherent, clear, and comprehensive, editing is a useful tool. Whereas coding is the process of assigning numeric values or other symbols to previously modified data to facilitate the input of questionnaire results into a computerized database (Zikmund et al., 2010).
Information for this study comes from participants answers to a questionnaire.
Once we have collected the questionnaires from the participants, we will examine each set individually to make sure that every question has been answered. Verify that all questions have been answered in accordance with the guidelines provided in the survey. In this way, we can be certain that the data we gather is correct and useful. Respondent information is treated as strictly private and used solely for the stated study.
3.7 Common Method Bias
Podsakoff et al., (2012), have pointed to two primary ways to rein in common method bias. For instance, one technique to reducing the effects of common method biases is to take great care to plan the study's design from the start, while another is to use statistical remedies to do the same once the data has been collected. It is recommended to utilize the procedural remedies before data collection, while the statistical remedies should be used either during or after data analysis. Reliability, validity of items, and co-variation among latent variables may all be significantly impacted by method biases.
3.8 Data Analysis
To do so, we use Hayes Process macro with SPSS to test. Information in its native format must be converted using this programme so that it may be analyzed and utilized to further the study project. In order to use Hayes Process Marco, just simply install the application into SPSS it will appears another function of Hayes Process Marco into SPSS that allows to carry out research to examine the relationship of moderators. In addition to that, it provides researchers with complete access to the data. Descriptive statistics, Cronbach's alpha, Pearson's correlation, multiple regression, the independent T-test, and one-way analysis of variance will all be covered here.
3.8.1 Descriptive Analysis
In order for individuals to comprehend and interpret the results more readily, descriptive analysis is used to condense a significant amount of information about the sample (Saunders, 2014). In order to make the data collected from the surveys more readable and understandable for the researchers, it will be summarized and displayed graphically. Information on the demographics of the respondents will be displayed in the form of a pie chart, a bar chart, and a table, while measures of central tendency and dispersion will be offered in the form of a table.
3.8.2 Inferential Analysis
Inferential analysis is a statistical method for extrapolating from a small representative sample to the complete population (Zikmund et al., 2010).
Statistical methods like multiple regression and the Pearson correlation coefficient may be used to infer this.
3.8.3 Reliability Analysis
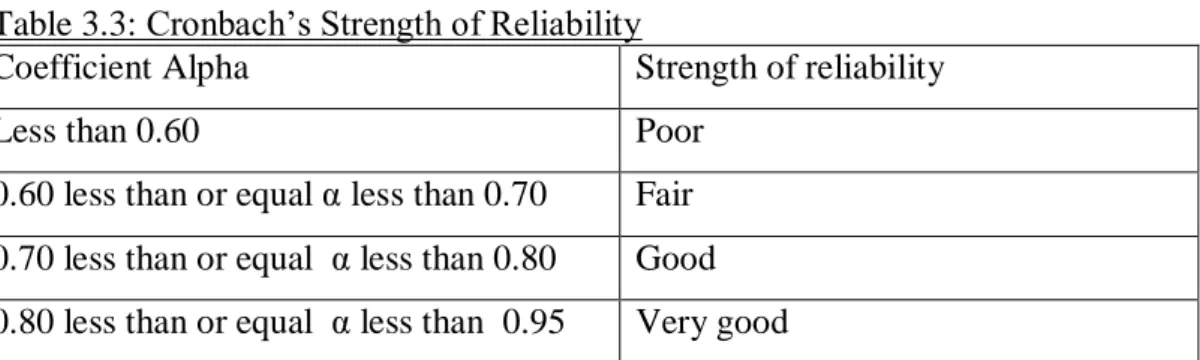
One of the most important criteria for valid measurement, reliability analysis is often used to evaluate the stability of an existing measuring system by gauging its internal consistency. Moreover, it can determine the correlation between individual items within a scale. Repeated measurements provide a larger degree of correlation, hence this scale is more trustworthy. Cronbach's alpha, often known as the reliability coefficient, is the most used tool for assessing the consistency of a multi-item scale (Zikmund et al., 2010). In this study, Cronbach's Alpha was used to assess the internal consistency of the multi-item scale. A Cronbach's alpha score may be anywhere from 0 (total lack of consistency) to 1 (full perfection of internal consistency) (complete consistency). Below is a table displaying the relative reliability of several measures of coefficient.
Table 3.3: Cronbach’s Strength of Reliability
Coefficient Alpha Strength of reliability
Less than 0.60 Poor
0.60 less than or equal α less than 0.70 Fair 0.70 less than or equal α less than 0.80 Good 0.80 less than or equal α less than 0.95 Very good
Note. From Zikmund, W., Babin, B., & Griffin, M. (2010). Business Research Methods (8th Ed.)
Chapter 4
Research Results
In this chapter, I will examine the responses to the survey that was designed in the previous section. The survey was conducted online through Microsoft Form, and 268 responses were received. The data was then analyzed using Excel, SPSS, and Hayes Process Micro. In this chapter, the study's results will be discussed.
4.1 Descriptive Analysis
Section A (General Information) of the questionnaire collects information on the respondents' demographic characteristics, and this data is being analyzed using descriptive statistics. Consider factors like gender, age, race, location, education level, employment status, individual income level, household income level and live streaming shopping purchase frequency times per month. The information is analyzed to draw conclusions.
4.1.1 General information
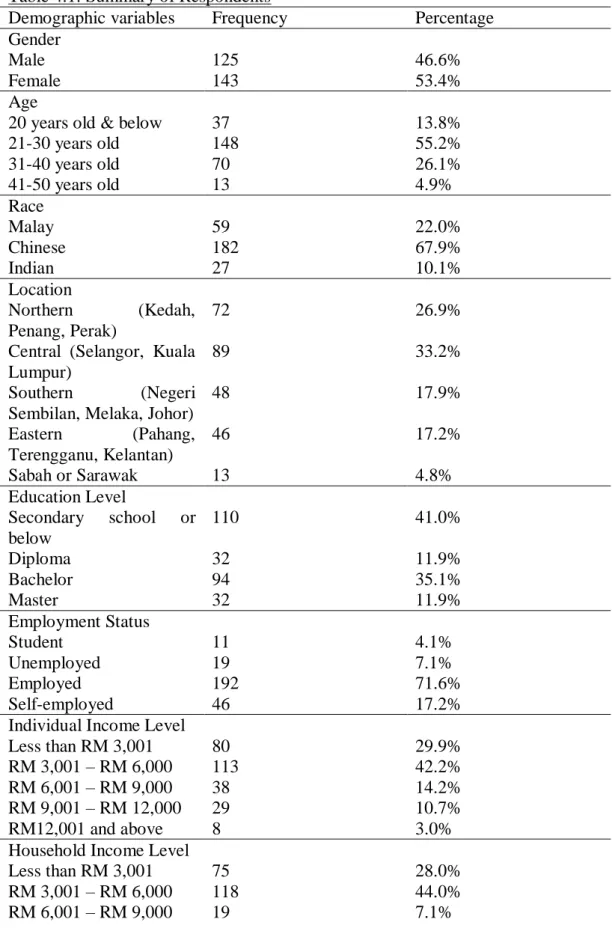
268 respondents have qualified for this research, these respondents are those who answers yes to the screening question ‘have you watch live streaming before’. In order to collect data from a representative sample of the Malaysian population,
questionnaires were sent out thru different channels, for examples Facebook streaming groups, Discord, WhatsApp group & Wechat group.
Table 4.1: Summary of Respondents
Demographic variables Frequency Percentage
Gender
Male 125 46.6%
Female 143 53.4%
Age
20 years old & below 37 13.8%
21-30 years old 148 55.2%
31-40 years old 70 26.1%
41-50 years old 13 4.9%
Race
Malay 59 22.0%
Chinese 182 67.9%
Indian 27 10.1%
Location
Northern (Kedah, Penang, Perak)
72 26.9%
Central (Selangor, Kuala Lumpur)
89 33.2%
Southern (Negeri
Sembilan, Melaka, Johor)
48 17.9%
Eastern (Pahang,
Terengganu, Kelantan)
46 17.2%
Sabah or Sarawak 13 4.8%
Education Level
Secondary school or below
110 41.0%
Diploma 32 11.9%
Bachelor 94 35.1%
Master 32 11.9%
Employment Status
Student 11 4.1%
Unemployed 19 7.1%
Employed 192 71.6%
Self-employed 46 17.2%
Individual Income Level
Less than RM 3,001 80 29.9%
RM 3,001 – RM 6,000 113 42.2%
RM 6,001 – RM 9,000 38 14.2%
RM 9,001 – RM 12,000 29 10.7%
RM12,001 and above 8 3.0%
Household Income Level
Less than RM 3,001 75 28.0%
RM 3,001 – RM 6,000 118 44.0%
RM 6,001 – RM 9,000 19 7.1%
RM 9,001 – RM 12,000 21 7.8%
RM12,001 and above 35 13.1%
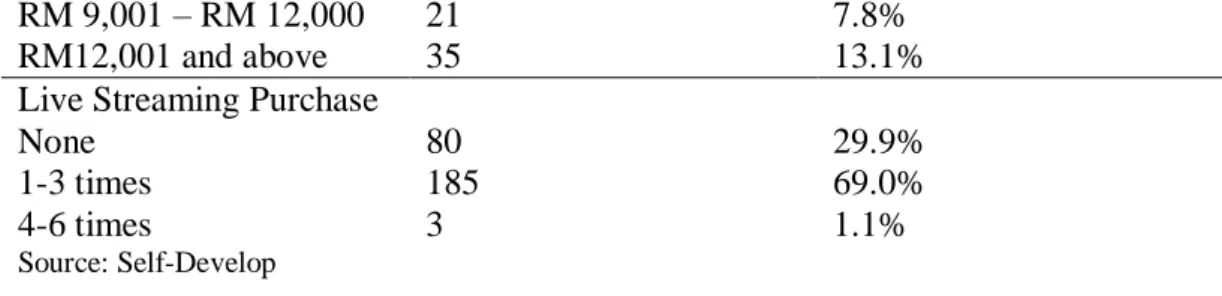
Live Streaming Purchase
None 80 29.9%
1-3 times 185 69.0%
4-6 times 3 1.1%
Source: Self-Develop
4.1.1.1 Gender
Demographic results by gender of respondents who took part in this study are shown in Table 4.1 and Figure 4.1. There were 143 female respondents and 137 male respondents. Female respondents make up 53.4% of the population while males account for 46.6%.
Figure 4.1: Gender of Respondents
Source: Self-Develop
4.1.1.2 Age
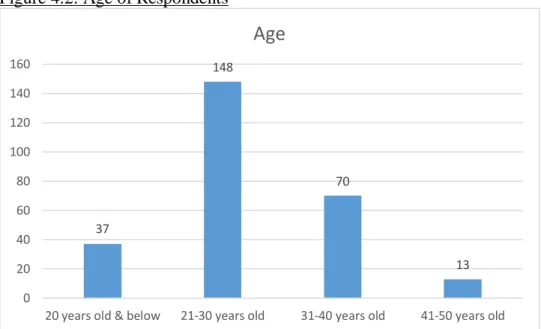
The ages of respondents were tabulated in Table 4.1 and plotted out in Figure 4.2.
According to the data, 148 respondents (55.2%) are between the ages of 21-30, 70 respondents (26.1%) are between the ages of 31-40, 37 respondents (13.8%) are 20 years or below, and 13 respondents (4.9%) are between the ages of 41-50.
Male Female 125
143
GENDER
Figure 4.2: Age of Respondents
Source: Self-Develop
4.1.1.3 Race
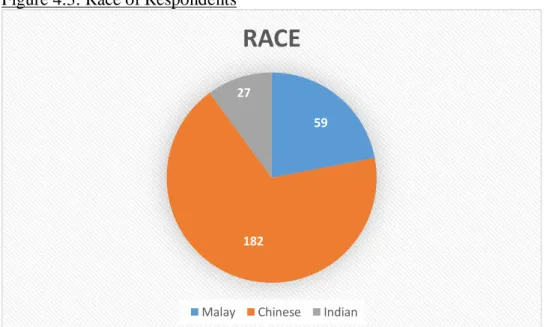
Based on the data shown in Table 4.1 and Figure 4.3, it seems that 182 respondents (67.9%) of the respondents are of Chinese. This constitutes well over half of all questionnaire-takers. The next largest groups are those who identify as Malay 59 respondents(22.0%) and Indian 27 respondents (10.1%).
Figure 4.3: Race of Respondents
Source: Self-Develop 37
148
70
13
0 20 40 60 80 100 120 140 160
20 years old & below 21-30 years old 31-40 years old 41-50 years old
Age
59
182 27
RACE
Malay Chinese Indian
4.1.1.4 Location
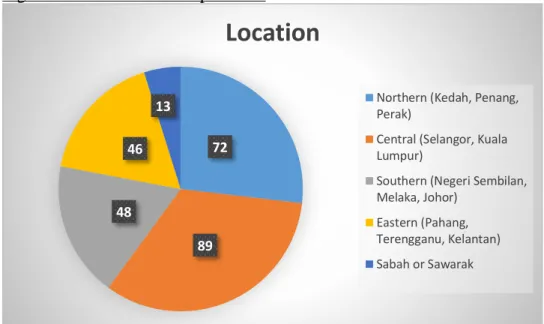
Based on the data shown in Table 4.1 and Figure 4.4, it seems that the origin location of respondents look fairly distributed. The main reason it happened is because the way of gather the respondents are distribute thru different type of group. Northern 72 respondents (26.9%), Central 89 respondents (33.2%), Southern 48 respondents (17.9%), Eastern 46 respondents (17.2%) and East Malaysia which are Sabah and Sarawak consist of 13 respondents (4.8%)
Figure 4.4: Location of Respondents
Source: Self-Develop
4.1.1.5 Education level
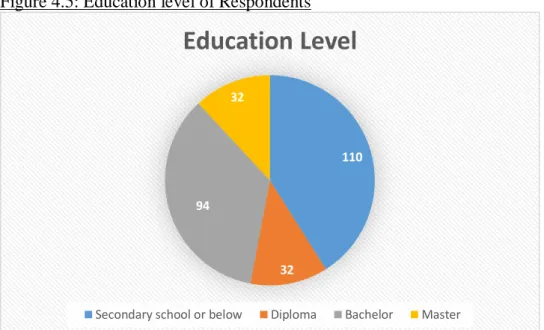
Respondents education level was shown in Table 4.1 and Figure 4.5. The findings indicate that within the respondents, 94 respondents (35.1%) have at least a Bachelor's degree. With 32 respondents or 11.9% holding a certificate or diploma.
The percentage of master students is 11.9%, with 32 respondents. There were 110 people out of 268 respondents (41.0%) with no schooling beyond secondary school which occupy the highest percentage among all of these respondents.
72
89 48
46 13
Location
Northern (Kedah, Penang, Perak)
Central (Selangor, Kuala Lumpur)
Southern (Negeri Sembilan, Melaka, Johor)
Eastern (Pahang, Terengganu, Kelantan) Sabah or Sawarak
Figure 4.5: Education level of Respondents
Source: Self-Develop
4.1.1.6 Employment Status
The outcomes of the respondent's employment were shown in Table 4.1 and Figure 4.6 respectively. 192 out of 268 respondents (71.6%) are employed, making employment status the most common one among the respondents. Self- employment comes in at number two, with 46 respondents, or 17.2% of the total.
The third category of employment status is being unemployed, which affects 19 respondents (7.1%). There are a total of 11 respondents, or 4.1%, who identify as being in the Student category.
110
32 94
32
Education Level
Secondary school or below Diploma Bachelor Master
Figure 4.6: Employment Status of Respondents
Source: Self-Develop
4.1.1.7 Individual Income Level
The following Table 4.1 and Figure 4.7. provides information on the number of people from various income brackets who were included in the research. The data shows that the proportion of respondents whose individual income between RM 3,001 to RM 6,000 was the highest which is 113 respondents (42.2%), after the percentage of respondents whose monthly income was less than RM 3,001 which is 80 respondents (29.9%). While 38 respondents (14.2%) had an annual income of RM6001 to RM9,000, and 29 respondents (10.7%) of the respondents having individual income between RM9,001 to RM12,000. Only 8 respondents (3.0%) of people had an individual income of more than RM12,001. The findings are visually shown in the form of a pie chart.
11 19
192 46
Employment Status
Student Unemployed Employed Self-employed
Figure 4.7: Individual Income Level of Respondents
Source: Self-Develop
4.1.1.8 Household Income Level
The following Table 4.1 and Figure 4.8. provides information on the number of respondents from various income brackets who were included in the research. The data shows that the proportion of people whose household income between RM 3,001 to RM 6,000 was the still the highest which is 118 respondents (44.0%), after the percentage of respondents whose monthly income was less than RM 3,001 which is 75 respondents (28.0%). While 19 respondents (7.1%) had a household income of RM6001 to RM9,000, and 21 respondents (7.8%) of the respondents having household income between RM9,001 to RM12,000. But compare to individual income 8 respondents (3%), 35 respondents (13.1%) of people had an household income of more than RM12,001 now.
80
113 38
29 8
Individual Income Level
Less than RM 3,000 RM 3,001 – RM 6,000 RM 6,001 – RM 9,000 RM 9,001 – RM 12,000 RM12,001 and above
Figure 4.8: Household Income Level of Respondents
Source: Self-Develop
4.1.1.9 Live Streaming Shopping Purchase Frequency (Times Per Month)
Based on the analysis as illustrated on Table 4.1 and Figure 4.9, total of 185 respondents (69.0%) spent on 1-3 times per month for live streaming purchase.
This is followed by 80 respondents (29.9%) who don’t spend on live streaming purchase. Furthermore, 3 respondents (1.1%) have spent 4-6 times per month on live streaming purchase. Although 30% of the respondents do not spend on live streaming purchases, but these respondents are still watching live streaming. This indicates that there are potential which they might go for live streaming purchase.
Besides, this research is mainly focus on how social capital of live streamers create impact on viewers purchase intention. Although the viewers have no live streaming purchase experience before, but they might have the intention instead.
75
118 19
21 35
Household Income Level
Less than RM 3,000 RM 3,001 – RM 6,000 RM 6,001 – RM 9,000 RM 9,001 – RM 12,000 RM12,001 and above
Figure 4.9: Live Streaming Purchase Frequency (Times / Month) of Respondents
Source: Self-Develop
4.2 Inferential Analysis
4.2.1 Reliability Test
The results of the analysis of the internal reliability using the Cronbach Alpha method are shown in Table 4.2 below. It was found that the reliability of a 4 item scale for purchase intention α= 0.876, which includes that is was high reliability.
In addition to this, both social interaction and popularity recorded as α= 0.814 and α= 0.755, which is deemed to be within an acceptable range respectively. The reliability of a 3 item scale that was used to measure share language and reciprocity was evaluated, and the findings indicated that it was satisfactory, with α= 0.858 and α= 0.715, respectively. Aside from that, the professionalism, trust, and online participation were found to be at α= 0.826, α= 0.853, and α= 0.775 respectively.
Table 4.2: Reliability Test
Variables Cronbach’s α Number of items
Purchase Intention (PI) 0.876 4
Social Interaction (SI) 0.814 4
80
185
3 0
20 40 60 80 100 120 140 160 180 200
None 1-3 4-6
Live Streaming Purchase Frequency (Time Per Month)
Popularity (POP) 0.755 4
Share Language (SL) 0.858 3
Professionalism (PRO) 0.826 4
Trust (TRU) 0.853 4
Reciprocity (REC) 0.715 3
Online Involvement (OI) 0.775 4
Source: Self-Develop
4.2.2 Pearson’s Correlation Analysis
Table 4.3 presented summary of the correlation matrix for the 8 examined variables namely PI, SI, POP, SI, PRO, TRU, REC and OI. PRO is found to have correlation with PI (r=0.266), POP (r=0.177) and SL (r=0.180). Next, TRU is having correlation with PRO (r=0.161). REC having most variables correlation which PI (r=-0.231), SI (r=0.259) and TRU (0.173). Lastly, OI are found to correlated with TRU (r=0.295) and REC (r=0.236). All correlations are significant at 0.01 level.
Table 4.3: Pearson’s Correlation Analysis
PI SI POP SL PRO TRU REC OI
PI 1
SI .054 1
POP .085 -.029 1
SL -.080 .116 .044 1
PRO .266** .113 .177** .180** 1
TRU .139 .148 .154 .123 .161** 1
REC -.231** .259** .074 -.043 -.062 .173** 1
OI .111 .087 .072 .041 -.097 .295** .236** 1
**. Correlation is significant at the 0.01 level (2-tailed).
Referring to Coefficient Table 4.4, all four out of six independent variables were statistically significant, with shared language (β = -0.157, P <0.05), professionalism (β = 0.188, P <0.001), trust (β = 0.121, P <0.05) and reciprocity (β = -0.334, P <0.001).
Table 4.4: Coefficient Coefficients
Model
Unstandardized Coefficients
Standardized Coefficients
t Sig.
B Std. Error Beta
1 (Constant) 3.724 .419 8.889 <.001
SI .067 .041 .099 1.654 .099
POP .060 .067 .052 .892 .373
SL -.157 .055 -.167 -2.872 .004
PRO .188 .048 .235 3.959 <.001
TRU .121 .048 .147 2.489 .013
REC -.334 .072 -.278 -4.656 <.001
a. Dependent Variable: PI
Source: Self-Develop
4.2.3 Relationship between Variables
It was analyzed using the procedure of PROCESS Macro model 1 for SPSS proposed by Haye (2013), and all independent variables are perform analysis individually because PROCESS Macro model 1 unable to combine all the individual variables and perform the analysis in once. Hence, to do so, we could determine whether or not online involvement had a moderating effect on the relationship between all of the independent variables and the viewers purchase intention. Verification was performed using Bootstrap, the confidence interval was set at 95%, and there were 5000 samples taken.
4.2.3.1 Moderating Effect of ONL Towards SI & PI
As shown in Table 4.5, social interaction does not have significant effect on viewers purchase intention (β = 0.0394, p > 0.05). But, the interaction term between social interaction and online involvement has a positive significant effect on viewers purchase intention (β = 0.0394, p < 0.001). It can be seen that online
involvement moderated the relationship between social interaction and viewers purchase intention.
Table 4.5: Moderating Effect of OI Towards SI & PI Model DV: Viewers Purchase Intention
β S.E. p F R2 ∆R2
SI 0.0394 0.0392 0.3166
OI 0.1971 0.0675 0.0038* 12.9106** 0.3577 0.1135 SI x OI 0.3334 0.0569 0.0000**
*.p < 0.05
**.p < 0.001
Researchers should not talk about primary effects or the impacts of these factors while adjusting for the interaction, as suggested by Hayes (2017). It is more accurate to conceive of the conditional effect as being similar to a simple effect or as a simple slop, as the slopes indicate the influence of X (or W) on Y, conditional on the other variable being 0. As such, interpreting the effects of social interaction and online involvement as: a) the effect of social interaction and viewers purchase intention was insignificant (β= 0.0394, S.E. =0.0392, p= 0.3166), conditional on online involvement= 0; b) the conditional effect of online involvement was positive and significant (β= 0.1971, S.E.= 0.0675, p < 0.05) conditional on social interaction=0. Since the interaction term in this was insignificant, it was unable to explain the nature of the moderated association between social interaction and viewers purchase intentions by probing the interaction. Thus, H1 and H7 not supported.
4.2.3.2 Moderating Effect of OI Towards POP & PI
As shown in Table 4.6, popularity was found do not have significant effect on viewers purchase intention (β= 0.0857, p > 0.05). The interaction term between popularity and online involvement also found insignificant effect on viewers purchase intention (β= 0.6664, p>0.05). It can be seen that online involvement do not moderates the relationship between popularity and viewers purchase intention.