ELECTROENCEPHALOGRAM BASED EMOTION RECOGNITION IN PARKINSON’S DISEASE USING
NON-LINEAR METHODS
by
Yuvaraj Rajamanickam (1141310659)
A thesis submitted in fulfillment of the requirements for the degree of Doctor of Philosophy in Biomedical Electronic Engineering
School of Mechatronic Engineering UNIVERSITI MALAYSIA PERLIS
2015
© This
item is protecte d by
original
copyr
ight
ii
ACKNOWLEDGEMENT
The successful completion of this thesis work relies on the influence of many people who have generously given their time and energy in specific ways. I take this opportunity to express my gratitude and thanks to each of you who have been a part of this PhD journey.
First and foremost I would like to express my sincere gratitude to the support and supervision of Dr. M. Murugappan, who brought in this opportunity, for his suggestions, guidance, encouragement and challenges throughout this work from its beginning. Indeed, his inputs and ideas were of immense help in the making of this thesis.
I thank Assoc. Prof. Dr. Kenneth Sundaraj, for his support in the starting and continuing of this research. I would like to thank Dr. Mohd Iqbal Omar for getting financial support through graduate assistantship. I extend my thanks to Dr. R. Palaniappan (University of Kent, United Kingdom) for the valuable comments, discussions, ideas and suggestions that helped me through this work.
I specially want to thank Prof. Datin. Dr. Norlinah Mohamed Ibrahim, Consultant Neurologist (Parkinson's disease and Movement Disorders, Head, Department of Medicine, UKM Medical Center, Kuala Lumpur), who introduced me into the field of clinical population and provided me with different ideas and suggestions. I would like to thank Ms. Khairiyah Mohamad for assisting me with various facilities of the department during data collection experiment. I would like to thank Dr. Mohamad Fadli, Dr. Siva Rao Subramanian and Dr. Shahrul Azmin for their assistance with recruitment of PD patients. I extend my thanks to Mrs. Rani and team, for their support and cooperation in getting healthy control participant’s for the data collection experiment in UKM.
I take this time to thank the dean, school of Mechatronic Engineering Professor Dr. Abu Hassan bin Abdullah and the program chairman Dr. Cheng Ee Meng for their cooperation and administrative assistance through this course of study.
I would like to express my gratitude and thanks to the vice chancellor of UniMAP, Yang Berbahagia Brigedier Jeneral Datuk Prof. Dr. Kamarudin Hussin, for providing
© This
item is protecte
d by
original
copyr
ight
iii
me an opportunity in this university and the financial support through research assistantship and graduate assistantship.
It is an honor to thank my fellow colleagues, members of intelligent signal processing and automav cluster, and my roommates (Dr. P. Karthikeyan and Dr. V. Murali) who supported me in this research work. At this junction, I would like to appreciate my parents, Dr. A. Rajamanickam and V.R. Rani, lovable sisters, R. Naveena and Dr. R.
Keerthana, and dear most friends, G. Bharathi Kannan, M. Vimal Raj, M. Vel Murugan, and P. Nandhirajan, for being always there for me in this solitary research journey, still being 2500 miles away from me.
Last but not least, I am deeply thankful to different divinities existing in the universe by the principal concept of faith for successfully completing the research.
1
2
3
4
5
6
© This
item is protecte
d by
original
copyr
ight
iv
7 TABLE OF CONTENTS
DECLARATION OF THESIS i
ACKNOWLEDGEMENT ii
TABLE OF CONTENTS iv
LIST OF TABLES ix
LIST OF FIGURES x
LIST OF ABBREVIATIONS xiii
LIST OF SYMBOLS xvi
ABSTRAK xvii
ABSTRACT xviii
CHAPTER 1 INTRODUCTION 1
1.1 Research Background 1
1.2 Problem Statement 6
1.3 Aim and Research Objectives 8
1.4 Scope of the Thesis 9
1.5 Organization of the Thesis 10
CHAPTER 2 LITERATURE REVIEW 12
2.1 Introduction 12
2.2 Emotion Definition 14
2.2.1 Theories of Emotion 15
© This
item is protecte
d by
original
copyr
ight
v
2.2.2 Emotion Models 18
2.3 Parkinson's Disease (PD) and Emotions 20
2.3.1 Approaches to Emotion Recogntion in PD 22
2.4 Biosignals Based Emotion Recognition System 27 2.4.1 Necessity of Biosignals Based Emotion Recognition 28
2.5 Measuring Brain Activity 30 2.5.1 Electroencephalogram (EEG) 31
2.6 EEG signal and Emotion 35
2.7 Non-Linear Analysis of EEG Signal 41
2.8 Classical Emotion Recognition System using EEG Signal 43 2.8.1 EEG Signal Acquisition 44
2.8.2 Pre-Processing 49
2.8.3 Feature Extraction 50
2.8.4 Feature Reduction/Selection 51
2.8.5 Emotional State Classification 51
2.9 Potential Applications of Emotion Recognition System 52 2.10 Summary 53 CHAPTER 3 DATA ACQUISITION AND PRE-PROCESSING 55 3.1 Introduction 55
3.2 Emotion Elicitation Protocol 57 3.2.1 Selection of Stimuli Materials 57
3.2.2 Design of Emotion Elicitation Protocol 60
3.3 Data Collection Experiment 62 3.3.1 EEG Data Acquisition Device and Electrode placement 63
3.4 Participants 65
3.4.1 General Inclusion and Exclusion Criteria 66
3.4.2 Ethics Statement 68
© This
item is protecte
d by
original
copyr
ight
vi
3.4.3 Experimental Procedure 68
3.5 Pre-Processing of Emotional EEG Data 71
3.5.1 Sources of Noise and Artifacts 71
3.5.2 Methods to Remove Noise and Artifacts 72
3.6 Summary 75
CHAPTER 4 FEATURE EXTRACTION AND CLASSIFICATION 76
4.1 Introduction 76
4.2 Features Extraction Methods 80
4.2.1 Higher Order Spectra (HOS) 80
4.2.2 Non-Linear Dynamical Analysis 84
4.2.3 Fast Fourier Transform (FFT) 88
4.2.4 Wavelet Packet Transform (WPT) 89
4.3 EEG Functional Connectivity Index 92
4.3.1 Correlation 93
4.3.2 Coherence 93
4.3.3 Phase Synchronization Index (PSI) 94
4.3.4 Proposed Bispectrum based Phase Synchronization Index (bPSI) 95
4.4 Emotional Feature Validation 96
4.5 Feature Dimensional Reduction/Selection Techniques 97
4.5.1 Principal Component Analysis (PCA) 97
4.5.2 Independent Component Analysis (ICA) 98
4.5.3 Correlation-Based Feature Selection (CFS) 99
4.5.4 Sequential Forward Selection (SFS) 99
4.6 Classification of Emotional states 100
4.6.1 Support Vector Machine (SVM) Classifier 101
4.6.2 K-Nearest Neighbor (KNN) Classifier 104
4.6.3 Fuzzy K-Nearest Neighbor (FKNN) Classifier 105
© This
item is protecte
d by
original
copyr
ight
vii
4.6.4 Regression Tree (RT) Classifier 107
4.7 Classifier Performance Validation and Measures 108
4.7.1 K-Fold Cross-validation 108
4.7.2 Performace Measures 109
4.8 Proposed Trajectory of Emotion Changes 110
4.8.1 Isometric Feature Mapping 110
4.9 Summary 113
CHAPTER 5 RESULTS AND DISCUSSION 115
5.1 Introduction 115
5.2 Participants Characteristics 116
5.3 Behavioral Measures 117
5.4 Relationship Between Rest State and Emotional Response EEG 118
5.5 Pre-processing of Emotional EEG signals 119
5.6 Classification of Emotional States 121
5.6.1 Time Windows 122
5.6.2 Performance of Emotional Features (within the group) 123 5.6.3 Performance of Emotional Features (between the groups) 128 5.6.4 Performance Feature Dimesionality Reduction Methods 135 5.6.5 Performance of EEG-Based Functional Connectivity Indices 146 5.7 Comparison With Previous Work and Research Findings 151 5.8 GUI: Emotion-Based Neuro-Rehabilitaion System for PD patients 156
5.9 Discussion 160
5.10 Summary 161
CHAPTER 6 CONCLUSIONS AND RECOMMENDATIONS 163
6.1 Conclusions 163
6.2 Research Contributions 166
6.3 Recommendations 166
© This
item is protecte
d by
original
copyr
ight
viii
REFERENCES 169
APPENDICES 188
LIST OF PUBLICATIONS 247
LIST OF AWARDS 249
© This
item is protecte
d by
original
copyr
ight
ix
LIST OF TABLES
NO. PAGE
3.1 Characteristics of IAPS and IADS used of emotion elicitation. 58
3.2 Order of emotional stimuli. 62
5.1 Demographic and clinical characteristics of PD patients and HC participants.
116
5.2 Self-assessment recognition rate (%) of the six basic emotions. 117 5.3 Mean subjective ratings of emotional stimuli 118 5.4 Performance of digital Butterworth 6th order bandpass filter 120 5.5 Validation of emotional EEG features among the six emotional
states across different frequency bands using ANOVA
125
5.6 Summary of average classification accuracy among the six emotional states (within the group).
129
5.7 Sensitivity and specificity obtained among the six emotional states (within the group) using ALL frequency bands.
129
5.8 Summary of classification accuracy (ALL bands) between each emotional state of PD patients and HC participants.
132
5.9 Sensitivity and specificity (ALL bands) obtained between each emotional state of PD patients and HC participants.
132
5.10 Summary of average classification accuracy using ALL frequency bands for different functional connectivity indices.
149
5.11 Comparision of the performance of EEG based emotion recognition system with previous research works.
152
© This
item is protecte
d by
original
copyr
ight
x
LIST OF FIGURES
NO. PAGE
1.1 Block diagram of emotion recognition system. 6
2.1 Emotion process. 16
2.2 Human brain. 17
2.3 Emotions models (a) Two-dimensional model by valence and arousal (b) Circumplex model of emotions.
20
2.4 Three-dimensional model by valence, arousal and stance 20 2.5 Schematic representation of the nerve cell produces dopamine in
Parkinson’s and healthy condition.
21
2.6 International 10–20 electrode system. (a) Left view (b) Above the head view.
39
2.7 Example of EEG signals for one second. (a) EEG signal (b) Delta (c) Theta (d) Alpha (e) Beta (f) Gamma.
39
2.8 Classical emotion recognition using EEG signal. 43
3.1 Data acquisition methodology. 58
3.2 Location of selected pictures for the experiment conduction along with the rest pictures of the IAPS database (small blue dots) at the arousal-valence space.
59
3.3 Location of selected sounds for the experiment conduction along with the rest sounds of the IADS database (small blue dots) at the arousal-valence space.
59
3.4 Design of emotion elicitation protocol. 61
3.5 Data collection experiment setup. 63
3.6 Electrode positions. 64
3.7 Emotiv EPOC headset on a participant showing (a) right (b) back and (c) left views.
64
3.8 Sample recording of EEG signals corresponding to six emotions. 65
© This
item is protecte
d by
original
copyr
ight
xi
3.9 Flowchart of experimental procedure. 69
4.1 Work flow diagram used to develop an emotion recognition system.
77
4.2 Overview of feature extraction methods used in this research. 78 4.3 Non-redundant region of computation of the bispectrum for real
signals.
82
4.4 Wavelet decomposition trees. 90
4.5 Working of SVM algorithm. 101
4.6 Flowchart of Isomap algorithm 111
5.1 Topographic maps of rest state versus emotional EEG signals (1- 49 Hz).
119
5.2 Frequency plot of emotional EEG signal before and after pre- processing (1-49 Hz).
121
5.3 Average classification accuracies of bispectrum feature across EEG frequency bands with different length time windows.
123
5.4 Comparison of feature dimensionality reduction methods across ALL frequency bands.
136
5.5 Distribution of top 40 features selected by CFS method (a) PD patients (b) HC participants.
138
5.6 Process of PCA between each emotional state of PD patients and HC participants.
140
5.7 Process of ICA between each emotional state of PD patients and HC participants.
141
5.8 Process of CFS between each emotional state of PD patients and HC participants.
142
5.9 Trajectory of emotion changes among the six emotional states.
(a) 20 PD patients and (b) 20 HC participants.
144
5.10 Trajectory of emotion changes between each emotional state of 20 PD patients and 20 HC participants.
145
5.11 Brain maps of selected features across different EEG functional connectivity index using feature selection algorithm.
148
5.12 EEG-based functional connectivity indices performance for each emotion.
150
© This
item is protecte
d by
original
copyr
ight
xii
5.13 GUI: Main Screen of the Emotion based Neuro-Rehabilitation system for PD patients
158
5.14 GUI: Input Module 158
5.15 GUI: Play a Game Menu 159
5.16 GUI: Listen Music Menu 159
5.17 GUI: Consultation Menu 160
© This
item is protecte
d by
original
copyr
ight
xiii
LIST OF ABBREVIATIONS
ADL - Activities of Daily Living ANOVA - Analysis of Variance
ANS - Autonomous Nervous System ANN - Artificial Neural Network APEN - Approximate Entropy
bPSI - Bispectrum based Phase Synchronization Index BCI - Brain Computer Interface
BDI - Beck Depression Inventory
BDAs - Bispectrum Differential Asymmetry BNoAs - Bispectrum No Asymmetry
BRAs - Bispectrum Rational Asymmetry BVP - Blood Volume Pressure
CCA - Canonical Correlation Analysis
CD - Correlation Dimension
CFS - Correlation-based Feature Selector CNS - Central Nervous System
DRT - Dopamine Replacement Therapy DFA - Detrended Fluctuation Analysis DFT - Discrete Fourier Transform ECG - Electrocardiogram
EDR - ElectroDermal Response EEG - Electroencephalogram
EMG - Electromyogram
© This
item is protecte
d by
original
copyr
ight
xiv ERP - Event Related Potential FFT - Fast Fourier Transform
FMRI - Functional Magnetic Resonance Imaging FKNN - Fuzzy K-Nearest Neighbor
GUI - Graphical User Interface
HC - Healthy Controls
HE - Hurst exponent
HOS - Higher Order Spectra
HUKM - Hospital Universiti Kebangsaan Malaysia H & Y - Hoehn and Yahr
IADS - International Affective Digitized Sound IAPS - International Affective Picture System ICA - Independent Component Analysis IIR - Infinite Impulse Response
KNN - K-Nearest Neighbor
LDA - Linear Discriminant Analysis LLE - Largest Lyapunov Exponent MBP - Marquardt Back Propagation
MEG - Magnetoencephalogram
MDS - Multi-Dimensional Scaling
MMC - Meta-Multi Class
MMSE - Mini Mental State Examination PCA - Principal Component Analysis
PD - Parkinson’s Disease
PDAs - Power Spectrum Differential Asymmetry
© This
item is protecte
d by
original
copyr
ight
xv
PET - Positron Emission Tomography PNoAs - Power Spectrum No Asymmetry PRAs - Power Spectrum Rational Asymmetry PSI - Phase Synchronization Index
PPG - Photoplethysmograph
RT - Regression Tree
RR - Respiration Rate
SC - Skin Conductance
SD - Standard Deviation
SFS - Sequential Forward Selection SVM - Support Vector Machine
UPDRS - Unified Parkinson’s Disease Rating Scale WPT - Wavelet Packet Transform
WP - Wavelet Packet
© This
item is protecte
d by
original
copyr
ight
xvi
LIST OF SYMBOLS
N - Number of participants
Hz - Hertz (unit of frequency)
fs - Sampling rate
µV - Microvolt (unit of EEG signal)
% - Percentage
± - Plus/minus
dB - Decibel (unit of amplitude loss)
s - Seconds
F-value - Critical value for the F-distribution
p-value - Probability of obtaining test statistical result
t - Student’s t-test
x2 - Chi-square test
© This
item is protecte
d by
original
copyr
ight
xvii
Pengenalan Emosi Dalam Penyakit Parkinson Berdasarkan Kaedah Bukan Linear Menggunakan Electroencephalogram
Abstrak
Selain tanda-tanda dan gejala motor klasik, individu dengan penyakit Parkinson (PD) dipercirikan dengan kemerosotan emosi. Isyarat electroencephalogram (EEG), yang menjadi suatu aktiviti system saraf pusat, mencerminkan keadaan emosi tersirat sebenar seseorang individu. Kajian ini menumpukan pada penganalisaan algoritma bukan linear yang berbeza untuk mengenalpasti keadaan emosi dalam pesakit Parkinson (PD) berbanding dengan peserta subjek sihat (HC) menggunakan isyarat EEG. Dua puluh penyakit PD yang bukan gila dan 20 subjek sihat yang sepadan secara umur-, jantina-, dan taraf pendidikan menonjolkan kebahagiaan, kesedihan, ketakutan, kemarahan, kejutan dan kejijikan menggunakan stimuli pelbagai modal (kombinasi bunyi dan visual) sambil isyarat EEG 14-saluran tanpa wayar direkod. Tambahan pula, peserta telah diminta untuk melaporkan pengaruh subjektif yang dialami. Isyarat EEG yang direkod telah di pra-proses menggunakan kaedah ‘threshold’ untuk menyingkirkan artifak kelipan/pergerakan mata dan penuras laluan lulus Butterworth perintah ke-enam telah digunakan untuk mengekstrak julat frekuensi EEG yang berikut: delta (1-4 Hz), theta (4-8 Hz), alpha (8-13 Hz), beta (13-30 Hz), dan gamma (30-49 Hz). Untuk mengklasifikasi keadaan emosi dan menggambarkan perubahan keadaan emosi dengan masa, kami telah membanding empat kaedah mengekstrak ciri (spektrum perintah tinggi (HOS), analisis dinamik bukan linear, transformasi rancak Fourier dan transformasi paket ombak), dan mencadang suatu pendekatan untuk menggambarkan trajektori emosi menggunakan pembelajaran ‘manifold’. Tiga indeks penghubungan, termasuk korelasi, kepaduan, dan indeks penyegerakan fasa (PSI), telah diekstrak dengan memfokus pada pasangan elektrod untuk menganggar penghubungan berfungsi otak dalam isyarat EEG.
Ciri terbaru yang bernama indeks penyegerakan fasa yang berdasarkan dwi-spektrum (bPSI) telah dicadang untuk menghitung corak penghubungan berfungsi EEG bersama kaedah tradisional. Pengertian statistik untuk semua ciri yang dihitung telah dikira menggunakan ujian penganalisaan varians (ANOVA). Empat pengelas yang berbeza iaitu K-jiran terdekat kabur (FKNN), K-jiran terdekat (KNN), pokok regressi (RT), dan mesin sokongan vector (SVM) telah digunakan untuk mengkaji prestasi ciri-ciri yang diekstrak. Kaedah pengesahan silang 10-lipat telah digunakan untuk menguji kebolehpercayaan keputusan pengelas. Ciri-ciri yang diekstrak melalui keempat-empat kaedah didapati bererti secara statistik (p < 0.05). Ciri HOS dari gabungan kelima-lima julat frequensi menyampaikan prestasi yang baik dalam mengenal pasti keadaan emosi pesakit PD dan peserta HC dengan kadar pengenalpastian purata 77.43% ± 1.59% dan 83.04% ± 1.87%. Pesakit PD menunjukkan kemerosotan emosi berbanding dengan peserta HC, yang ditonjolkan oleh kadar pengelasan yang rendah, khasnya untuk emosi negatif (kesedihan, ketakutan, kemarahan dan kejijikan). Secara umumnya ciri spesifik- emosi didapati berhubung kuat dengan julat frekuensi tinggi (alpha, beta dan gamma) berbanding julat berfrekuensi rendah (delta dan theta). Perubahan trajektori emosi boleh digambarkan melalui megurangkan ciri subjek-berdikari dengan pembelajaran
‘manifold’. Selain itu, indeks penyegerakan fasa yang berdasarkan dwi-spektrum menyumbang prestasi yang lebih baik dengan kadar purata pengalpastian 51.66% ± 1.02% dan 71.79% ± 1.01% untuk pesakit PD dan HC.
© This
item is protecte
d by
original
copyr
ight
xviii
Electroencephalogram Based Emotion Recognition in Parkinson’s Disease Using Non-linear Methods
Abstract
In addition to classic motor signs and symptoms, individuals with Parkinson's disease (PD) are characterized by emotional impairments. Electroencephalogram (EEG) signals, being an activity of the central nervous system, reflect the underlying true emotional state of a person. This research focuses on analyzing different non-linear algorithms to recognize emotional states in Parkinson’s disease (PD) patients compared to healthy controls (HC) participants using EEG signals. Twenty non-demented PD patients and 20 healthy age-, gender-, and education level-matched controls viewed happiness, sadness, fear, anger, surprise, and disgust using multimodal stimulus (combination of audio and visual) while 14-channel wireless EEG was being recorded. In addition, participants were asked to report their subjective affect. The acquired EEG signals were preprocessed using thresholding method to remove eye blinks/movement artifacts. A Butterworth 6th order bandpass filter was used to extract the following EEG frequency bands: delta (1–4 Hz), theta (4–8 Hz), alpha (8–13 Hz), beta (13–30 Hz), and gamma (30–49 Hz). To classify the emotional states and visualize the changes of emotional states over time at single-electrode level, four kinds of feature extraction methods (namely higher order spectra (HOS), non-linear analysis, fast Fourier transform and wavelet packet transform) were compared, and proposed an approach to visualize the trajectory of emotion changes with manifold learning. Three connectivity indices, including correlation, coherence, and phase synchronization index (PSI) were extracted by focusing on electrode pairs to estimate brain functional connectivity in EEG signals.
New feature, namely, bispectrum based phase synchronization index (bPSI) was proposed for computing EEG functional connectivity patterns with the traditional methods. The statistical significance of all the computed features was studied using Analysis of Variance (ANOVA) test. Four different classifiers namely Fuzzy K- Nearest Neighbor (FKNN), K-Nearest Neighbor (KNN), Regression Tree (RT), and Support Vector Machine (SVM) were used to investigate the performance of the extracted features. Ten-fold cross-validation method was used for testing the reliability of the classifier results. The features extracted in all the methods were found to be statically significant (p < 0.05). The HOS based feature across ALL frequency bands (combination of five bands) performed well in recognizing emotional states of PD patients and HC participants with an averaged recognition rate of 77.43% ± 1.59% and 83.04% ± 1.87% respectively. The PD patients showed emotional impairments as demonstrated by a lower classification performance, particularly for negative emotions (sadness, fear, anger and disgust). The emotion-specific feature was mainly related to high frequency band (alpha, beta and gamma) than low frequency band (delta and theta). The trajectory of emotion changes was drawn by a manifold learning model.
Also, bPSI functional connectivity index performed better with an averaged recognition rate of 51.66% ± 1.02% and 71.79% ± 1.01% for PD patients and HC respectively.
© This
item is protecte
d by
original
copyr
ight
1 CHAPTER 1
INTRODUCTION
1.1 Research Background
Emotion is always a very fascinating field for discussing and researching. From the dawn of humanity, human being have been very interested in understanding our feelings, fears, sorrow or happiness, in finding out the roots of our emotions. Emotion plays a vital role in our daily life as it influences our intelligence, behaviour and social communication. The ability to infer other people‟s emotional state is crucial for normal social interaction. Numerous studies on engineering approaches to automatic emotion recognition in healthy control (HC) participants have been performed in the past few decades. Most of the approaches developed till now are based on the audio-visual channels of emotion expression such as facial action, speech or gestures (Cohen, Garg,
& Huang, 2000; Kessous, Castellano, & Caridakis, 2010; Kim, 2007).
Though numerous engineering based research studies in HC participants have been published on these behavior-based models, they rely on the explicit expression of emotions by the participant. While facial actions tend to be the most visible form of emotion expression, they are the most easily controlled with large dependence on social situations (Picard, Vyzas, & Healey, 2001). Similarly, voice and other external modes of expression can be easily controlled or suppressed depending on the external circumstances. Such unexpressed emotions, socially masked emotions and emotions expressed differently (e.g. an angry person may smile) cannot be tracked by these behaviour-based modalities. The true emotional changes remain internal and are not detected by the audio-visual recording system (Kim & Andre, 2008). Furthermore,
© This
item is protecte
d by
original
copyr
ight
2
recognition of emotions using these modalities is influenced by a number of external factors such as lighting conditions, auditory noise and accessories like glasses (Apolloni et al., 2007).
While Parkinson‟s disease (PD) has traditionally been defined as a movement disorder, there is a growing evidence of cognitive and social impairments associated with this disease, and particularly, in emotion processing. Moreover, for patients suffering from PD could not be able to express their emotions by facial expressions.
Over the last decade, there has been increasing attention to the role played by emotional processes in PD patients. Psychologist and neuroscientists have made important progress in understanding how PD impairs specific components of emotional processes (e.g., expressive, cognitive, subjective) and have also formulated interesting hypotheses about the underlying neurological mechanism which could explain the emotional impairments observed in PD patients (Gray & Tickle-Degnen, 2010; Peron, Dondaine, Jeune, Grandjean, & Verin, 2012).
Indeed, a huge number of studies have been conducted in the last few years with the goal to understand if PD patients dealing with different disease stages are still able to correctly identify, discriminate, and rate the emotional content of the stimuli (e.g., pictures, prerecorded speech samples, written sentences). Unfortunately, the experimental results so far are inconsistent and quite difficult to interpret. Some researchers reported that PD patients perform worse than HC participants in a number of recognition tasks, there is also evidence that the two groups do not differ in the same tasks (Gray & Tickle-Degnen, 2010; Peron et al., 2012; Schroder, Nikolova, & Dengler, 2010). Much of the research in this area dealt with executive abilities or behavioral response, which are known to be impaired in PD (Pillon, Dubois, & Agid, 1996). May be this overall executive impairment causes impaired performances in evaluative
© This
item is protecte
d by
original
copyr
ight
3
emotion recognition and rating tasks. Furthermore, the statistical tools were commonly used to analyze the obtained behavioral responses.
Machine learning algorithms are increasingly becoming popular in psychology and psychophysiology research and they indeed might be useful as an addition to traditional statistical methods. The expression of an emotion occurs as a result of physiological changes in the central nervous system (CNS) and/or autonomic nervous system (ANS). For instance, the muscle tension in the face gives rise to facial actions (Picard et al., 2001). Researchers have showed significant differences between the emotional states using different biosignals such as electroencephalogram (EEG), electrocardiogram (ECG), electromyogram (EMG), skin conductance (SC), respiration rate (RR) and blood volume pulse (BVP) (Valenza, Lanata, & Scilingo, 2012; Verma &
Tiwary, 2014). These biosignals, being an activity of the CNS and/or ANS reveals the inherent state of the person which makes the suppression of emotions or social masking impossible. It is also a natural means of emotion recognition providing an opportunity to track minute emotional changes that are unseen by the natural eye (Rani & Sarkar, 2006).
Biosignal based emotion recognition is challenging because of the complex nature of biosignals and subjective nature of emotional states. Some of the challenges in physiological signals based emotion recognition are:
i) Biological sensing is invasive as it involves physical contact with the person.
However with the rapid advancement in technology such as conductive rubber electrodes, fabric electrodes and wearable computers, biological sensing can be made easier without any visible or awkward sensing systems (Picard et al., 2001).
© This
item is protecte
d by
original
copyr
ight
4
ii) Biosignals cannot be manipulated. Hence the different emotional states have to be elicited internally in the participant for proper data acquisition. Furthermore, emotions are subjective in nature. All the participants may not have the same emotional experience for the given emotional stimulus. Also, the same participant might experience a different emotion for the same emotional stimulus at a different instant of time. Hence, estimating the human emotional states is purely a subjective factor and finding a generalized solution for assessing the emotional states is quite challenging.
iii) Annotation of biosignals in emotion research is difficult. Modalities such as speech or image (facial actions and gestures) signals can be heard or seen respectively to understand the underlying emotional states by any person.
However, the one dimensional waveform of biosignals (changes of signal of amplitude over time) does not convey any information to the user. Hence, data labeling should be done with great care (Kim & Andre, 2008; Picard et al., 2001).
iv) Though biosignal research has been an active area over the past two decades, so far there hasn‟t been any standardization in key areas such as emotional model, stimulus, biosignal measures, features, pattern recognition and classification. An agreement on some of the conventions and guided principles would facilitate the integration of knowledge and expertise in the research community (Arroyo- Palacios & Romano, 2008).
Despite the challenges involved, the ability to capture the underlying and true emotional state of the participant using biosignal makes more important. Researchers have worked either on only one biosignal (unimodal) or on a combination of biosignals
© This
item is protecte
d by
original
copyr
ight
5
(multimodal) to capture the emotional information from HC participants (Daimi &
Saha, 2014; Lin et al., 2010; Soleymani, Pantic, & Pun, 2012; Verma & Tiwary, 2014;
Wang, Nie, & Lu, 2013). Most of the earlier works on HC participants have focused on analyzing EEG signal activities to assess the underlying emotional state of the person since the signal captured from the origin of the emotion genesis, (i.e., CNS), however, no study has yet been conducted in PD patients using EEG to investigate underlying true emotional state. The EEG signal is worked independently or in combination with other biosignals like ECG, EMG, SC and BVP (Verma & Tiwary, 2014; Wang et al., 2013). It should also be noted that some of the works on psychophysiology are user dependent and some others are user independent. Although, the performance of the emotion recognition systems developed so far depends on several factors such as the number of participants, number of emotions under consideration, the type of emotion elicitation stimuli, the number and location of placing the electrodes etc. The other factors concerned the PD patients themselves (motor disability, medication status, disease duration, illness severity). Hence more analysis is needed in order to develop a robust, reliable and automatic emotion recognition system for better clinical outcomes in patients with PD.
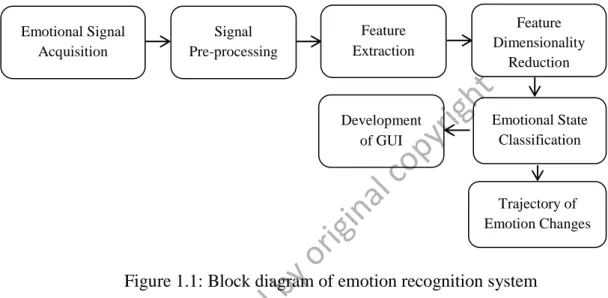
The block diagram of the proposed automatic emotion recognition system for PD patients is shown in Figure 1.1. The methodology of this research starts with design of emotion elicitation protocol and data acquisition process. Preprocessing is required to improve the signal to noise ratio by removing low frequency and high frequency noise.
Then, various linear and non-linear feature extraction methods are used to extract the significant emotional information from the recorded signals. Feature reduction methods helps to improve the system performance by reducing irrelevant emotional feature vectors. Classification plays an important role in categorizing the feature vectors into
© This
item is protecte
d by
original
copyr
ight
6
emotional states and hence it is required to use suitable classification algorithms. The trajectory of emotion changes helps to reflect the trend of emotion changes during data collection experiment. The methodology used in this research work is explained briefly in the subsequent chapters of this thesis.
Figure 1.1: Block diagram of emotion recognition system
1.2 Problem Statement
Non-motor symptoms including disruptions in emotional information processing (Dujardin et al., 2004), have been found in over 50% of newly diagnosed PD patients (Janvin, Aarsland, Larsen, & Hugdahl, 2003) and can appear in any stage of disease progression. Interestingly, social cognitive dysfunction has been found before the appearance of motor symptoms (Park & Stacy, 2009). Most of the research in this area dealt with PD patients behavioral measures i.e., PD patients were asked to categorize or to discriminate or to rate or to match the emotional stimuli and then statistical tools were used to analyse the obtained behavioral responses (Gray & Tickle-Degnen, 2010;
Péron et al., 2012; Sprengelmeyer et al., 2003). Such tasks involve executive abilities, which are known to be impaired in PD. May be this overall executive deficit causes impaired performances in evaluative emotion recognition and tasks (Pillon et al., 1996;
Emotional Signal Acquisition
Signal Pre-processing
Feature Extraction
Feature Dimensionality
Reduction
Emotional State Classification Development
of GUI
Trajectory of Emotion Changes
© This
item is protecte
d by
original
copyr
ight