Project Dissertation submitted to Universiti Teknologi PETRONAS Chemical Engineering Program has partially fulfilled the requirement for. I hereby certify that I am responsible for the work submitted in this project, that the original work is mine except as noted in the references and acknowledgments, and that the original work contained herein has not been taken or performed by unspecified sources or persons. PID controllers provide satisfactory performance and are widely used in many control processes due to their simplicity.
A model of each dynamic process is obtained to study their behavior using different types of tuning methods such as internal model control (IMC), SIMC, Ziegler-Nichols (Z-N) and Tyreus-Luyben (T-L). First of all, my deepest gratitude to God, who gave me strength and guidance to overcome the challenges and difficulties in completing the entire 28 weeks of my final year project. I would also like to salute my family for giving me great support from the beginning of my journey to the end.
My sincere appreciation goes to my supervisor, Dr Lemma Dendena Tufa for his patience in guiding me and his determination to make me learn as much as possible during my final year project period. Also not to forget to the Final Year Project Committee that organizing and managing my final year project to complete the course successfully.
INTRODUCTION
- B ACKGROUND OF S TUDY
- P ROBLEM S TATEMENT
- O BJECTIVES
- S COPE OF S TUDY
- R ELEVANCY AND F EASIBILITY OF P ROJECT
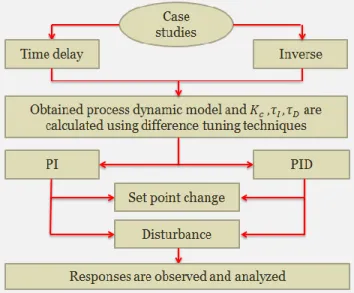
Dynamic processes such as time delay and inverse response are often present in process industries and are difficult to control. The time delay is the delay between when the controller output signal is issued until the measured process variable begins to respond. Some case studies of time delay and reverse feedback process are used to achieve the objectives of this project.
To test the performance of the PID controller using several tuning methods for improving the closed-loop performance of these processes. Test the performance of the PID controller using several tuning methods such as internal model control (IMC), SIMC, Zigler-Nichols (Z-N) and Tyreus-Luyben (T-L). The project will be based on performing proper tuning of the PID controller using different approach methods mainly IMC, SIMC, Z-N and T-L.
At the end of the given period, a detailed presentation will be made and the final report will be submitted to the coordinator. To meet the objectives on time, the project will focus on the objectives and purpose of the studies.
LITERATURE REVIEW
M ETHODS OF T UNING PID C ONTROLLER
The SIMC method is one of the best and easy methods to control processes with time delay and inverse response. Derive the amplitude ratio by replacing the value of s with and rearranging the model in terms of the phase angle. The value of Kcu and Pu can be calculated in the same way as before in the Ziegler-Nichols procedure.
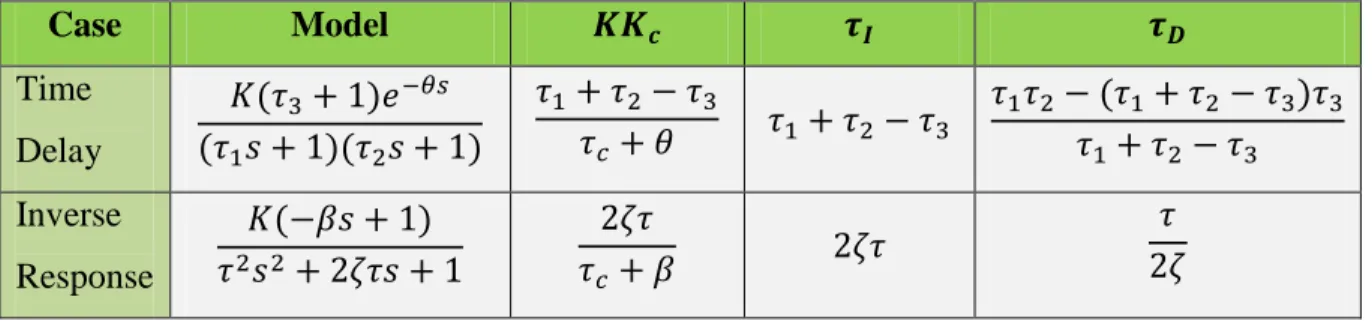
C ASE STUDY 1 - T IME DELAY PROCESSES
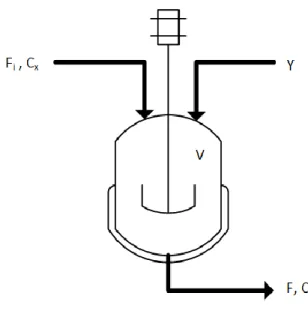
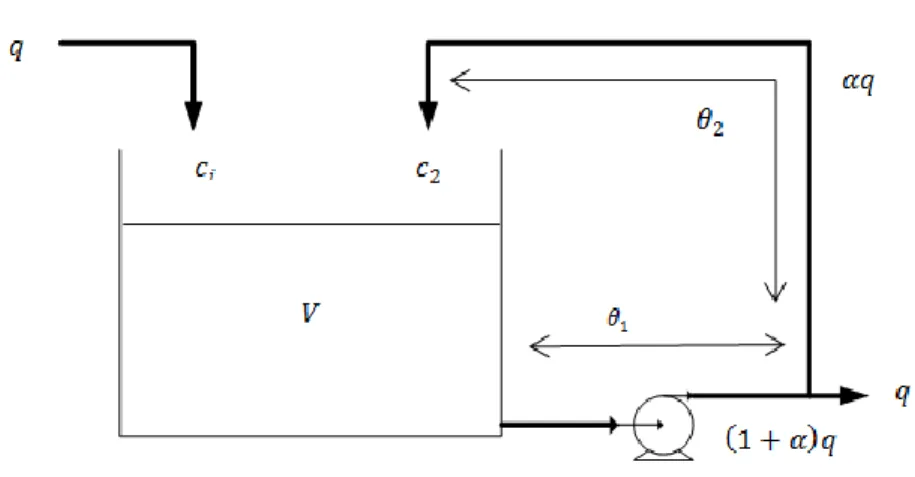
Based on the source bed catalytic reactor shown in Figure 1, the product uses recirculation to achieve satisfactory operating conditions for temperature and conversion. The concentration of the individual reactant and product is measured at a point in the recirculation line where the product stream is removed. The reactor operates isothermally with a reaction rate given by , where r denotes the reaction rate, C is the concentration of reactant and k is the rate constant.
The dynamics of the output and recycling lines can be approximated as constant time delays and as indicated in the figure. Additional relation is needed for and because the output and recycling lines can be modeled as time delays. So K and can be interpreted as respectively the process gain and the time constant of a recycle reactor with no time delay in the recycle line.
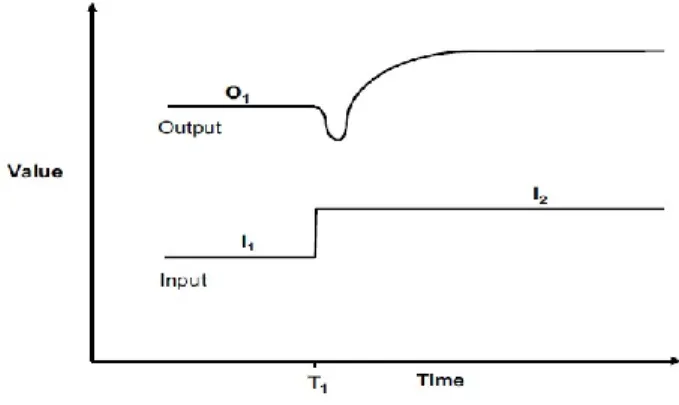
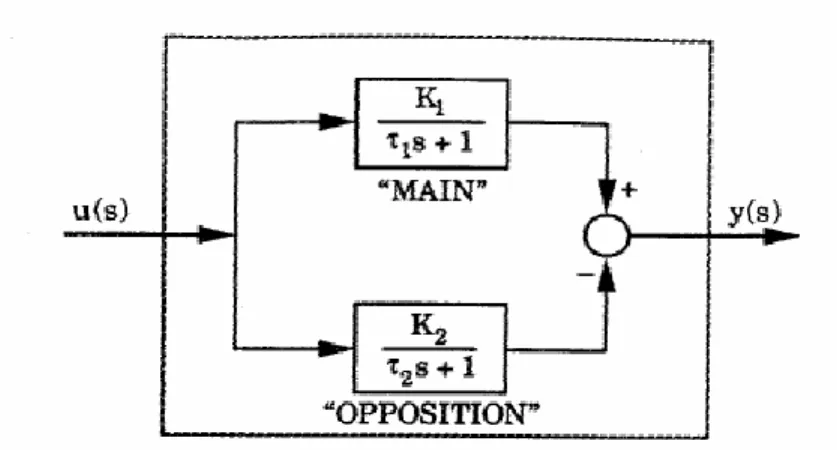
C ASE STUDY 2 - INVERSE RESPONSE
The transfer function for the inverse response process is given by Equations (1-3) and (1-2), where K1 and K2 are the gains for the main process and the opposite process, respectively. 1 ) 1. Alfaro, control industrial processes illustrating the inverse response is one of the challenging tasks to be performed by the engineer in order to achieve a better performance and level of robustness [8]. A CSTR was considered in which the concentration of two chemicals, the chemicals ethylene oxide (X) and water (Y) and the by-product ethylene glycol (Z) are controlled for better results.
Where rx and rz represent the generation rate of species X and Z per unit volume and Cxi represents the inlet concentration of species X.
RESEARCH METHODOLOGY
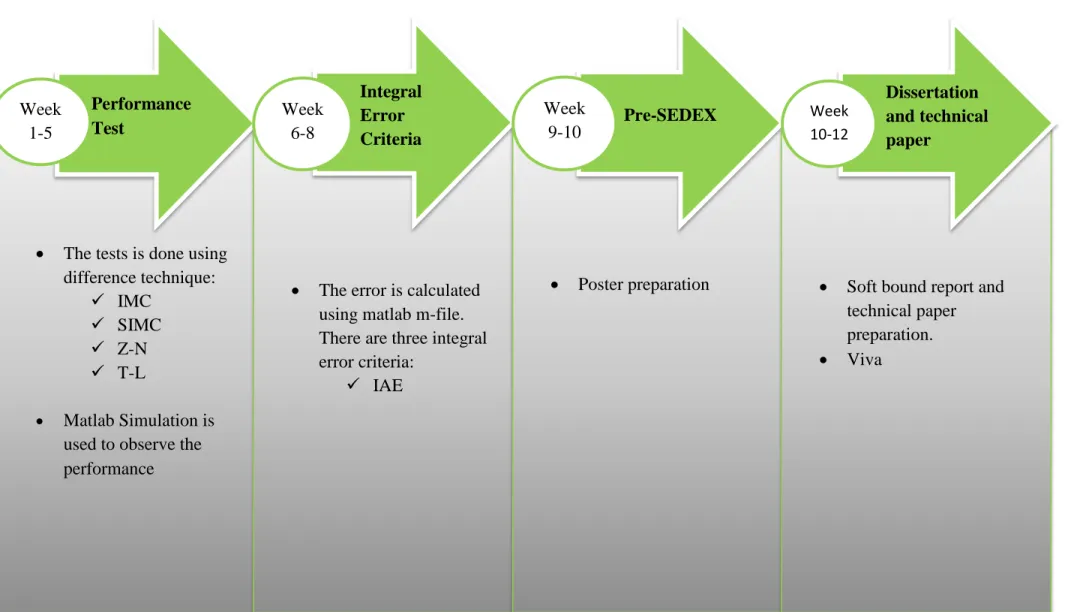
- P ROJECT A CTIVITIES
- K EY M ILESTONE
- G ANTT C HART
- T OOL
Matlab Simulation Calculation of Integral Error Criteria τc iteration of Matlab m file for IMC method Microsoft Excel.
RESULT AND DISCUSSION
C ASE S TUDY I – T IME D ELAY P ROCESS
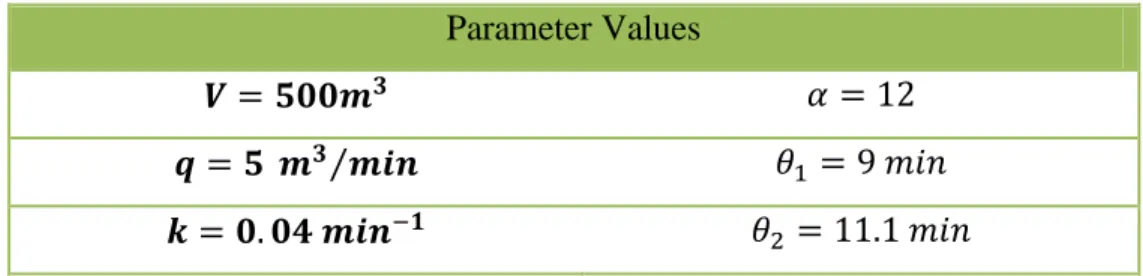
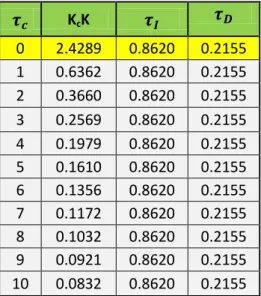
For time delay process, the value of is obtained using trial and error, from to 10.0. From the literature review, the value of and can be calculated using the following values for time delay. The simulation result in Figure 8 indicates a graph of PI controller responses with change in set point at the beginning and present in disturbance at 700s using SIMC, Z-N and T-L tuning methods.
From the graph, the SIMC method shows the slowest response to setpoint change and produces the highest disturbance overshoot. Whereas Z-N shows little overshoot at the beginning of the set point change and provides much better disturbance rejection. On the other hand, the T-L controller provides excellent set point response compared to others that have significant overshoot and longer settling times.
A graph of the response of the PID controller with the change of the set point at the beginning and the disturbance rejection at 550s is shown in Figure 10 using the IMC, SIMC, Z-N and T-L methods. The best PID controller responses is the T-L method as it shows the fastest response (small settling time) and also less overshoot compared to other tuning methods. However, SIMC shows the slowest response with large swing in set point change and disturbance rejection.

C ASE S TUDY II – I NVERSE R ESPONSE
For inverse response, the value of is obtained by trial and error, starting from to 10.0. From the literature review, the value of and can be calculated using the following values for time delay and inverse response. The SIMC method shows the slowest response when the set point change is introduced and gives a large overshoot when there is disturbance.
IMC also shows good interference rejection, showing the least overshoot compared to other methods.
S UMMARY OF DATA ANALYSIS
CONCLUSION
Alfaro, V.M., A robustness consideration in PID tuning for regulatory control of inverse feedback processes, in IFAC Conference on Advances in PID.
![Table 3 shows the controller setting based on continuous cycling method [4].](https://thumb-ap.123doks.com/thumbv2/azpdforg/10256771.0/15.918.217.826.754.885/table-shows-controller-setting-based-continuous-cycling-method.webp)
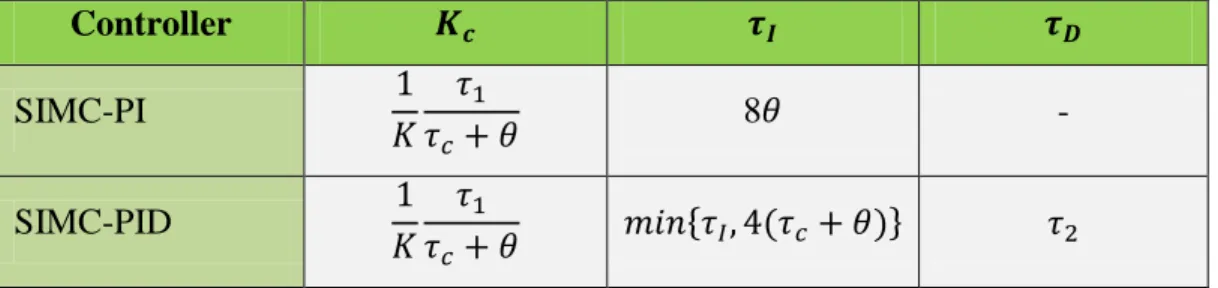
![Table 4 below shows the value of parameters and for controller setting of PI and PID [4]](https://thumb-ap.123doks.com/thumbv2/azpdforg/10256771.0/16.918.213.827.416.514/table-shows-value-parameters-controller-setting-pi-pid.webp)