Monitoring Solar Data near Equator
by
Irwan Haadi Bin Mahadzir
A project dissertation submitted to Mechanical Engineering Programme
Universiti Teknologi PETRONAS In partial fulfillment of the requirements for
Bachelor of Engineering (Hons.) (Mechanical Engineering)
Universiti Teknologi PETRONAS
Bandar Sen Iskandar 31750 Tronoh
Perak Darul Ridzuan, MALAYSIA
CERTIFICATE OF ORIGINALITY
This is to certify that I am responsible for the work submitted in this dissertation, that the original work is my own concept as specified in the references and acknowledgement, and that the original work contained herein have not been taken or done by unspecified
sources or persons.
IRWAN HAADIB. MAHADZIR
*
%&-.r-*»h
o bDr. Syed Ihtisham-ul-Haq Gilani
Senior Lecturer
Mechanical Engineering Programme Universiti Teknologi PETRONAS
31750 Tronoh
Perak Darul Ridzuan, MALAYSIA.
ABSTRACT
In this project, the purpose of solar monitoring data at UTP is to act as a stepping stone for other related projects in utilizing the energy from the sun (solar energy). Although the original intention of this project is to monitor the solar data at UTP, equipment setups at USM and UKM (auto-monitoring system) were used since it uses more accurate equipments. Besides that, experimental data from Metrological Department were also analyzed for verification and comparison purposes.The scope of study includes literature review, data collecting process (using equipments setup) and data analysis. For the methodology section, the procedures involved are data collection process (using three equipment setups); and data analysis. There are tables regarding values of solar radiation and other parameters such as temperature, relative humidity and wind speed in the result section, followed by discussion to analyze the readings taken. In the last section, the readings from all the sources are compared and the solar radiation patterns are also concluded. Recommendation was made based on the conclusion. Upon completing this Final Year Project, the student able to appreciate the importance of solar data monitoring in utilizing solar energy as an alternative energy source.
n
ACKNOWLEDGEMENT
In the name ofAllah the Almighty, the most Merciful and the most Graceful
First of all, praise to Allah the Almighty for giving the author the strength to complete the task given. The author wishes to take this opportunity to express his deepest gratitude and thanks to the following individuals and groups for their support and kindness that they give in completing this Final Year Project (FYP):
1. Dr. S. I. Gilani (supervisor for the FYP) for his views, guidance, recommendations and intuitive wisdom in completing the project.
2. Mr. Rahmat Iskandar and Ir. Shiraz for help and recommendation during the preliminary stage of this project.
3. Mr Zailan (technician) for his advice and recommendation on the setup of the project, and kindly allowed the author to borrow the university's equipments.
4. Mohamad Rizal Ismail, Khaidir Adli Mustapa Kamal, Muhammad F.A. Mohd.
Kamaluddin and other colleagues for lending their hand and equipment as well as giving their moral support throughout the completion of this project.
5. Family members for their enthusiasm in this project and their selfless supports.
Lastly, the author like to thank all those involved directly or indirectly in helping and guiding the author to achieve the objectives of this Final Year Project and in completing this final report.
i n
TABLE OF CONTENTS
CERTIFICATION
ABSTRACT .
ACKNOWLEDGEMENT .
TABLES OF CONTENTS .
APPENDICES
ABBREVIATIONS AND NOMENCLATURE RS
CHAPTER 1: INTRODUCTION .
1.1 Background of Study .
1.2 Problem Statement
1.3 Objective and Scope of Study 1.3.1 Objective
1.3.2 Scope of Study
CHAPTER 2: LITERATURE REVIEW AND/OR THEORY
2.1 Literature Review.
2.1.1 Types of Solar Radiation 2.1.2 Basic Types of Instruments .
2.1.3 Method to Record Solar Data.
2.1.4 Solar Radiation Data.
2.2 T h e o r y . . . . .
IV
11
Ill
IV
vii
IX
5 5 5 6 10 12 13
CHAPTER 3:
CHAPTER 4:
CHAPTER 5:
REFERENCES
APPENDICES
METHODOLOGY/PROJECT WORK . 14
3.1 Equipment Setup in UTP 15
3.1.1 Solarimeter / Photo Radiometer 15
3.1.2 K Thermocouple Thermometer 16
3.2 Experimental Setup in USM . 17
3.2.1 Setup A. 17
3.2.2 Setup B 18
3.3 Experimental Setup in UKM . 20
3.3.1 Solarimeter / Pyranometer 20 3.3.2 Thermocouple Input Module . 20
3.3.3 Signal Converter 21
3.3.4 Computer 21
RESULTS AND DISCUSSION
4.1 Experiment in UTP . 4.2 Experiment in USM . 4.3 Experiment in UKM .
23 23 27 31
4.4 Experimental Data from Metrological Department 33
CONCLUSION AND RECOMMENDATION
5.1 Conclusion . . . .
5.2 Recommendation
38 38 39
40
41
Table 4.1
Table 4.2
Figure 2.1 Figure 2.2 Figure 2.3
Figure 2.4
Figure 2.5 Figure 3.1 Figure 3.2 Figure 3.3 Figure 3.4 Figure 3.5 Figure 3.6
LIST OF TABLES
Readings of solar radiation and temperature on Monday (29/9/03), Wednesday (1/10/03) and
Thursday (2/10/03) . . . .
Data taken at USM between 9am to 5pm on Saturday (21/2/2004).
LIST OF FIGURES
23
28
Eppley Precision Spectral Pyranometer . . 6 Effects of inclination of pyranometers on calibration. 7 Cross section of the Eppley Normal Incidence
Pyrhehometer . . . 9
Eppley Normal Incidence Pyrhehometer (NIP) on
a tracking mount . . . 10
Typical shade ring correction factors . . . 11 Flowchart of project methodology . . . 14
Photo radiometer . . . . . 16
K thermocouple thermometer. . . . 16
Setup A (Solarimeter with Integrator). . . 18 Setup B (Standard Solar Cell and Multimeter) . 19
Equipment setup in UKM . . . . 22
v i
Figure 4.1 Patterns of solar radiation versus time on Monday (29/9/03), Wednesday (1/10/03) and
Thursday (2/10/03) 24
Figure 4.2 Patterns of temperature versus time on Monday (29/9/03), Wednesday (1/10/03) and
Thursday (2/10/03) 24
Figure 4.3 Relationship Between Solar Radiation and
Temperature on Monday (29/9/03) . . . 25 Figure 4.4 Relationship Between Solar Radiation and
Temperature on Wednesday (1/10/03) . . 25 Figure 4.5 Relationship Between Solar Radiation and
Temperature on Thursday (2/10/03) . . . 26 Figure 4.6 Pattern of global solar radiation versus time on
Saturday (21/2/04) 29
Figure 4.7 Pattern of ambient temperature versus time on
Saturday (21/2/04) 29
Figure 4.8 Pattern of global solar radiation versus time on
Wednesday (21/1/04) 31
Figure 4.9 Pattern of temperature versus time on
Wednesday (21/1/04) 31
Figure 4.10 Relationship between hourly average monthly
solar radiation and temperature in Ipoh for 2003 . 33 Figure 4.11 Relationship between hourly average monthly solar
radiation and relative humidity in Ipoh for 2003 . 33 Figure 4.12 Relationship between average hourly solar
radiation and temperature on a sunny day (15/4/03) . 34 Figure 4.13 Relationship between average hourly solar radiation
and temperature on a rainy day (9/12/03) . . 34 Figure 4.14 Relationship between average hourly solar radiation
and temperature on a mix pattern day (12/12/03) . 35
v n
Figure 4.15
Figure 4.16
Figure 4.17
APPENDIX A APPENDIX B APPENDIX C APPENDIX D
Relationship between solar radiation and temperature on March 2003 .
Relationship between solar radiation and relative humidity on March 2003
Relationship between relative humidity and wind speed on March 2003 . . . .
LIST OF APPENDICES
PYRANOMETER CM 6B .
SOLARIMETER INTEGRATOR CC2
EXPERIMENTAL DATA FOR MARCH 2003
DATA ACQUISITION SYSTEM (DASYLAB)
v m
36
36
37
42 43 44 48
ABBREVIATIONS / NOMENCLATURES
d solar declination angle
Et equation of time
Ib direct / beam radiation
Id diffuse radiation
IG global radiation
j day of the year/100
/ latitude of the site
Lc longitude correction
So potential solar radiation
t clock time
to time of solar noon
UKM Universiti Kebangsaan Malaysia
USM Universiti Sains Malaysia
UTP Universiti Teknologi Petronas
O elevation angle of the sun
IX
CHAPTER 1
INTRODUCTION
1.1 BACKGROUND OF THE STUDY
Solar energy plays an important role in meeting the world's energy demand. The use of non-renewable energy such as fuels has many side effects. Their combustion products produce pollution, acid rain and global warming. Furthermore, solar energy sources are more environment friendly which improve the living quality in the world; not only for
humans but also for its flora and fauna as well.
Realizing the need of solar energy, methods of solar energy conversion system have to be developed and used to substitute the non-renewable energy. Therefore, extensive research and development in solar energy utilization technologies have to be carried out. But, in order to achieve these, the initial step which is monitoring solar data has to be done first to study the characteristics and patterns of solar energy.
The purpose of solar monitoring data at UTP is to utilize the energy from the sun (solar
energy) and use it as an alternative energy. This project will also enhance the understanding of solar concept. In the past, there was no attempt to monitor the solar
radiation in UTP. The solar radiation data gathered will then be available for further work analysis. One of the examples is utilizing the solar energy using solar pond.In this project, the study emphasizes on the relationship between solar radiation and other
related parameters. These parameters are ambient temperature, relative humidity and
wind speed. Based on the relationship, the pattern of solar radiation can be predicted
through plotted graphs.1.2 PROBLEM STATEMENT
1.2.1 Problem Identification
Since the launching of UTP in 1997, there has been no attempt to gather any information on the solar radiation. This is unfortunate since there are enormous exposures of sun in Tronoh, Perak. By monitoring solar data near equator, analysis can be done to implement it as a clean energy sources.
For this project, solarimeter is the main equipment used to collect the solar radiation. In UTP, there is only photo radiometer available. Because of this limitation, the equipment setup was done at USM using more accurate equipment. Both of the equipment setups in UTP and USM require manual monitoring and this cause a problem to obtain a continuous day-to-day data.
Due to this problem, visits have been made to UKM to learn the auto-monitoring system.
Regarding the solar data from the UKM, they only permit one sample of solar radiation data since the data has not yet been publicized. Using these data, only limited analysis can be done. They also did not unveil the full setup of the patterned solar monitoring
system.
Besides that, only global solar radiation is measured in UTP, UKM and USM due to limited equipments. This is inopportune because with the addition of direct or diffuse solar radiation, comparison can be made using theoretical calculations to the experimental values.
1.3 OBJECTIVE AND SCOPE OF STUDY
1.3.1 Objective
The main objectives of this project are to monitor the solar data at UTP (4° 25'N, 100°59'E) and compare it with the data sets from various sources. There are five (5)
parameters being considered; which are:
a. Direct solar radiation b. Diffuse solar radiation c. Ambient temperature d. Wind velocity e. Relative humidity
Other objectives include data analysis for recommendations and to act as a stepping stone
for other related solar projects.
1.3.2 Scope of study
The scope of project is divided into three stages. The first stage is the literature review of all elements that are related to the project which more towards the planning of the project.
This includes books, journals and websites regarding other solar monitoring project and the equipment used. All of the findings will be discussed with supervisors. In the beginning, the study focuses on the examples of solar radiation data from other sources.
This is important for reference, comparison and verification purposes. Besides that, various of equipment setups for solar monitoring project were also reviewed. This includes types of solarimeter with different accuracy and functions.
For the second stage, equipments used will be set up and all the relevant information/
data will be gathered. The first step in this stage is to take sample readings in UTP using photo radiometer (to measure solar radiation) and thermometer (to measure ambient temperature). Readings are also taken at USM using two different setups; and at UKM using auto-monitoring system. All the methods learned during the first stage are applied during the second stage of the project.
Finally, the solar data gathered will be analyzed using graphs to see the patterns of various parameters. Experimental data from Metrological Departmentwere also analyzed for verification and comparison purposes. Further recommendations will be made for future work using solar energy.
CHAPTER 2
LITERATURE REVIEW AND THEORY
2.1 LITERATURE REVIEW
2.1.1 Components of solar radiation
Basically, there are two components of solar radiation which are direct and diffuse solar radiation. Global solar radiation (Iq) is the sum of both direct and diffuse solar radiation.
a. Direct / beam radiation - Solar radiation received from the sun without being scattered by the atmosphere, lb
b. Diffuse radiation - Solar radiation received from the sun after its direction has been changed (scattered) by the atmosphere, Id
2.1.2 Basic types of instruments measuring solar radiation
a. Pyranometer / Solarimeter
Pyranometers are used for measuring global solar (beam plus diffuse) radiation,
and it is from these instruments that most of the available data on solar radiation are obtained. The detectors for these instruments must have a response independent of wavelength of radiation over the solar energy spectrum. In addition, they should have a response independent of the angle of the incidence of the solar radiation. The detectors of most pyranometers are covered with one or
two hemispherical glass covers to protect them from wind and other extraneous effects; the covers must be very uniform in thickness so as not to cause uneven
distribution of radiation on the detectors.
There are many types of pyranometers. One of them is the Eppley Black and White pyranometer which utilizes Parson's black and barium sulfate coated hot and cold thermopile juctions. It has a good angular (cosine) response, uses an optically ground glass envelope and temperature compensation too maintain calibration within j^l.5% over a temperature range of -20 to 40°C. The Eppley Precision Spectral Pyranometer (PSP) (refer figure 2.1) is another type of pyranometer which utilizes a thermopile detector, two concentric hemispherical optically ground covers, and temperature compensation that results in temperature dependence of 0.5% from -20 to 40°C. There is also type of pyranometer which is based on photovoltaic (solar cell) detectors such as the Yellott Solarimeter. They are less precise instruments than the thermopile instruments but also less expensive and are easy to use.
v*;--> *.». f
Figure 2.1: Eppley Precision Spectral Pyranometer
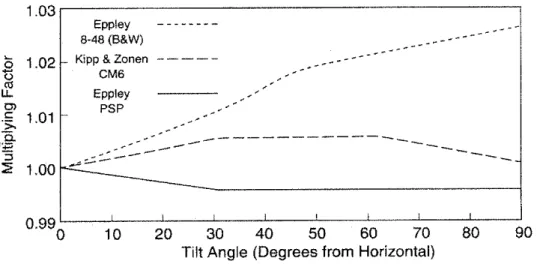
Measurements of solar radiation on inclined planes are important in determining the input to solar collectors. There is evidence that the calibration of pyranometers changes if the instrument is inclined to horizontal. The reason for this appears to
be changes in the convection patterns inside the glass dome, which changes the manner in which heat is transferred from the hot junction of the thermopiles to the cover and other parts of the instrument. From figure 2.2, it is evident that the calibration of pyranometers is to some degree dependent on inclination and that experimental information is needed on particular pyranometer in any orientation to adequately interpret information from it.
1.03
o 1.02
0.99
Eppley 8-48 (B&W) Kipp & Zonen
CM6
0 10 20 30 40 50 60 70 80 90
Tilt Angle (Degrees from Horizontal)
Figure 2.2: Effects of inclination of pyranometers on calibration
Pyranometers are usually calibrated against standard pyrheliometers. A standard method has been set forth in the Annals of the International Geophysical Year, which requires that readings be taken at times of clear skies, with the pyranometer shaded and unshaded at the same time as readings are taken with the pyrhehometer. Shading is recommended to be accomplished by means of a disc held one meter from the pyranometer with the disc just large enough to shade the glass envelope. The calibration constant is then the ratio of the difference in the output of the shaded and unshaded pyranometer to the output of the pyrhehometer multiplied by the calibration constant of the pyrhehometer and the angle of incidence of beam radiation on the horizontal pyranometer.
b. Pyrheliometer
Pyrheliometers are instruments which can only reads the direct beam radiations.
The water flow pyrheliometer, designed by Abbot in 1905, was an early standard instrument. This instrument uses a cylindrical blackbody cavity to absorb radiation which is admitted through a collimating tube. Water flows around and over the absorbing cavity. The measurement of its temperature and flow rate provides the means for determining the absorbed energy.
Standard pyrheliometers are not easy to use, and secondary standard instruments have been devised that are calibrated against the standard instruments. One of the secondary standard pyrheliometer is the Abbot silver disc pyrheliometer, which
uses a silver disc 38 mm in diameter and 7 mm thick as the radiation receiver. The
side exposed to the radiation is blackened and the bulb of a precision mercury thermometer is inserted in a hole in the side of the disc to enhance good thermal contact. A shutter alternately admits radiation and shades the detector at regular intervals; the corresponding changes in disc temperature are measured and provide the means to calculate the absorbed radiation.
Operational and field instruments are calibrated against secondary standards.
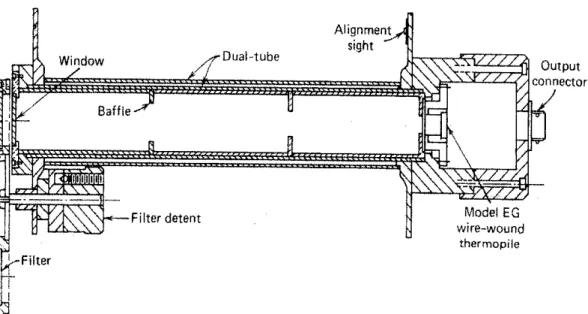
These are instruments which the source of most of the data on which solar process engineering designs must be based. The Eppley Normal Incidence Pyrheliometer (NIP) is the instrument in most common use in the United States for measuring beam solar radiation and the Kipp & Zonen instrument is in wide use in Europe.
For the Normal Incidence Pyrheliometer (refer figure 2.3 and 2.4), the detector is at the end of the collimating tube, which contains several diaphragms and blackened on the inside. The detector is a multijunction thermopile coated with Parsons optical black. Temperature compensation is provided to minimize sensitivity to variations of ambient temperature. The aperture angle of the
instrument is 5.7°.
In pyrheliometers, the dimensions of the collimating systems are such that the detectors are exposed to the radiation from the sun and from a portion of the sky around the sun. Since the detectors do not distinguish between forward-scattered radiation, which comes from the circumsolar sky, and beam radiation, the instruments are in effect defining beam radiation. An experimental study which utilized several length of collimating tubes so that the aperture angles were reduced in step from 5.72° to 2.02°, indicated that for cloudless conditions this reduction resulted in insignificant changes in the measurement of beam radiation.
On a day of thin uniform cloud cover, however, with solar altitude angle of less than 32°, as much as 11% of the measured intensity was received from the circumsolar sky between aperture angles of 5.72° and 2.02°. It appears that thin clouds or haze can affect angular distribution of radiation within the field of standard pyrheliometers.
Model EG wire-wound
thermopile
Output
connector
Figure 2.3: Cross section of the Eppley Normal Incidence Pyrheliometer
Figure 2.4: Eppley Normal Incidence Pyrheliometer (NIP) on a tracking mount
2.1.3 Methods used to record the solar radiation data
There are many methods used to record the solar radiation data. For many years, it has
been recorded using manually operated metrological stations. This measurement wasoriginally developed as a means of recording integrated global solar radiation, before the
advent of electronics. Now, there are more appropriate ways of recording solar radiationfor scientific purpose, using modern instruments and datalogging systems. One of the
modern instruments used is a tracking pyrheliometer, where a collimated sensorautomatically moves to track the movement of the sun. The disadvantage of using this
instrument is that it can only sense the direct beam radiations.10
An alternative technique which does not involve any moving parts is the combination of two pyranometers, one with shadow ring and one which is normally exposed to record total global radiation. The ring is used to allow continuous recording of diffuse radiation without the necessity of continuous positioning of smaller shading devices; adjustments need to be made for changing declination only and can be made every few days. The ring shades the pyranometer from part of the diffuse radiation, and a correction for this shading must be estimated and applied to the observed diffuse radiation. The corrections are based on assumptions of the distribution of diffuse radiation over the sky and typically are factors of 1.05 and 1.2. The difference between the global radiation and diffuse radiation measurements is the direct beam component.
ir. Ap> Muy .JMMir Jy|, «1, Niiy, lltT
Figure 2.5: Typical shade ring correction factors
11
2.1.4 Solar radiation data
Solar radiation data are available in several forms. The information about radiation data
such as whether they are instantaneous measurements (irradiance) or values integrated over some period of time (irradiation); the time or time period of the measurements;
whether the measurements are of beam, diffuse or total radiation; the instruments used;
the period over which the data are averaged (for averaged data) and the receiving surface orientation (horizontal or inclined) are important in their understanding and use. Most
radiation data available are for horizontal surfaces, include both direct and diffuse radiation, and were measured with thermopile pyranometers. Most of these instrumentsprovide radiation records as a function of time and do not provide a means of integrating
the records.
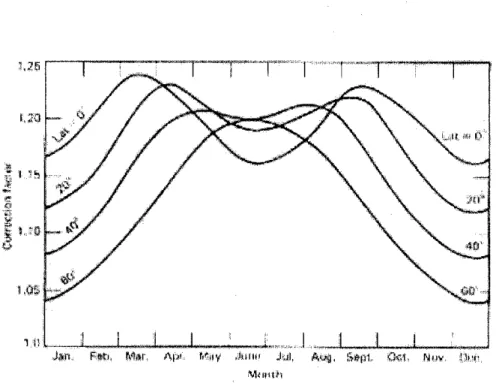
There are two types of solar radiation data which are widely available. The first type is monthly average daily total radiation on a horizontal surface. These data are widely
available and can be obtained from many weather stations. The second type is hourly total radiation on a horizontal surface for each hour, taken for extended periods such asone or more years. Recent laboratory measurements and the averages base thereon are probably accurate to + 5%. Errors in readings are commonly caused by inadequate
calibration and care in using the instruments.
12
2.2 THEORY
The potential solar radiation (So) on a horizontal surface outside the earth's atmosphere is
calculated in Wm" from;
(So) =1373 sin O
where O is the elevation angle of the sun. Sin O is computed from :
sin O = sin d sin / + cos d cos / cos [15(t-to)]
where d is the solar declination angle, / is the latitude of the site, t is clock time and to is
the time of solar noon.
In order to measure the solar decimation angle of the device, it is advisable to approximate the sin d using a polynomial.
Sin d = -0.37726 -0.10564J + 1.2458 j2- 0.757478 j3 + 0.13627 j4- 0.0572 j5
j = Day of the year /100
The time of solar noon is given by:
to=12-Lc-Et(hr) Lc = Longitude correction Et - Equation of time
Longitude correction also can be calculated by using the formula:
Lc-(Ls-L)/15
Solar constant, the mean radiation flux density outside of the earth's atmosphere is 1367
Wm2.
13
CHAPTER 3
METHODOLOGY
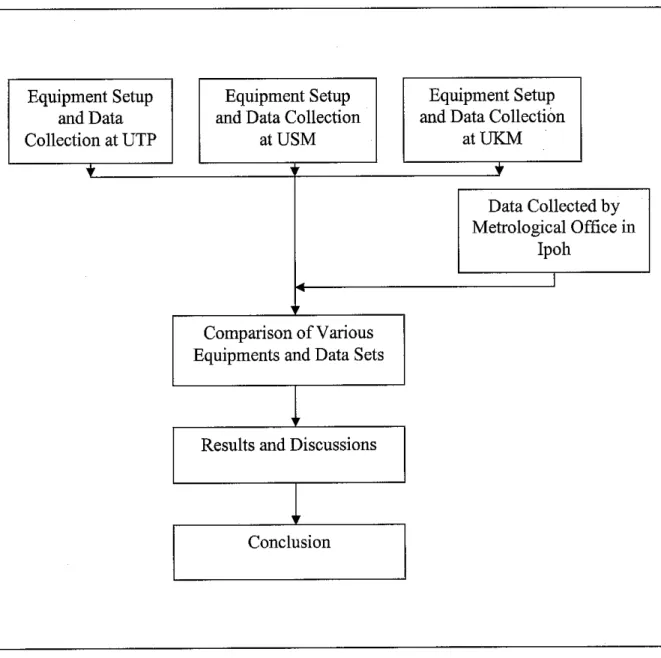
In order to proceed with the project, a clear and concise methodology is important to ensure that the flow of the project would be smooth and organized. In this project, there are three main setups used in various locations to provide sufficient data.
Equipment Setup
and Data Collection at UTP
Equipment Setup
and Data Collection at USM
Equipment Setup
and Data Collection at UKM
i i r V
Data Collected by Metrological Office in
Ipoh
1
1r
Comparison of Various Equipments and Data Sets
i'
Results and Discussions
i'
Conclusion
Figure 3.1: Flowchartof project methodology
14
3.1 EQUIPMENT SETUP AT UTP
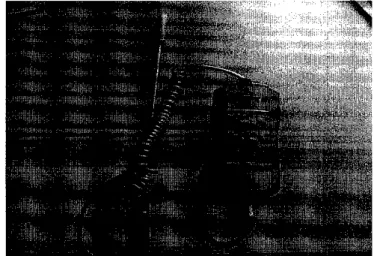
3.1.1 Solarimeter / Photo Radiometer
Photo radiometer is the only type of solar radiation measuring instrument available in UTP. The instrument may be fitted with interchangeable probes for measuring illuminance, irradiance and luminance. In the case of solar radiation, the radiometric probe (irradiance meter cosine corrector) is connected to the instrument and the unit used is Watt/m2. It can only be used to measure the direct solar radiation. The radiometer has measuring ranges from 10 microWatt/cm2 to 200miliWatt/cm2 and precision of + 4%.
In term of application, there is only ON/OFF switch on the instrument. In order to obtain reliable measurements, sudden variations of lights, or any influence of the undesired reflections and shadows has to be avoided. Nearby high frequency sources, microwaves or large magnetic fields may also create electromagnetic disturbance in the sensor of the
instrument.
The photo radiometer is calibrated yearly. The calibration is done on two parts: the instrument itself and the probe. For calibration of the instrument, the photometric simulator (instead of the probe) is inserted into the connector. Button PI is pressed so that the display shows the value of simulator. For the probe, it is fitted into the photometric bench. Trimmer Tl of the amplification and calibration circuit is turned on until the value shown on the display coincides with the reference value.
15
IF 1 . | J U *
JK?^ •*:.#•-••-''•••
Figure 3.2: Photo Radiometer
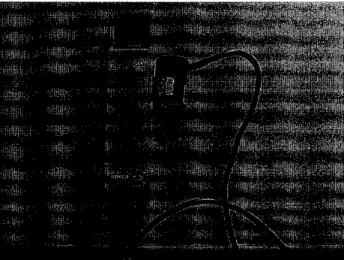
3.1.2 K Thermocouple Thermometer
This instrument allows temperature measurements using K-type thermocouple probe. The non linearity of the temperature probe is linearized by the build-in compressor, in order to achieve high degree accuracy and resolution. Measurement can be performed on either Centigrade or the Fahrenheit scale with range from -50°C to 950°C (-58°F to 1742°F).
The instrument has an accuracy of + 0.2% and calibrated yearly. In this project, the thermometer is particularly used for measuring ambient temperature of the surrounding.
Figure 3.3: K Thermocouple Thermometer
16
3.2 EQUIPMENT SETUP AT USM
3.2.1 Setup A
a. Solarimeter / Pyranometer
Pyranometers are radiometers designed for measuring the irradiance on a plane surface, resulting from radiant fluxes in the wavelength range from 0.3 to 3 micrometers. It is used to measure solar radiation, in this case global solar radiation. Inside the pyranometer, there is photodiode which transform the intensity of the sun and convert it to electrical signal. It has accuracy of + 5% and sensitivity ranging from 9 to 15
LiV/Wm2. In term of application, the pyranometer is placed on the roof of the Physics
building to get uninterrupted solar radiation. Since it requires no power supply, it is directly connected to the solarimeter integrator via wiring. In order to obtain reliable measurements, sudden variations of light sources, or any influence of the undesired reflections and shadows has to be avoided during the experiment.
b. Solarimeter Integrator
In this setup, the inputs from the equipment are connected to the solarimeter integrator to obtain the solar radiation readings. The solarimeter integrator has been developed for the integration of low voltages. It has accuracy better than 0.5%. For obtaining a stable operation of the instrument, the small input signals are amplified by means of chopper stabilized amplifier. The output signal of the amplifier is fed to the integrator. This integrator gives for a constant Voltage time product a pulse to the printer unit thus increasing the value of integral counter with 1. One count at the integral counter is equal
to energy of 0.1 J.cm2 if the proper calibration constants are set at the instrument.
Originally, the measurements can be printed out on a paper strip, but due to malfunction of the printer, the readings have to be recorded manually.
17
Figure 3.4: Setup A (Solarimeter with Integrator)
3.2.2 Setup B
a. Standard Solar Cell
This equipment is more or less similar to the photo radiometer used in UTP. It was made
by En. Jamil Kassim (technician in-charge of physics department), and calibrated under
control lightings. This equipment is a cheap alternative to the solarimeter. It is used mainly as a verification and comparison purpose to Setup A.In term of operation, it is connected to a multimeter to get the solar radiation readings.
b. Multimeter
For this setup, multimeter is used together with the standard solar cell. It is set to miliAmpere (mA) mode to obtain the readings. It is then converted to Wattjoule/meter
square (Wj/m2) using conversion graph. Since there is no datalogger, all the readings of
the solar radiation have to be recorded manually.
Figure 3.5: Setup B (Standard Solar Cell and Multimeter)
c. Thermometer
This instrument allows temperature measurements in the Centigrade scale. In this project, the thermometer is particularly used for measuring ambient temperature of the
surrounding. It can measure up to 0.5°C intervals.
19
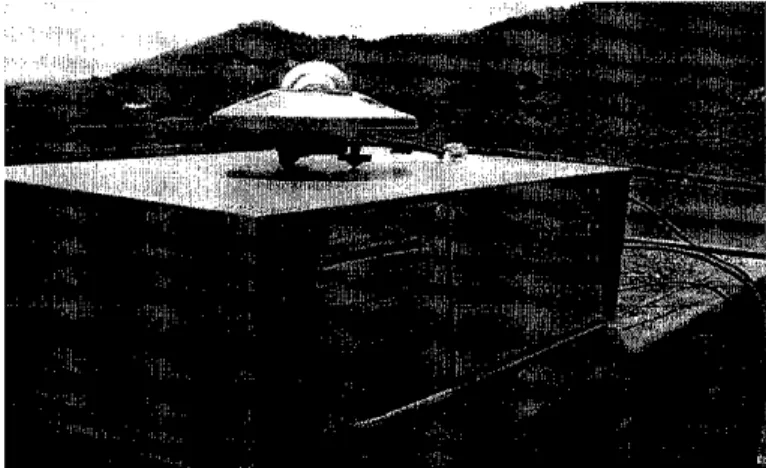
3.3 EQUIPMENT SETUP AT UKM
3.3.1 Solarimeter / Pyranometer
Pyranometers are radiometers designed for measuring the irradiance on a plane surface, resulting from radiant fluxes in the wavelength range from 0.3 to 3 micrometers. It is used to measure solar radiation, in this case global solar radiation. Inside the pyranometer, there is photodiode which transform the intensity of the sun and convert it to electrical signal. It has accuracy of + 5% and sensitivity ranging from 9 to 15
uV/Wm2. In term of application, the pyranometer is connected to the thermocouple input
module. It is placed on a surfaced area under the sun, and in order to obtain reliable measurements, sudden variations of light sources, or any influence of the undesired
reflections and shadows has to be avoided.
3.3.2 Thermocouple Input Module
In the auto monitoring setup, the inputs from the equipment are connected to an 8- channel Thermocouple Input Module. The ADAM-4017/4018 is used as a 16-bit,8- channel analog input module that provides programmable input ranges on all channels.
This module is an extremely cost-effective solution for industrial measurement and monitoring applications. Its opto-isolated inputs provide 3000 V DC of isolation between the analog input and the module, protecting the module and peripherals from damage due to high input-line voltages. It is then connected to ADAM-4520/4522 which is the signal
converter.
20
3.3.3 Signal Convert°r
Since there is a distance (around 20 metres) between the equipment setup and the computer, ADAM-4520/4522 is used as a long distance communication system with standard PC hardware. The ADAM-4520/4522 converter takes the advantage of RS-422 and RS-485 on systems originally equipped with RS-232. It transparently converts RS- 232 signals into RS-422 or RS-485 signals. By doing that, there is no change needed in the PC's hardware or software. The system requires two units; one at the equipment setup as the output unit and the other near the computer as the input unit (connected via wiring).
3.3.4 Computer with Data Acquisition System (DASyLAB) software
From the signal converter, it is connected straight away to the computer. Data Acquisition System (DASyLAB) software is used to record all the data automatically;
and it can be run 24 hours with required intervals. The intervals can be set as small as ten seconds, (refer appendix D for more details)
21
Computer Signal Converter
Figure 3.6: Equipment Setup in UKM
22
as
H o)—<c«CO&UCO CDo"S,&OwCD-4-»o•I—(CD•HooCDJ-H<D
Q t/1
a^jT3^^cdHcd
Hop^
CO -<-<
T3CD
O-g
oo
1
<uOhXCD
CD
I
C3•a<DOdCDCD
CD
COo•I—i
Id5-1
(DJ3
•aCD
CD1Oh
CD
CD'CD
ao T3CDoT3CD•cCD>CD8c3CD13CDHt-.CD-j-tCD
1
p. CMHPHH3
Temperature
(°C)
CD
2
CD N N s o s n n co cm co o cm o m
T-' CM CM CD ^J" <=t CO
CO CO CO CO CO 00 CO
n n s o co s « m t- t^ o t- o cn
•^ CM CM CO CM CO CM
CO CO CO 00 CO CO CO
1^- CO CO CO CO CO CO
"t IO O) t- •r S t-
SS 03 CO 6 S CO
CN CN CN CM CO CM CN
00 co oo co r^ co to
t-' CM CM CD'^t CO CO
CO 00 CO CO CO CO
CO CN CO t- T-; CM t-1 CM CNi CO CN 00 CN
CO CO CO 00 CO 00
LD CD CD t- CM 1^ CM
NN CO CO 6 S CO
CN CM CN CM 00 CN CM
eg
O) CO ^ r^- CO t-; LO
•^ CM CM in Tf "^ 00
00 00 00 CO 00 CO 00
CD t- CO CM t- 00
^ CM CNco CM CO CM
CO 00 00 00 CO CO
m m Oi cm •«- co t-;
NS CO CO C) N CD CM CM CM CM CO CM CM
-
CD CM rr CO CM t- in
•^ eg c\i no ^ ^r co
CO CO CO 00 CO 00 CO
lO t- N O) t- r; IN t-1 CM CM CM CM 00 CN
CO CO CO 00 CO 00 CO
^ «o» ^ ^ ^ ^
N N fvj CO O S CD CM CM CM 00 CM CN
Solar radiation
(W / m2)
CD O)
i_
CD
<D O 1^- CO t^ O O CO O CD CO CDi O O CO
S CO OJ t- N CO "t
cm
^ m CM CO -* CD CM CM CM CO CN CM CM
r^- o r^ o o co O CD O CD -3- O CN
£r LO CD coit-1 -^t oi
CM OJ CO O t- O O co
^ ^ t n t- O O 00 o o ^
O O CD -* h- ^<
Tt lO S CO N ^ 7 co m CD CM o o" *- CN CM T~ T- T- ^~
00 oo co m co cm in -*
co -^t- m cm -3- ^r h- CM CM CM CO CM CM CN
t— 00 -* cd co •«- - m •
m o co co ^r oj s CN -* -3" *3- T~ CN CD
CD CO CN h.
cn co zZ ^ «S ^<
C\| io ^ ifl CO n 5
^CN CD CM O § Z
CN m co cm o -3- •<$• m cm w cd oo co -3- m CM CM CN 00 CN CM CM
CO CD t*
CO t^ CD • TT . CO CD <* CD "* CN CJJ CM CO -^f CO ^ CO ^
oo^- m- «? «? un <f
^ S cd m co • % CN CM CD CO O S Z
-
co m t- cm in o ••*
CM -3"
CD t- CO ^T CD CM CN CM CO CM CM CM
CO
CM 00
O CO CD r- CO •
t*~- CO CN CD £ CD CM CN CO -3- CO O CM °
«« s r? s cd<
co
in en s con ^
CM CM CD CM O 2 Z
3 O X
CD
o5
CM
O
o o o o o o o o o o o o o o t- cm oo -^ m co r^ a LU
o o o o o o o o o o o o o o
^- CM CO f Ifl CO S
o
CM 00 a:
X o o o o o o o o o o o o o o t- IN CO ^ W CO S
COo
T3§
o
CD
I
S3I
o•i—*
oO
.a•aCD
CD oCMa•aHo
CDCD
CM
E 500
450 400
350 300
1 25°
£ 200
™ 150
100 50
1100 1200 1300 1400 1500
Time of the day (Hour)
1600 1700
Figure 4.1: Patterns of solar radiation versus time on Monday (29/9/03), Wednesday
(1/10/03) and Thursday (2/10/03)37.0
35.0 O
0 33.0
3 31.0
•4-1
n
>_
a>
E 29°
H 27.0
25.0
Wednesday *™»-" Thursday - - Monday
1100 1200 1300 1400 1500
Time of the day (hour)
1600 1700
Figure 4.2: Patterns of temperature versus time on Monday (29/9/03), Wednesday
(1/10/03) and Thursday (2/10/03)24
350 - -
300-
n 250
E
Ic 200
| 150
is
« 100
50-
0 -I
1100 1200 1300 1400 1500
Time of the day (hour)
**+V* •*-v- «.••******•.• *'•
1600
•• 'I-'."*
r 37.0
- 5 1 B 3 1 V
• 36.0
'.' a"'" • 35.0
! •-il'YHC...
O
• 34.0 » 2_
'iV'l'J
• 33.0 = 2
d>
-32.0 |
CI H
• . . ' f t . " -
• . ' I -••: ""• •
- 31.0
• 30.0
-«:..• •
- 29.0 1700
Figure 4.3: Relationship between Solar Radiation and Temperature on a Sunny Day (29/9/03)
500
450
400-
« 350-
5. 300 - •
c
| 250 -
n
<* 200-
«
£ 150-
100-
5 0 -
0-r
"V
♦j- .. .- :_• .\ /" . \
...,tfi-.- .-.•<»..?- - . .j,-. t*.!-,-^ •'ifri.l' „ . jiMtb-' • .*r4<--,-~/r'>? - -j !•„•-••* t •• >,: •" *' "
. J- •<*• ..^.^.w.,. . L--ji ^ .OjW... . „j_i . ..,»•.;».m„ ... fc.,a\«. ./-.. ;4 -...j • „ i , . :*,!.. • . X*""*1 _* "•'•• ."•• •••* •••-•*• • .* •'. * '• "•• -••i.-\
-*..J- . _.:•*, -M*i«:-...-.WW/.jA.v.Ji^1..-.i*<»teiw;?^^ •» »<.;. „
1100 1200 1300 1400 1500
Time of the day (hour)
1600 1700
33.5
33.0
- 32.5 O
a>
2_a
32.0 2?3 2
a
31.5 .»
-31.0
30.5
Figure 4.4: Relationship between Solar Radiation and Temperature on a Mixed Pattern Day (1/10/03)
25
300 -
250-
CM
E 200
150
100-
50-
1100 1200 1300 1400
Time of the day (hour)
"h^sis ?t.t. ef.a^ :
• r 30.5
L-*A-ii*.-i-30.0
"' h 29.5
h 29.0 _
o
i.*r-[ 28.5-
3
28.0 £
Q.
E
01
• 27.5 H
27.0
r 26.5
26.0
1500 1600
Figure 4.5: Relationship between Solar Radiation and Temperature on a Rainy Day (2/10/03)
As shown above, there are five plotted graphs from the readings taken at UTP. Graph 4.1 shows the pattern of solar radiation versus time on Monday (29/9/03), Wednesday (1/10/03) and Thursday (2/10/03) while graph 4.2 shows the pattern of ambient temperature versus time. From the graphs, we can see that the highest solar radiation reading (436 W/m2) was taken on Wednesday and the highest ambient temperature reading (36°C) was taken on Monday.
Graphs 4.3, 4.4 and 4.5 show the relationship between solar radiation and ambient temperature for Monday (29/9/03), Wednesday (1/10/03) and Thursday (2/10/03) respectively. On Monday, we can see that the patterns of solar radiation and ambient temperature are the same except from 4.00 to 5.00 pm. At this period, the ambient temperature decreases while the solar radiation increases.
26
On Wednesday, the pattern of the graph also shows that the temperature is dependent on the solar radiation except at 2.00 pm; where the solar radiation increases while the ambient temperature decreases. The reason behind this is because the temperature needs a longer time to increase compared to solar radiation. Since the readings were taken hourly, there are also other possibilities such shading occurs during that period.
On Thursday, the graph shows that there is no correlation between solar radiation and ambient temperature. This shows that temperature is not only dependent on solar radiation, but also on other parameters as well such as relative humidity and wind speed.
4.2 EXPERIMENT AT USM
Time(min)
Solar radiation
(count/sec)
Solar radiation
(W/m2)
Soiar radiation
(mA)
Solar radiation
(W/m2)
Ambient Temp.
(°C)
0 40 66.67 13 50 28
10 45 75.00 14 55 28.5
20 51 85.00 16 70 29
30 85 141.67 19 85 30
40 61 101.67 17 75 29
50 58 96.67 10 40 29
60 62 103.33 13 52 29.5
70 64 106.67 15 60 29.5
80 66 110.00 11 42 29.5
90 90 150.00 14 55 29.5
100 115 191.67 14 55 29.5
110 154 256.67 17 75 30.5
120 177 295.00 20 90 31.5
130 180 300.00 21 95 32
140 184 306.67 21 95 32.5
150 223 371.67 23 110 32.5
160 242 403.33 27 140 32.5
170 252 420.00 32 175 32.5
180 288 480.00 32 175 32.5
27
190 260 433.33 33 180 32.5
200 266 443.33 33 180 32
210 247 411.67 30 160 32.5
220 293 488.33 35 200 33.5
230 281 468.33 35 200 34
240 292 486.67 35 200 34.5
250 293 488.33 36 207 34.5
260 304 506.67 34 195 35
270 283 471.67 34 195 35
280 287 478.33 34 195 34
290 281 468.33 34 195 35
300 289 481.67 34 195 34.5
310 281 468.33 34 195 34.5
320 266 443.33 34 195 34
330 275 458.33 34 195 35
340 282 470.00 34 195 35.5
350 128 213.33 33 187 35
360 82 136.67 7 30 35
370 112 186.67 22 102 34
380 39 65.00 9 45 35
390 113 188.33 8 37 34.5
400 178 296.67 17 70 35
410 147 245.00 29 155 33.5
420 118 196.67 14 55 34
430 82 136.67 14 55 33
440 83 138.33 11 42 33
450 57 95.00 11 . 42 33.5
460 54 90.00 11 42 33
470 23 38.33 8 37 33
480 21 35.00 7 30 33
Table 4.2 : Data taken at USM between 9am to 5pm on Saturday (21/2/2004)
28
600-
i:*-«i#a^:^w-afer^ .-*#W •: •FSfr - oi>£-•••^ aw, •..•-.*&& *;, .^^
c
I 300
1
•2 200-
100
1200 1300 1400
Time of the day (hour)
Figure 4.6: Pattern of global solar radiation versus time on 21/2/04
36 -
900 1000 1100 1200 1300
Time of the day (hour)
1400 1500
Figure 4.7: Pattern of ambient temperature versus time on 21/2/04
29
1600 1700
As shown in the section 4.2, there are three main tables. The first table is the readings (solar radiations and ambient temperatures) taken at USM from 9.00 am to 5.00 pm.
Regarding the experiment, the solar data monitoring has been done using two setups of equipments. The first setup is a combination of solarimeter and solarimeter integrator (setup A), while the second setup consists of standard solar cell and multimeter (setup B).
From the first graph, we can see that there is a big difference in readings between these
two setups. The errors might be caused by insensitivity of setup B (mostly used forverification only) or inaccurate conversion graph from miliAmpere (mA) to Watt joule/meter square (Wj/m2). Comparing it directly to the data taken at UTP last semester,
the readings obtained from setup A have a closer values.Referring to the Figure 4.6 (setup A), the global solar radiation varies from 45 W/m2 (at
5.00 pm) to maximum 506.67 W/m2 (at 1.20 pm). On the other side, the ambienttemperatures vary from 28 °C (at 9.00 am) to maximum 35.5 °C (at 2.40 pm). Comparing
the solar radiation and temperature graphs together, we can see that between 9.00 am and
2.40 pm, the patternof bothparameters is same and proportional. After 2.40 pm, the solar radiation readings seem to drop dramatically while the ambient temperatures only
decrease slightly. This was causedby the cloudy sky at that particular time.30
4.3 EXPERIMENT AT UKM
1000 -
900 -''•"•'•'^••v-^z;
700 - ....
'••*.
•• •.••.
:ns
•D (0
n o w n n o CD
I'-a-lvr^,
"••^- wf*r,::;wi*~t- „ .
^•••Wii:... ?T ••:,.» .»
••••*• *• ... " '-JV
*J*" •"!!.-1...W . '."""-—J, .1 !
••.::... :.:;:.-—•<- L^rH
'.•I - •...
-[- 1
9:36:00 10:48:00 12:00:00 13:12:00 14:24:00 15:36:00 16:48:00 18:00:00 Time (hr/min)
Figure 4.8: Pattern of global solar radiation versus time on 21/1/04
39-
37 -
u "
D)
•a 35 - •
* i * '
o lm 3
n 33 -
0) a
b ^1 -
di
+ *
c
<D
5 29 -
*
1*-»*•
WW-*-.- -iit^,... , *. .*..,.. * - •• .S...
I *'-*,,,-»y.* "•".'.•, ... H. r --.j* .. ...
"*s" "Spc.«li. . ":.v».ss-t-:. " •'•'->:::... .
••*"'..{*„. ~"! .-I... B1M-W! .
.••1l-. • —_., ^. , ^ •••\.-!» . „. •••.•..?
***•••
*;.*«;.-
:"r:.^-
25 ., ^ , , , 7
9:36:00 10:48:00 12:00:00 13:12:00 14:24:00 15:36:00 16:48:00 18:00:00 Time (hr/min)
Figure 4.9: Pattern of temperature versus time on 21/1/04
31
As shown in the figures 4.8 and 4.9, there are two main graphs. The first graph shows the pattern of solar radiations (taken with 10 seconds interval); while the second graph shows the pattern of temperatures (taken with 1 minute interval). The readings were taken on 21/1/04 at UKM from 9.30 am to 5.15 pm. These small intervals can only be obtained with auto-monitoring system. Besides that, it is more accurate compare to manual monitoring system.
Referring to the Figure 4.8, the global solar radiation varies from 94.12 W/m2 (at 5:12:10 pm) to maximum 950.11 W/m2 (at 12:49:10 pm). On the other side, the ambient
temperatures vary from 27.8 °C (at 9:39:21 am) to maximum 34.9 °C (at 2:18:21 pm).
Comparing the solar radiation and temperature graphs together, we can see that the patterns differ slightly. For the first graph, generally the solar radiation increase constantly from 9.30 am to 11.50 am at a high rate and increase slowly to 12.50 pm.
There were huge amount of solar radiation from 12.17 pm to 3.07 pm. After that, the solar radiation decrease at a constant rate. For the second graph, the ambient temperature readings increase constantly from 9.30 am to 2.00 pm. From there, the temperature decrease slightly from 2.00 pm to 2.30 pm and more or less remains the same. This shows that on the afternoon, the solar radiation readings seem to drop dramatically while the ambient temperatures only decrease slightly. This may be caused by the cloudy sky
on the afternoon.
Since the data were taken using small intervals, changes of solar radiation and ambient
temperature were captured more frequently. In Malaysia, these two parameters (solar
radiation and ambient temperature) are very much affected by the clouds. The clouds move along with the wind in the sky; and resulted to high and low points in both graphs.32
4.4 EXPERIMENT DATA FROM METROLOGICAL DEPARTMENT
Jan Feb Mar Apr May Jun Jul Aug Sep Oct Nov Dec
Figure 4.10: Relationship between hourly average monthly solar radiation and temperature in Ipoh for 2003
500 -j
450
400
< 350 - E
£ 300 -,:H ...
c 0 '•5 250
n
1S 200--i^9
ra
O 150 - (0
100 -
50 -
0 -
Jan Feb Mar Apr May Jun Jul Aug Sep Oct Nov Dec
Figure 4.11: Relationship between hourly average monthly solar radiation and relative
humidity in Ipoh for 200333
1200
10 11 12 13 14 15
Time of the Day (Hour)
36.0
20.0
Figure 4.12: Relationship between average hourly solar radiation and temperature on a
sunny day (15/4/2003)1200
10 11 12 13 14
Time of the Day (Hour)
36.0
-• 34.0
-- 32.0
O -••"•'-• 30.0
28.0
-- 26.0
-- 24.0
-- 22.0
20.0
16 17 18
Figure 4.13: Relationship between average hourly solar radiation and temperature on a
rainy day (9/12/2003)34