Bitumen Filler System for Different Grades of Bitumen
By
RUZAIDI BIN AB. AZIZ
FINAL PROJECT REPORT
Submitted to the Civil Engineering Programme in Partial Fulfillment of the Requirements
for the Degree
Bachelor of Engineering (Hons) (Civil Engineering)
Universiti Teknologi Petronas Bandar Seri Iskandar 31750 Tronoh
Perak Darul Ridzuan
© Copyright 2010 by
RUZAIDI BIN AB. AZIZ, 2010
CERTIFICATION OF APPROVAL
Bitumen Filler System for Different Grades of Bitumen
by
Ruzaidi Bin Ab. Aziz
A project dissertation submitted to the Civil Engineering Programme Universiti Teknologi PETRONAS in partial fulfilment of the requirement for the
Bachelor of Engineering (Hons) (Civil Engineering)
Approved:
ý, ý. ýý ýýýý ý
(Assoc. Prof. IR. DR. Ibrahim Kamaruddin) Project Supervisor
UNIVERSITI TEKNOLOGI PETRONAS TRONOH, PERAK
June 2010
CERTIFICATION OF ORIGINALITY
This is to certify that I am responsible for the work submitted in this project, that the original work is my own except as specified in the references and acknowledgements, and that the original work contained herein have not been undertaken or done by unspecified sources or persons.
lk"
(Ruzaidi Bin Ab. Aziz)
ABSTRACT
The subject of this study is to know the characteristic of the different grades of bitumen with mixture of various fillers, which were obtained through planned laboratory processing. The filler that will be used are Ordinary Portland Cement (OPC), Fly Ash and Quarry Dust. The aim of the paper was to improve knowledge on the bitumen mixture, as well as investigating the numerical quantity relationship between the structures of fillers and the bitumen. In bituminous mixture the finer fraction of the filler have the highest surface area or specific surface. Surface related physico-chemical properties are known to largely influence the performance of bituminous mixtures[10]. Usual methods to determine the characteristic of the mixture is by conducting several tests which include the Penetration Test, Softening Test and also the Ductility Test. This project addresses the use of different types of filler in bituminous mixtures. Different filler have their own strength and physical properties that will affect the strength and stiffness of the bitumen mixtures.
ACKNOWLEDGEMENTS
I would like to thank everyone who has been involved directly or indirectly that contribute to the completion of this project.
First and foremost, I am thankful to Allah s. w. t the most gracious, for blessing me with the knowledge and patience that has been crucial towards the completion of this project.
Secondly, I would like to thank AP Jr. Dr. Ibrahim Kamaruddin, for help and guidance throughout my Final Year Project. Without his contribution, I would not be able to finish this project successfully.
Special thanks to my family for their tremendous support during difficult time of completing the project and this project is dedicated to my parents, Mr Ab. Aziz B Ishak and Mdm Siti Ruzita Bt Yahya for their undivided love and encouragement throughout my life.
TABLE OF CONTENTS
LIST OF TABLES viii
LIST OF FIGURES
... ix LIST OF ABBREVIATIONS ... x CHAPTER 1 INTRODUCTION
... 1 1.1 Background of Study ... 1 1.2 Problem Statement
... 3 1.3 Objective and Scope of Work ... 4 CHAPTER 2 LITERATURE REVIEW
... 5 2.1 Theory
... 5 2.2 Mineral filler in Hot Mix Asphalts (HMA)
... 9 CHAPTER 3 METHODOLOGY
... 13 3.1 Procedure Identification
... 13 3.1.1 Literature Review
... 14 3.1.2 Theoretical Study
... 14 3.1.3 Experimental Work
... 14 CHAPTER 4 RESULT AND DISCUSSION
... 22 4.1 Result
... 22 4.2 Discussion
... 32 CHAPTER 5 CONCLUSION AND RECOMMENDATION
... 36 CHAPTER 6 ECONOMIC BENEFIT
... 38 REFERENCES
... 39 APPENDICES
... 43 Appendix A
... 44
LIST OF TABLES
Table I Ductility Test for 60/70 and 80/100 penetration bitumen ... 28
Table 2 Softening Point Test for 60/70 and 80/100 penetration bitumen ... 30
Table 3 Penetration Test for 60/70 and 80/100 penetration bitumen ... 31
Table 4 Price for each filler ... 38
LIST OF FIGURES
Figure 1 Fraction voids in filler-bitumen systems
... 12
Figure 2 Flow Chart Of Work Progress ... 13
Figure 3 Penetrometer ... 15
Figure 4 Softening Test Apparatus ... 16
Figure 5 Ductility Test Apparatus ... 18
Figure 6 Diagram of a Transmission Electron Microscope ... 20
Figure 7 The Principal of X-ray Tube ... 21
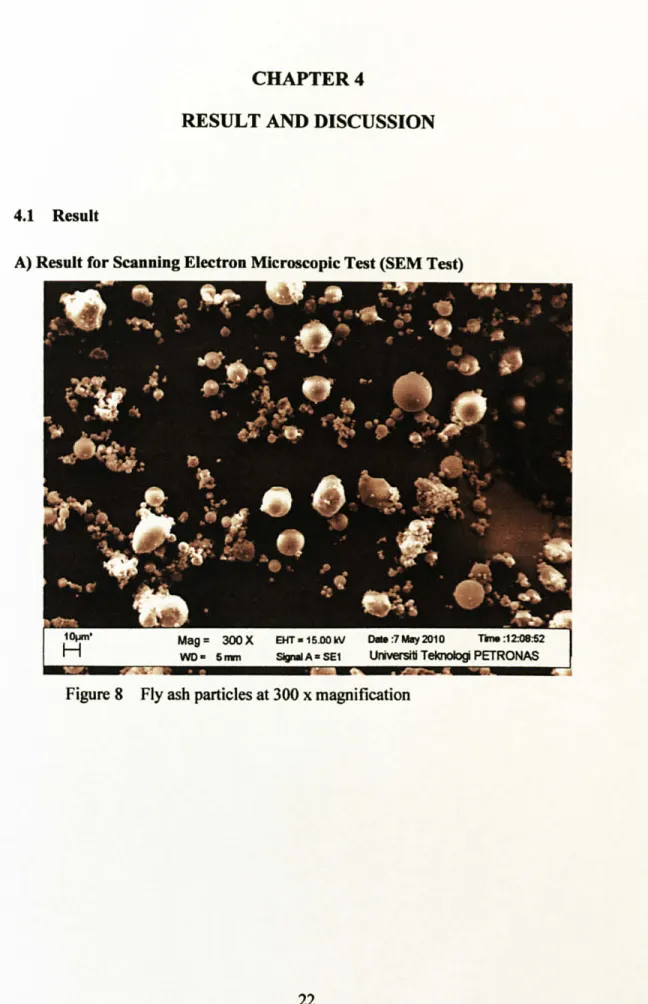
Figure 8 Fly ash particles at 300 x magnification ... 22
Figure 9 Average size of Fly Ash Particle at 300x Magnification ... 23
Figure 10 Structure Arrangement of Fly Ash at 2000x Magnification ... 23
Figure 11 Quarry Dust particles at 100 x magnification ... 24
Figure 12 Average size of Quarry Dust Particle at 100x Magnification ... 24
Figure 13 Structure Arrangement of Quarry Dust at 300x Magnification ... 25
Figure 14 OPC particles at 500 x magnification ... 25
Figure 15 Average size of OPC Particle at 500x Magnification ... 26
Figure 16 Structure Arrangement of OPC at 500x Magnification ... 26
Figure 17 Composition of Fly Ash ... 27
Figure 18 Composition of Quarry Dust ... 27
Figure 19 Composition of OPC ... 28
Figure 20 Ductility Test for 60/70 penetration bitumen + filler ... 29
Figure 21 Ductility test for 80/100 penetration bitumen + filler ... 29
Figure 22 Softening Point test 60/70 penetration bitumen added with filler ... 30
Figure 23 Softening Point test for 80/100 penetration bitumen added with filler ... 30
Figure 24 Penetration test for 60/70 penetration bitumen + filler ... 31
Figure 25 Penetration test for 80/100 penetration bitumen ... 31
Figure 26 Ordinary Portland Cement ... 44
Figure 27 Fly Ash ... 44
Figure 28 Quarry Dust ... 44
LIST OF ABBREVIATIONS
OPC: Ordinary Portland cement QD: Quarry Dust
FA: Fly Ash
SEM: Scanning Electron Microscopes XRD: X-Ray Diffraction
CHAPTER 1 INTRODUCTION
1.1 Background of Study
This project is carried out on bitumen filler system for different grades of bitumen. This project focuses more on the experiment and analysis of the filler that are commonly used in the road constructions. Fillers are finely divided substances which are insoluble in bitumen but when dispersed in bituminous mixtures can modify its consistency and mechanical properties. The quality and quantity of filler used in road construction greatly affect its performance. The function of mineral filler has been recognized in the literature to be more a filling the voids.
The general effect of adding filler to bitumen is to make it harder and stiffer.
In practical terms, this means that there is a reduction in the deformation when subjected to loading and is shown by an increase in softening in penetration and an increase in stiffness. The extent of this hardening or stiffening effect depends on the amount of filler added and on its particle shape, size and grading. Normal fillers such as limes or slate dust produce the least effect; fillers with plate-like particles, such as are intermediate, and fibrous fillers such as asbestos show the greatest effect for a given concentration of filler.
Filler in bituminous mixture may act as a bitumen extender or it may stiffen the binder depending on the type of filler used. Portland cement (often referred to as OPC, from Ordinary Portland Cement) is the most common type of cement in general use around the world, because it is a basic ingredient of concrete, mortar, stucco and most non-specialty grout. It is a fine powder produced by grinding Portland cement clinker (more than 90%), a limited amount of calcium sulfate which controls the set time, and up to 5% minor constituents (as allowed by various standards). Portland cement clinker is made by heating, in a kiln, a homogeneous mixture of raw materials to a sintering temperature, which is about 1450 °C for modem cements. The
I
aluminum oxide and iron oxide are present as a flux and contribute little to the strength.
Fly ashes are finely divided residue resulting from the combustion of ground or powdered coal. They are generally finer than cement and consist mainly of glassy- spherical particles as well as residues of hematite and magnetite, char and some crystalline phases formed during cooling. In addition to economic and ecological benefits, the use of fly ash in concrete improves its workability, reduces segregation, bleeding, heat evolution and permeability, inhibits alkali-aggregate reaction, and enhances sulfate resistance (Helmuth 1987).
Quarry dust, a by-product from the crushing process during quarrying activities is one of those materials being studied, especially as substitute material to sand as fine aggregates. Quarry dust have been used for different activities in the construction industry such as for road construction and manufacture of building
materials such as lightweight aggregates, bricks, tile and autoclave blocks[9].
1.2 Problem Statement
Pavement design is aimed at achieving a pavement structure which is economical, comfortable and yet safe to travel by motorist; and which minimizes development of pavement distress during the design life of the pavement. However, inappropriate selection of road materials for construction may have caused premature pavement failure. The pavement materials are severely over stressed. The type and soil conditions, and expected load repetitions are other parameters found to be indispensable in the formulation of material selection system for road construction.
The material performance and the selection of the appropriate construction materials for the various layers under certain traffic-loading under the type of terrains such as flat, rolling and mountainous was incorporated as important parameters. Such conditions govern the duration of axle loading on the pavement. There is a drive towards the development of more appropriate material selection approaches as these will allow alternative solutions to be readily compared and, thus, evaluated. A prerequisite for any successful analytical design methodology is the reliable measurement of representative material properties [2].
Millions of ringgits have been spent annually for road maintenance. The causes of road problems may be due to incorrect selection of pavement material [3]. With this study of filler system in road construction, we can identify the effect of the road strength by using different filler in different type of bitumen grades. So this will enhance and improves the quality of road pavement in Malaysia.
1.3 Objective and Scope of Work
This study will undertake to determine the characteristics of different filler in bituminous mixture. The bituminous mixture will incorporate different grades of
bitumen. Two grades of bitumen will be used namely, 1) 60/70 pen bitumen
2) 80/100 pen bitumen
Different fillers will be used in this study, namely:
1) Ordinary Portland Cement (OPC) 2) Fly Ash
3) Quarry dust
CHAPTER 2 LITERATURE REVIEW
2.1 Theory
Transportation facilities have been taken seriously nowadays. There are lots of new technologies in enhancing the quality of the transportation and a brand new transportation has come out like LRT or MONORAIL. If we don't take seriously in keeping our road in good condition, lot of users will turn out to use LRT or another new technology of transportation. Miro' et al. (2004) in their book mentioned that the processes that the binder undergoes when aging, which cause its progressive hardening, may damage its aggregate-bitumen adhesive qualities and, thus, the cohesion of the mixture. The addition of filler to the mixture can improve adhesion and cohesion substantially (filler is a fine material, which passes a 0.075 mm sieve, derived from aggregate or other similar granular material). The bitumen-filler system (mastic), which is thicker and tougher than bitumen alone, improves the adhesive qualities and, in providing a covering film of greater thickness, also means that the aging processes can be slowed down. The effects of the addition of filler are directly related to their characteristics and the degree of concentration of the filler in the
bitumen-filler system. The advantages that filler offers for the durability of the bituminous mixtures in the case of water action are due, in principle, to its physical
characteristics, reducing the porosity of the granular structure and thereby making the access of water and air difficult. Moreover, the chemical nature of filler may mean greater affinity with the asphalt binder, improving the resistance to the displacement that the water causes the bitumen [4].
Craus et al. (1996) assessed the influence that the type of filler had on the durability of the bituminous mixtures. The authors reviewed the usual criteria of mixture design, with analyses that simulate short periods of exposure to the environment (for example, for the case under study, the residual Marshall stability and the resistance of immersion-compression), noting that mixtures that pass these tests, usually fail completely in service. With the obtained results they were able to
modify the existing criteria for the classification of fillers, which had only been based on basic properties without considering the durability factor. From this works, the authors have continued studying the effect of the characteristics of fillers on the durability of the mixtures [5].
There are also diverse studies that use these procedures in order to assess the effect of filler in the aging of the binder. Thus, Petersen et al. (1998) tried to quantify how the addition of filler might benefit the reduction of hardening by age and improve the properties of flow at low temperatures, using as a tool a variant of the RTFOT named Thin Film Accelerated Aging Test (TFAAT). They studied the physical-chemical behavior of mastics made with a conventional binder and three types of mineral fillings (lime with high calcium content, dolomitic lime and limestone dust). Firstly, they determined that the ideal filler-bitumen ratio in weight for the calcium lime is in the order of 20%; then, they compared the behavior of the three fillers for this proportion. The conclusions must be confined to that limited number of variables, but they establish some comparative criteria according to which greater advantages are obtained when using calcium lime, whereas the use of limestone dust means little contribution as far as resistance to aging is concerned [6].
Both author above mentioned correctly about the filler effect on the bitumen and also the characteristic of the bitumen-filler system. The aim of the work presented here, as with some of the above-mentioned publications, is to analyze the effect filler has on the bitumen with different type of filler and the different filler quantities that mix with different type of bitumen.
Mineral fillers combine with the asphalt, fibers, and a small percentage of fine aggregate particles to create binder rich mastic which fills the void spaces between the coarse aggregate skeleton. The requirements for mineral filler are not complex.
Consequently, a variety of materials have been used as mineral fillers in SMA including rock dust products of various mineralogy, fly ash, Portland cement, kiln dusts, and limestone.
As defined in most of the road standard, mineral fillers are considered part of the aggregate and are partially defined as consisting of "finely divided mineral matter such as rock dust, slag dust, hydrated lime, hydraulic cement, fly ash, loess, or other suitable mineral matter. Fillers play an important role in stabilizing the hot mix asphalt (HMA) by filling the voids within the larger aggregate particles, and
improving the consistency of the binder that cements the larger aggregate particles (Puzinauskas, 1969).
Furthermore, they affect the workability, moisture sensitivity, stiffness, and aging characteristics of HMA (Mogawer and Stuart, 1996). The effect of fillers is more prominent in gap-graded asphalt mixtures, such as the Stone Matrix Asphalt (SMA) mixture that contains large amounts of fines. Typical filler completely passes a 0.60 mm (No. 30) sieve, with at least 65-70 percent by weight of the particles passing the 0.075 mm (No. 200) sieve.
Fly ash is produced by coal-fired electric and steam generating plants.
Typically, coal is pulverized and blown with air into the boiler's combustion chamber where it immediately ignites, generating heat and producing a molten mineral residue.
Boiler tubes extract heat from the boiler, cooling the flue gas and causing the molten mineral residue to harden and form ash. Coarse ash particles, referred to as bottom ash or slag, fall to the bottom of the combustion chamber, while the lighter fine ash particles, termed fly ash, remain suspended in the flue gas. Prior to exhausting the flue gas, fly ash is removed by particulate emission control devices, such as electrostatic precipitators or filter fabric baghouses.
The unique spherical shape and particle size distribution of fly ash make it good mineral filler in hot mix asphalt (HMA) applications and improves the fluidity of flowable fill and grout. The consistency and abundance of fly ash in many areas present unique opportunities for use in structural fills and other highway applications.
This fly ash is a fine silt size material consisting of spherical glassy particles and is composed of 54.57% silicon oxide, 8.24% aluminum oxide, 14.28% iron, and 6.85% calcium. The total amount of silicon, aluminum and iron oxides is 77.09%.
The minimum acceptable requirement is 50% to be a type C fly ash (Conner, 1990).
Aggregate crusher units produce enormous quantities of quarry dust, a waste product, produced during crushing of rubble. Stacking or disposal of such large quantities of this waste is a serious environmental problem and health hazard to both plants and animals. Thus there is an urgent need to explore the possibility for an effective utilization of this waste material. From economical and environmental considerations, highway construction is one such field, where quarry dust can be used in abundance, reducing the total cost of construction in addition to providing a solution to an environmental problem. Waste materials and by-products are classified into four categories based on their source: agricultural, by-products, industrial and mineral (Collins and Ciesilski, 1994). As highway requires huge volumes of construction materials, highway agencies are frequent participants in efforts to recycle or reuse waste material. Quarry waste consists mainly of the fines from stone washing, crushing, and screening at quarries, as well as some wet silty clay material from washing of sand and gravel. Gradation of this material does not meet the specification requirements and are usually placed in ponds or stockpiled in a saturated condition. If properly blended, screenings (quarry dust) can potentially be used in granular base courses (Tepordei and Valentin, 1992). The unit weight of quarry by- products can vary according to the type of rock processed, but is expected to be within the same range as the rock source from which it was derived.
For the design of road pavements the strength and stiffness of the subgrade are required to be estimated or measured for two design functions: (i) To characterize the subgrade as the foundation of a haul road to carry construction traffic; for this purpose the strength of the subgrade just before placing the capping layer or subbase is needed. (ii) To establish the likely in service long-term strength and stiffness of the subgrade after the disturbance of construction phase and when moisture equilibrium has been established within it (Powel et al., 1984).
The physical properties, chemical composition, and mineralogy of quarry dust vary with aggregate type and producer source, but are relatively consistent at each quarry location (Wood et al., 1993). Quarry dust samples yielded high CBR values indicating its potential as a good sub-base material (Soosan et al. 2001). Engineering properties of soils are improved substantially by the addition of quarry dust.
Improvements are manifested in the form of reduction in liquid limit, reduction in plasticity, increase in maximum dry density, decrease in optimum moisture content (OMC) and increase in unsoaked (immediately after molding) and soaked (immersed in water for 96 h) CBR values. Soil-quarry dust mixtures can be used advantageously as embankment material, backfill material and as a sub-base material (Soosan et at., 2000).
2.2 Mineral filler in Hot Mix Asphalts (HMA)
Mineral filler is a major component of Hot Mix Asphalts (HMA), used in the construction of asphalt pavement layers. Bitumen with mineral filler creates a composite called microstructure of HMA. Service life of asphalt pavements depends significantly on nature, quality and composition of this composite. A mixture of bitumen and filler in technical language is referred to a filler-bitumen mastic or mortar. Much of extensive research from the early part of the 20s century, has been done on the properties of mineral filler and its influence on HMA. In summary, it can be concluded that:
" Mineral filler fills the interstices and provides contact points between larger aggregate particles;
" When mixed with bitumen binder, mineral filler forms a high-consistency binder or mastic which cements larger aggregate particles together;
" Mineral filler may act as an extender of bitumen binder or may stiffen bitumen, and the degree of stiffening varies significantly between different fillers;
" For a given filler source, the finer the filler the greater the stiffening effect;
" Although performance varies for different fillers, there are no tests that can adequately predict their performance;
" The bulk volume of mineral filler can be related, to a first approximation, to the stiffening effect produced when the filler is added to bitumen binder;
" The stiffening effect of various fillers could not be predicted reliably from filler size and filler gradation.
Therefore, the suitability of filler for use in HMA depends on the properties that are related to the stiffening influence of the mineral fillers. It was experimentally proved that checking penetration at 25°C, softening point (SPRB) using Ring & Ball test, as well as testing viscosity of the mastic (g) are most suitable for evaluating the stiffening properties of fillers. Because of the problems of fines settling in mastics during testing in very high temperatures, a dynamic shear rheometer often gives unexpected test data and therefore DSR test is not always used. The top portion of the DSR sample is less stiff compared to the bottom portion due to settlement of fines and, therefore, low-stiffness values are obtained which have bad correlation with the softening point and Brookfield viscometer test data.
The softening point test is practical for use at a HMA facility, gives repeatable results, and has an excellent correlation with viscosity at 60°C. If the increase in softening point of the neat bitumen binder, when fillers are added to it, is not more than 11°C, the HMA mixture is not likely to be excessively stiff or brittle. These recommendations have been developed for dense-graded HMA mixtures and do not necessarily apply to open-graded mixtures or stone matrix asphalt mixtures (SMA).
It is required that the increase in softening point of mastics in relation to softening point of bitumen does not exceed an established value because too high increase of this parameter witnesses to great absorbency of bitumen by filler used in this mastic.
According to French requirements the 12.6°C increase of softening point (DSPRB) using Ring & Ball test is recommended. According to Polish criteria, fillers have positive stiffening properties if the mastics prepared with them are characterized as following:
" DSPRB for 1.5 filler/bitumen ratio (FB): 520°C,
" SPRB for F/B = 1.5 and 50/70 bitumen: 54-76°C.
The great decrease in penetration of mastics (in 25°C) in relation to penetration of bitumen indicates to large stiffening effect of used filler. But too high increase in dynamic viscosity of mastics in relation to viscosity of bitumen indicates to excessive increase of internal friction in mastic.
Rigden(1947) conducted a series of experiments to study the relationship between filler properties and the viscosity of mineral filler-bitumen mastics and he showed a strong correlation between the void content of dry compacted filler (the so- called Rigden voids) and the amount of stiffening produced by the filler. Rigden (1947) also showed that the voids in the filler at its closest packing are of major importance to the behaviors of filler/bitumen systems [29].
Heukelom (1965) has also discussed the basic concept. If filler is mixed with less bitumen binder than is required to fill its voids, a stiff dry product is obtained.
Overfilling the voids with bitumen binder, conversely, imparts a fluid character to the mixture[30]. Rigden's concept maintains that a portion of the bitumen binder can be regarded as `fixed' in the inter- and intra-granular pores of the filler, while the remaining part is `free'. Thus, the functional volume percentages of `solid' and `fluid' phase vary based on the bulk volume percentages of filler granules and bitumen binder. The basic concept is shown in Fig. 1.
Anderson and Geotz (1973) examined the stiffening effect of a series of one- sized fillers ranging from 0.6 to 75 mm (passing No. 200 sieves). They concluded that both the size of the filler and bitumen binder composition had a significant influence on stiffening effect. The description of physical effects on contact of bitumen film and mineral filler requires the knowledge of the following structural characteristics of fillers to be the most important: grain-size distribution, specific surface area, Rigden voids, as well as grain morphology (i. e. sphericity and roundness of grains). The characteristic of grain morphology is most often presented using descriptive methods (for example `crushed' or `uncrushed'), without introducing quantitative (numerical) measures [31 ].
Pilat (1994) in his paper contain attempts to evaluate surface texture and shape of grains of fillers using microscope images. Researches conducted there, using microscopic methods, enabled the evaluation of the maximum grain size, shape of dominating grains, as well as state of edges of grains. But the texture and the shape of the grains analyses, i. e. the morphological analyses of fillers have not found the practical application in the road laboratory research yet [24].
At present, various methods of research and criteria of evaluation of mineral fillers are applied in road construction. This causes difficulties when comparing results of research studies. Therefore, the need to conduct research on the structure of mineral fillers and its influence on the stiffening properties in mastics and elaboration
of a description of these relationships using quantitative methods arose [23].
Composition
Free Bitumen
Fixed Bitumen
Fluid
Solid
Phases Figure 1 Fraction voids in filler-bitumen systems
va-(vB-v, T sl
A
VfB
1
CHAPTER 3 METHODOLOGY
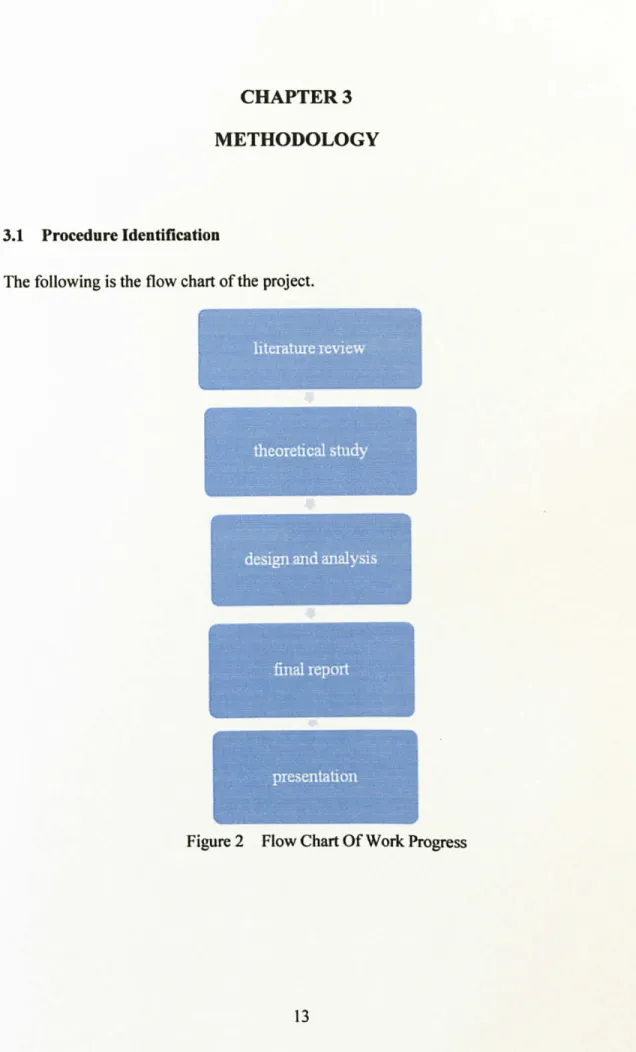
3.1 Procedure Identification
The following is the flow chart of the project.
'"'ý
Figure 2 Flow Chart Of Work Progress
3.1.1 Literature Review
The flow chart (figure 1) shows the progress of the project. This study is based on inputs from the journals, books and internet related to the project like Bituminous Mixture, type of filler, and characteristic of bitumen filler system.
3.1.2 Theoretical Study
For the theoretical study, experimental work will be conducted for the bitumen. The experiment that will be conducted is Penetration Test, Softening Test and Ductility Test. All the test will be carried first with the bitumen itself and secondly will be repeated with addition of the different type and quantity of the filler on the bitumen.
Scanning Electron Microscopic Test (SEM Test) and X-ray Diffraction also being conducted to make sure that the result will become more precise.
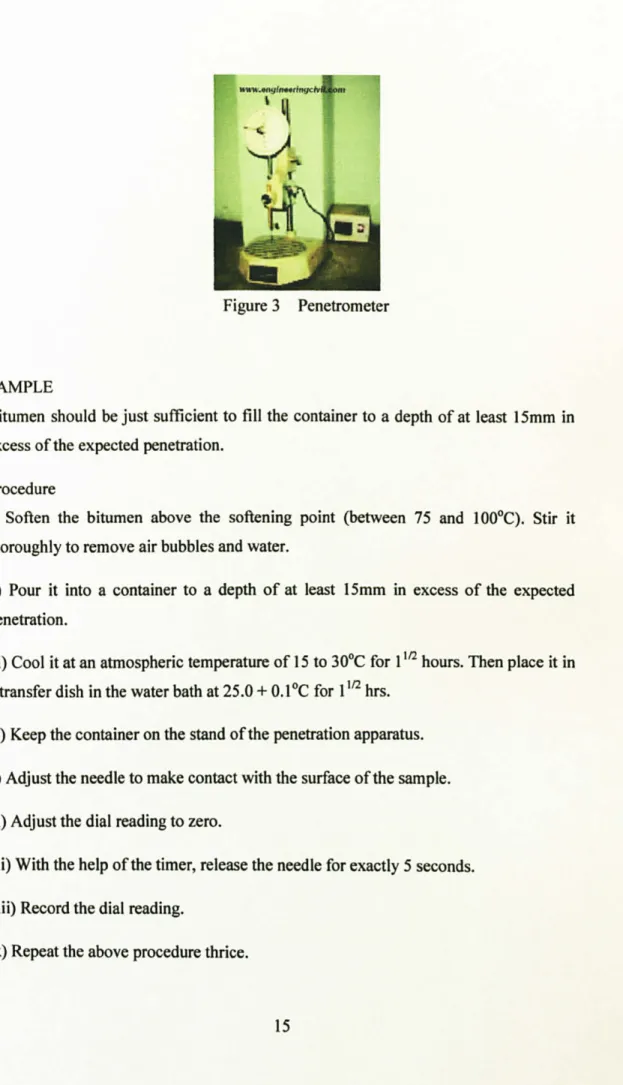
3.1.3 Experimental Work A) Penetration Test
This test is done to determine the penetration of bitumen. The principle is that the penetration of a bituminous material is the distance in tenths of a mm, that a standard needle would penetrate vertically, into a sample of the material under standard conditions of temperature, load and time. The apparatus needed to determine the penetration of bitumen is
i) Penetrometer ii) Water bath
iii) Bath thermometer - Range 0 to 44°C, Graduation 0.2°C
Figure 3 Penetrometer
SAMPLE
Bitumen should be just sufficient to fill the container to a depth of at least 15mm in excess of the expected penetration.
Procedure
i) Soften the bitumen above the softening point (between 75 and 100°C). Stir it thoroughly to remove air bubbles and water.
ii) Pour it into a container to a depth of at least 15mm in excess of the expected penetration.
iii) Cool it at an atmospheric temperature of 15 to 30°C for 11/2 hours. Then place it in a transfer dish in the water bath at 25.0 + 0.1°C for 11n hrs.
iv) Keep the container on the stand of the penetration apparatus.
v) Adjust the needle to make contact with the surface of the sample.
vi) Adjust the dial reading to zero.
vii) With the help of the timer, release the needle for exactly 5 seconds.
viii) Record the dial reading.
ix) Repeat the above procedure thrice.
Result
The value of penetration reported should be the mean of not less than three determinations expressed in tenths of a mm.
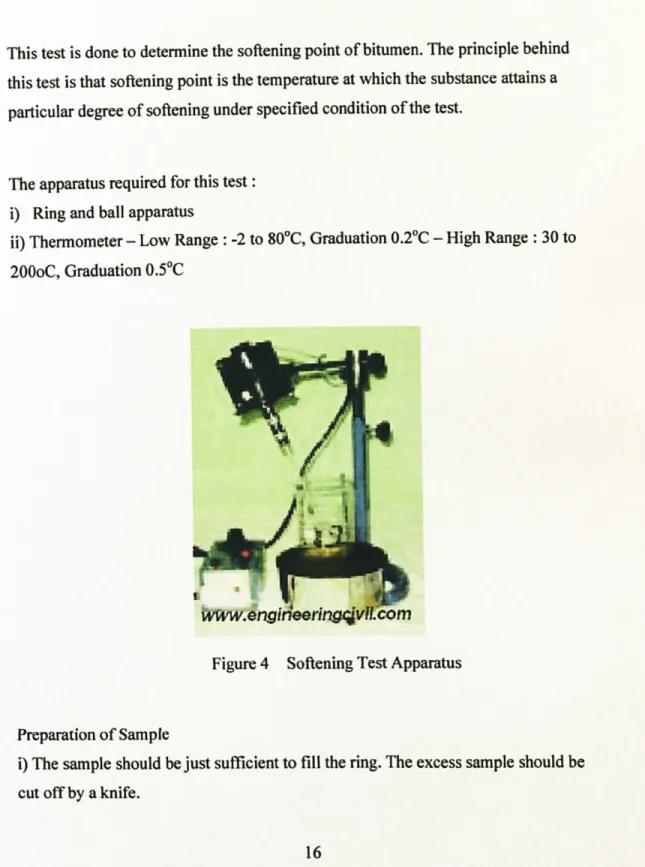
B) Softening Test
This test is done to determine the softening point of bitumen. The principle behind this test is that softening point is the temperature at which the substance attains a particular degree of softening under specified condition of the test.
The apparatus required for this test : i) Ring and ball apparatus
ii) Thermometer - Low Range : -2 to 80°C, Graduation 0.2°C - High Range : 30 to 200oC, Graduation 0.5°C
h1 -ý, - WWw. englneerfng. cjvlLcam
Figure 4 Softening Test Apparatus
Preparation of Sample
i) The sample should be just sufficient to fill the ring. The excess sample should be cut off by a knife.
ii) Heat the material between 75 and 100°C. Stir it to remove air bubbles and water, and filter it through IS Sieve 30, if necessary.
iii) Heat the rings and apply glycerine. Fill the material in it and cool it for 30 minutes.
iv) Remove excess material with the help of a warmed, sharp knife.
Procedure to determine Softening Point Of Bitumen A) Materials of softening point below 80° C:
i) Assemble the apparatus with the rings, thermometer and ball guides in position.
ii) Fill the beaker with boiled distilled water at a temperature 5.0 ± 0.5°C per minute.
iii) With the help of a stirrer, stir the liquid and apply heat to the beaker at a temperature of 5.0 ± 0.5°C per minute.
iv) Apply heat until the material softens and allow the ball to pass through the ring.
v) Record the temperature at which the ball touches the bottom, which is nothing but the softening point of that material.
B) Materials of softening point above 80°C:
The procedure is the same as described above. The only difference is that instead of water, glycerine is used and the starting temperature of the test is 35°C.
Result
Record the temperature at which the ball touches the bottom.
C) Ductility Test
This test is done to determine the ductility of distillation residue of cutback bitumen, blown type bitumen and other bituminous products. The principle is: The ductility of a bituminous material is measured by the distance in cm to which it will elongate before breaking when a standard briquette specimen of the material is pulled apart at a specified speed and a specified temperature.
The apparatus required for this test:
i) Standard mould ii) Water bath iii) Testing machine
iv) Thermometer - Range 0 to 44°C, Graduation 0.2°C
E:
www. engineerinVcivü. com
am k r. ý
_.. Me
Figure 5 Ductility Test Apparatus
Procedure
i) Completely melt the bituminous material to be tested by heating it to a temperature of 75 to 100°C above the approximate softening point until it becomes thoroughly
fluid. Assemble the mould on a brass plate and in order to prevent the material under test from sticking, thoroughly coat the surface of the plate and the interior surfaces of the sides of the mould with a mixture of equal parts of glycerine and dextrin. While filling, pour the material in a thin stream back and forth from end to end of the mould
minutes and then place it in a water bath maintained at the specified temperature for 30 minutes, after which cut off the excess bitumen by means of a hot, straight-edged putty knife or spatula, so that the mould is just level full.
ii) Place the brass plate and mould with briquette specimen in the water bath and keep it at the specified temperature for about 85 to 95 minutes. Remove the briquette from the plate, detach the side pieces and the briquette immediately.
iii) Attach the rings at each end of the two clips to the pins or hooks in the testing machine and pull the two clips apart horizontally at a uniform speed, as specified, until the briquette ruptures. Measure the distance in cm through which the clips have been pulled to produce rupture. While the test is being done, make sure that the water
in the tank of the testing machine covers the specimen both above and below by at least 25mm and the temperature is maintained continuously within ± 0.5°C of the specified temperature.
Result
A normal test is one in which the material between the two clips pulls out to a point or to a thread and rupture occurs where the cross-sectional area is minimum. Report the average of three normal tests as the ductility of the sample, provided the three determinations be within ± 0.5 percent of their mean value.
If the values of the three determinations do not lie within ± 0.5 percent of their mean, but the two higher values are within ± 0.5 percent of their mean, then record the mean of the two higher values as the test result.
D) Scanning Electron Microscope Test (SEM)
The Scanning Electron Microscope (SEM) is a microscope that uses electrons rather than light to form an image. There are many advantages to using the SEM instead of a
light microscope.
The SEM has a large depth of field, which allows a large amount of the sample to be in focus at one time. The SEM also produces images of high resolution, which means that closely spaced features can be examined at a high magnification. Preparation of the samples is relatively easy since most SEMs only require the sample to be conductive. The combination of higher magnification, larger depth of focus, greater resolution, and ease of sample observation makes the SEM one of the most heavily used instruments in research areas today.
i"
, ', ''ý. ýi; t, tý, ý,
Iý'. 'ý. ' ,. " +ý
I':.: ! '11. A. I i. _ -I-
:: rTY, (" dF! ('r11. f
vf: ', C+: ' dj2ý: f16fC
f, i trt: nhe, +m
I., . rrnt Acrrr . nnrl r, ýn". rr. i
Trýýn;; irliý u7rý E; rc; 'r r ý. 'I: ro5Cape
Figure 6 Diagram of a Transmission Electron Microscope
E) X-ray Diffraction Test
X-ray diffraction (XRD) is a versatile, non-destructive technique that reveals detailed information about the chemical composition and crystallographic structure of natural
The 3 sample of fillers which is Fly Ash, Quarry Dust and Ordinary Portland Cement (OPC) will go through the X-ray Diffraction Test (XRD Test) to know the composition of each material.
X-Ray
Figure 7 The Principal of X-ray Tube
When a monochromatic X-ray beam with wavelength lambda is projected onto a crystalline material at an angle theta, diffraction occurs only when the distance traveled by the rays reflected from successive planes differs by a complete number it of wavelengths.
By varying the angle theta, the Bragg's Law conditions are satisfied by different d- spacings in polycrystalline materials. Plotting the angular positions and intensities of the resultant diffracted peaks of radiation produces a pattern, which is characteristic of the sample. Where a mixture of different phases is present, the resultant
diffractogram is formed by addition of the individual patterns.
Based on the principle of X-ray diffraction, a wealth of structural, physical and chemical information about the material investigated can be obtained. A host of application techniques for various material classes is available, each revealing its own
specific details of the sample studied.
CHAPTER 4
RESULT AND DISCUSSION
4.1 Result
A) Result for Scanning Electron Microscopic Test (SEM Test)
Figure 8 Fly ash particles at 300 x magnification
Mag = 300 X EHT - 15.00 Al D. :7 May 2010 rm. : I2: I0: 2I
WD- 5 mm Slgnd A- SEI UnfV6r51ti Telagbg PETRONAS
Figure 9 Average size of Fly Ash Particle at 300x Magnification
Figure 10 Structure Arrangement of Fly Ash at 2000x Magnification
Figure II Quarry Dust particles at 100 x magnification
mag= loo x EHT =15.00 kV Die :7 Vey 2010 Tinn: 12: 1722 WD- 5 mm Sipnl A= SE1 Universiti Telanobgi PETRONAS
c
Figure 12 Average size of Quarry Dust Particle at 100x Magnification
1 ONmMag
= 500 X EHT = 15.00 kV Dete :7 May 201 CTcne . 122707
1 WD= 6 mm Signal A= SEI UtrvetSlG Tetalaogi PETRONAS
rb ýýKinan..: ýc Idammal1
Figure 15 Average size of OPC Particle at 500x Magnification
Figure 16 Structure Arrangement of OPC at 500x Magnification
B) Result for X-ray Diffraction Test (XRD Test)
1
2-Theta - ScMe
®, - IY. , n. -TYV. anvr. m., ý ..., ]®""4, e: ea. mo "" wy. c® "- SYy F.. ' , .. 1.... '. D "t ý.,., - T... S,.. w , lTF, ý1s. " J-T, W Z®"-T, ý.. , ®- - o. Qao prrira a. cywm t. om., aoo ] .. ýý
- A,. SS, c, - ur. N^ - ýSOr, ., OS 1- r ý. SO a ... ey ,.. W,: , l. O.. oýw..,,.. ru -. l. ss]OS -S i, ýOYS -. iM'pl -. p. mUOp -..,. W. ooo . yw.. r aaom " Aw - or
Figure 17 Composition of Fly Ash
2
ow =
ý 300
J
2-Theta - Scale
1&2, a 2ý - TT.. 2M11ý 14. tl- arre 2000 "- utl Ea000 "- 6r. 0 mD "- er. Ywa I.. - Tw. 25 "C Or. "I " T. r 01r1.. 1273Ttbb. - 2Tlrr 1000"- Tltl.. 1 ON "C1. O00 OE.,. b. ftdwý I mqt Om lb. Pt
" 08Ol0 Kt -Orrtr..., . 1. - aID2 -Y 00 m IN by 1- WL 1 S46 - w, -". 0/. /0 - b4 a1H0- 19 Om -. M. r 00 m0 -.. Y 00000 -O. ýr 106 000- ºt.. bi. - V2II1115b -i ." 1PGm01.1- MluxLr, sYw.. 9AIO000 -Tmm 1<-.. ly I- WL 15406. Tlöt -. 8ä1m -! 1200tm -cT 2am.. Me. OD 05D - 041159.0 - 9r. 97 WD - 9.. a. o.. - CA (
41 -I. m m- Al.., ý, odw. C - 6KEtllAM81A4308- V 80 00 %-.. by I- WL: 1.540 - Trtlt -. a tOlm -0 1200000- c7 . 11200 -. /1.23 80D - b. l. 1Ia. T0 - 6. w. 1.44 380 - e.. º
3
2-Theta - Scale
®3 - FL S. w - Try. ZfMn b! N- SIn1 20m' - üd SOmO. - sbi 0 050 -- Sbp b.. 1.. -T., 25'C 0'.. n. ) - Tbn. S. rud. 121 -322Zf M. - 2-TMb 2. T) rs / Om' -Ot om . ý. m1
orn. wr/. UCrand 1 m0.1mo 0
11oZT11M) -C. C4n.. grw Ab. - 0.6 Sbr - Ca6.1yARS1/0f0/KaO 1dB-02-AQO11b0 - Y. 5000 t-d . br 1- NIL 1 Slm - F. vvdkic -. /2210m- b 7,04=. e 2e 9/b0 . "as-1J7S(Cl-H"bVR... 1. -G7IF/Ogo-T: 'Rms-a. /r1 -WL:. 15. [t-lbnoebW -e1D. 00.100-e7.0T7S0-e164oY)-"'iInY0. m0-b. ra72D-Yr.. nla. m0-l-Med-Cw
Figure 19 Composition of OPC
C) Result for Ductility Test
Table l Ductility Test for 60/70 and 80/100 penetration bitumen
60170 Pene tration 801100 Penetration
Mixture
Fly Ash
Quarry Dust
Ordinary Portland Cement
Fly Ash
Quarry Dust
Ordinary Portland Cement Bitumen 500 m+ filler O gm 72.333 72.333 72.333 75.000 75.000 75.000 Bitumen 500 m+ filler 15 gm 67.667 68.000 67.033 71.800 71.333 71.000 Bitumen 500 m+ filler 30 gm 65.167 66.767 66.167 66.333 66.000 63.333
Bitumen 500 m+ filler 45 gm 52.833 57.967 54.867 55.667 53.000 55.333 Bitumen 500gm_+ filler 609m 42.167 52.167 51.800 47.467 51.833 47.867
ductility test for 60ROpenetration bitumen + filler
75 ý -- 70 ý--ý E
wY Rfl j`
ý -ý-
-ý bitumen+tty ash bitumen+QD bitumen+OPC 55 {
50 45 40-
0.00 3.00 6.00 9.00 12.00
% filler added
Figure 20 Ductility Test for 60/70 penetration bitumen + filler
ductility test for 80/100penetration bitumen+ filler
80 ý ,.., 75
ý 70 65 - 60 - 55 50 ý 45 -
40 0369
°% filler added
12
t bitumen + fly ash
bitumen + quarry dust bitumen + OPC
Figure 21 Ductility test for 80/100 penetration bitumen + filler
D) Result for Softening Point Test
Table 2 Softening Point Test for 60/70 and 80/100 penetration bitumen
60170 Penetration 801100 Penetration
Mixture
Fly Ash
Quarry Dust
Ordinary Portland Cement
Fly Ash
Quarry Dust
Ordinary Portland Cement Bitumen 500 gm + filler O gm 48.000 48.000 48.000 50.667 50.667 50.667 Bitumen 500 gm + filler 15 gm 47.500 48.000 46.733 48.000 49.133 49.667 Bitumen 500 m+ filler 30 gm 46.867 47.933 46.667 47.167 48.533 49.467 Bitumen 500gm + filler 45 m 45.833 46.167 45.467 47.033 48.033 48.767 Bitumen 500gm + filler 60 m 44.000 46.100 45.200 46.833 47.833 47.667
softening point test for 60/70 penetration bitumen+ filler
49 48 ' U 48
0
m 47 47 a 46 46 ý 45 ý 45 a 44 44
-a
0369 12
%filler added
Figure 22 Softening Point test 60/70 penetration bitumen added with filler
softening point test for 801100 penetration bitumen+ filler
51 51 50 ý 50 ý 49 L? 49 48 48 47 47
0 36 9 12
+ bitumen+lly ash - bitumen+QD
bitumen+OPC
-o bitumen+Ay ash bitumen+QD bitumen+OPC
%filler added
Figure 23 Softening Point test for 80/100 penetration bitumen added with filler
E) Result for Penetration Test
Table 3 Penetration Test for 60/70 and 80/100 penetration bitumen
60170 Penetration 801100 Penetration
Mixture
Fly Ash
Quarry Dust
Ordinary Portland
Cement Fly Ash
Quarry Dust
Ordinary Portland Cement Bitumen 500 gm + filler O gm 67.667 68.000 68.333 93.000 93.000 93.000 Bitumen 500 gm + filler 15 gm 65.000 63.767 61.333 85.667 84.000 85.333 Bitumen 500 gm + filler 30 gm 63.000 60.433 60.333 78.167 75.667 76.667 Bitumen 500 m+ filler 45 gm 61.000 57.567 58.333 70.333 64.667 66.667 Bitumen 500gm + filler 60 gm 58.667 54.867 56.667 65.000 56.667 57.000
penetration test for 60170 penetration bitumen + filler
70 -1 E68
E66ý cS 64
ý62 158 60
56 54 52 50
0369
% filier added
12
Figure 24 Penetration test for 60/70 penetration bitumen + filler
penetration test for 80/100penetration bitumen+ filler
_ 100 E
- --- E 90
bitumen +
80 ly ash
70 i8- bitumen +
60 _j quarry
dust
50 bitumen +
OPC 40
0369 12
%filler added
4.2 Discussion
Scanning Electron Microscopic test (SEM test) gave more detail on filler itself which is it showed the shape of filler and how the arrangement in the filler itself. This detail information from SEM test reflects the different reading between this filler and cause the different strength in the bituminous mixture.
Refer to figure 8, this image show the particle shape of the fly ash which is small rounded shape and the average diameter for this fly ash particle is 18.24µm- 24.75µm. Figure 10 show the way fly ash particles packed and it is closely packed with each other.
For figure 11, it shows the image of particle shape for Quarry Dust and the shape for quarry dust which is angular and rectangular shape. The average size for this Quarry Dust particle is 72.29 pm - 108.4 µm. Figure 13 show the structural arrangement of Quarry dust particles and it show that Quarry dust particle is not properly packed.
For Ordinary Portland Cement (OPC), figure 14 shows the particle shape of OPC and the particle shape for it are angular and some rounded shaped. The average size for this particle is 16.02 pm and the way of this particle arrange also not closely packed.
X-ray Diffraction Test (XRD test) is conducted to identified the substance that exist in the filler itself. The highest peak in the graph showed the majorities of component that exists in the substance. The peak of the graph also represent the intensity of the substance which means that the more intensity the substance, the higher strength of the substance.
Refer to figure 17, for Fly Ash, the highest peak showed that the mullite is the main component in the fly ash. Mullite is a rare silicate mineral of post-clay genesis[14].
For Quarry Dust in figure 18, it contains contain three component which is quartz, microcline and albite. Quartz is the main component in the quarry dust substance followed by microcline and albite. Quartz is a second most abundant mineral in the Earth's continental crust, after feldspar. It is made up of a continuous framework of SiO4 silicon-oxygen tetrahedra, with each oxygen being shared between two
tetrahedra, giving an overall formula SiO2[15]. Microcline (KAISi3O8) is an important igneous rock-forming tectosilicate mineral. It is a potassium-rich alkali feldspar.
Microcline typically contains minor amounts of sodium[16]. Albite is a plagioclase feldspar mineral. It is the sodium end member of the plagioclase solid solution series [171.
For Ordinary Portland Cement (OPC) in figure 19, Hartrurite is the most major component in the OPC substance followed by calcium magnesium aluminum oxide
silicate.
Based on the result for ductility test, softening point test and penetration test, it showed that the declining pattern as the filler increases. It showed that by increasing adding the filler to the bituminous mixture, the mixture will become harder and stiffer.
For Ductility Test and Softening Point Test, both bituminous mixtures of 60/70 pen bitumen and 80/100 pen bitumen with Fly Ash gave lower reading compared to the bituminous mixture with Quarry Dust and OPC. For Penetration Test, both bituminous mixtures of 60/70 pen bitumen and 80/100 pen bitumen with Quarry Dust gave lower reading compared to the bituminous mixture with OPC and Fly Ash.
For Ductility Test and Softening Point Test, it shows that bituminous mixture with Fly Ash gave lower result and this mean that the mixture is easily to break compares to the bituminous mixture with OPC and Quarry Dust. Refer back to figure 7, Fly Ash is small rounded shape and possibility of the fly ash to slip from each other is higher compared to the other filler. So this will cause the bituminous mixture with fly ash breaks early in the ductility test and melts early in the softening point test.
Quarry Dust gives higher ductility and softening value because it not breaks easily compared to fly ash and OPC. This can relate to the shape of the structure itself. Refer to figure 10, for Quarry Dust, it is angular in shape and this means that it has higher interlocking system between the bitumen and the filler itself. Quarry Dust will hold firmly the bitumen and will not slip easily compared to the fly ash. This also showed
Compared to the Fly Ash, Quarry Dust has higher interfacial region contact with the bitumen because it has more surface areas. For Fly Ash, it is rounded in shape and it has small surface area that contact with the bitumen.
In the XRD test, refer to figure 18; Quarry Dust gave higher intensity compared to the Fly Ash and the OPC. This showed that Quarry Dust is highly crystalline and meaning that it has more strength than Fly Ash and OPC.
For Penetration Test, the purpose is to measures consistency expressed as the distance that a needle vertically penetrates a sample and the bituminous mixture with Quarry Dust gave lower result compared to the bituminous mixture with OPC and Fly Ash.
Fly Ash gives higher penetrate value because it is less hard compared to the Quarry Dust. Refer back to figure 7, the shape of Fly Ash component is small rounded shaped and this mean that the filler can easily slip from the bitumen and gives the needle penetrate more deeply in the bituminous mixture.
For Quarry Dust, the particle shape is angular shape and this will gives the higher interlocking system between the Quarry Dust particle and the bitumen. This will make the bituminous mixture become harder and hard for the penetration needle to penetrate into the bituminous mixture.
In the XRD test also, refer to figure 18; Quarry Dust gave higher intensity compared to the Fly Ash and the OPC. This show that Quarry Dust is highly crystalline and meaning that it has more strength than Fly Ash and OPC. When the Quarry Dust is mix in the bituminous mixture, this will increase the strength and the hardness of the bituminous mixture so that it will make the penetration needle to penetrate into the bituminous mixture lesser than the bituminous mixture with Fly Ash and OPC.
The difference between bituminous mixture of 60/70 penetration and 80/100 penetration bitumen is bituminous mixture with 80/100 will give higher result for ductility test, penetration test and the softening point test. This is because bitumen
34
80/100 is softer than 60/70 penetration bitumen. Even though the reading is not the same, but both of bituminous mixture gave same pattern which is declining pattern in the ductility test, penetration test and softening point test. This shows that by increasing the filler in the both bituminous mixture, it will make the bituminous mixture become harder and stiffer.
CHAPTER 5
CONCLUSION AND RECOMMENDATION
In this study, initial investigation was made to know the characteristic of different filler in different grades of bitumen. The measurements were performed including Scanning Electron Microscopic Test (SEM Test), X-ray Diffraction Test (XRD Test), softening point test, ductility test and penetration test. Based on the findings of the results, the following main conclusions can be drawn according to the results obtained:
" Increasing the filler in the both bituminous mixture, it will make the bituminous mixture become harder and stiffer.
" Bituminous mixture of 60/70 penetration has lower result compared to the bituminous mixture of 80/100 penetration. This is because 60/70 penetration bitumen is more hard than 80/100 penetration bitumen.
" Quarry Dust will give better properties and characteristic for bituminous mixture compared to Fly Ash and Ordinary Portland Cement (OPC). This is because the Quarry Dust will make bituminous mixture become harder and gives high adhesion properties in the bituminous mixture.
" Quarry Dust has higher interlocking system because of it particle shape. It is angular in shape and it can hold firmly between the filler particle and the bitumen.
" It also has higher interfacial region contact with the bitumen because of the particle shape which is angular in shape. Compared to the Fly Ash, Fly Ash is small rounded shape and less surface contact with the bitumen and this will make it is more soft and easily to break.
36
" Quarry Dust has high intensity in the XRD test compare to the fly ash and OPC so that it is high in crystalline which mean that quarry dust is more strength than OPC and fly ash.
From the above results, we can know that quarry dust is the best fillers compared to the fly ash and OPC, and there should be further studies by conducting bituminous mix with the aggregates to know more detail about the filler characteristic in the pavement.
CHAPTER 6
ECONOMIC BENEFIT
Since this study is research based project, total cost for this project can not be defined because all the material is available in the lab itself which is the 60/70 bitumen and 80/100 bitumen, fly ash, quarry dust and the OPC but for the commercial use, quarry dust is cheaper because it is available in the quarry mines and always available. For fly ash, it is one of the residues generated in the combustion of coal.
Fly ash is generally captured from the chimneys of coal-fired power plants and need to purchase from the manufacturer. For Ordinary Portland Cement (OPC), it can be purchased from the cement manufacturer and distributor. Table below show the price range for each filler that used for this project which is fly ash, quarry dust and Ordinary Portland Cement (OPC).
Table 4 Price for each filler
No Description Unit Price(RM)
1 Ordinary Portland Cement (50kg) bag 14.25
2 Fly Ash(1000kg) I tons 250.00
3 Quarry Dust(1000kg) 1 tons 86.00
Based on the price above, it is recommended to use Quarry dust because it is cheap and also give better properties to the bituminous mixture. Quarry Dust will make the bituminous mixture become harder and stiffer. It also has higher adhesion properties to the bituminous mixture and has higher interlocking system compared to the Fly Ash and Ordinary Portland Cement (OPC).
REFERENCES
P]
Basil M. H., and Kevin D. S., (1995), "Analysis of Mineral Fillers and Mastics used in SMA". Journal of the Association of Asphalt Paving Technologies. Volume 64. Portland Oregon, U. S. March.[2] Teh, K. T., MUNIANDY, R., HASSAN, A., HASSIM, S., OMAR, H., (2005)
"THE DEVELOPMENT OF ROAD CONSTRUCTION MATERIAL SELECTION SYSTEM (RC-MSS)", Journal of the Eastern Asia Society for Transportation Studies, Department of Civil Engineering Universiti Putra Malaysia
[3]
Teck, T. K., (2006) "Development Of A Road Construction Material Selection System". Masters thesis, Universiti Putra Malaysia.[4] Miro' R, Martinez A, Perez F and Bianchetto (2004), "EFFECT OF FILLER ON THE AGING POTENTIAL OF ASPHALT MIXTURES", Technical University of Catalonia , Jordi Girona 1-3, Modulo B l, 08034 Barcelona,
Spain
[5] Ishai, I., and J. Craus. "Effects of Some Aggregate and Filler Characteristics on Behaviour and Durability of Asphalt Paving Mixtures". In
Transportation Research Record: Journal of the Transportation Research Board, No. 1530, TRB, National Research Council, Washington, D. C., 1996, pp. 75-85.
[6] Petersen, J., and P. Harnsberger. "Asphalt aging: dual oxidation mechanisms and its interrelationships with asphalt composition and oxidative age hardening". In Transportation Research Record: Journal of the Transportation Research Board, No. 1638, TRB, National Research Council, Washington, D. C., 1998, pp. 47-55.
[7] Ratnasamy and Radin U., 1997. "Modified Rubberized SMA Mix for Malaysian Roads". REAAA Journal. Vol. 7. No. 1. Malaysia.
[8] J. E. Aubert, B. Husson and N. Sarramone. 2006. "Utilization of municipal solid waste incineration (MSWI) fly ash in blended cement Part 1".
Processing and characterization of MSWI fly ash. J. Hazard Mater. B136. pp.
[9]
S. N. Raman, M. F. M. Zain, H. B Mahmud, K. S. Tan (2005). "Suitability of Quarry Dust as Partial Replacement Material for Sand in Concrete"Department of Civil Engineering, Faculty of Engineering, Universiti Malaya, 50603 Kuala Lumpur, Malaysia and Department of Civil and Structural Engineering, Faculty of Engineering, Universiti Kebangsaan Malaysia, 43600 UKM Bangi, Selangor, Malaysia
[10] Richard, C. M., "Effects of aggregates and mineral fillers on asphalt mixture performance", ASTM International, 1992
[ 11 ] MP 8-04.2004. "Designing Stone Matrix Asphalt'. AASHTO Provisional Standards. June.
[12] Anonymous. 2004. American Association of State Highway and Transportation Officials. June.
[13] Anonymous. 2002. "Designing and Constructing SMA Mixtures" State of the Practice, Quality Improvement, Series 122. National Asphalt Pavement Association. March.
[14] Martinön-Torres, Marcos; Thilo Rehren and Ian C. Freestone (November 2006). "Mullite and the mystery of Hessian wares". Nature (London: Nature Publishing Group) 444 (7718): pp. 437-438.
[15] Deer, W. A., R. A. Howie and J. Zussman, "An Introduction to the Rock Forming Minerals". Logman, 1966, pp. 340-355, ISBN 0-582-44210-9 [16] P. C. Rickwood (1981). "The largest crystals". American Mineralogist 66:
885-907.
[17] Petersen JC, Plancher H, Harnsberger PM (1987) "Limetreatment of asphalt to reduce age hardening and improveflow properties". Proc Assoc Asphalt
Paving Technol56: 632-649
[18] Tepordei and Valentin V. (1992) "Crushed stone", Bureau of Mines Annual Report, Washington D. C.
[19] Powel, W. D., Potter, J. F., Mayhew H. C. and Nunn M. E. (1984) "The structural design of bituminous roads", TRRL Lab reports, 1132.
[20] Wood, S. A. and Marek, C. R. (1993) "Recovery and utilization of quarry by- products for use in highway construction, syposium on recovery and
effective reuse of discarded materials and byproducts for construction of highway facilities", Federal Highway Administration, Denver, Colorado.
[21] Soosan, T. G., Jose, B. T. and Abraham, B. M. (2001) "Use of quarry dust in embankment and highway construction". Proceedings of Indian Geo- Technical Conference, December, Indore,
pp. 274-277.
[22] Soosan, T. G., Jose, B. T. and Abraham, B. M. (2000) "Improvement of ground and highway sub-bases using quarry waste". Proceedings of International seminar on civil engineering, ICCE, 2001, IISc. Bangalore, pp. 730-737- July 2001.
[23] Wojciech G., Jaroslaw, W., (2008), "The structure of mineral fillers and their stiffening properties in filler-bitumen mastics" Institute of Civil
Engineering, The Poznan University of Technology, ul. Piotrowo 5, Poznan 60-965, Poland
[24] Pilat J (1994), "Influence of mineral dusts properties on rheological features of mineral-bituminous composites". Prace Naukowe, Budownictwo z. 126, Wydawnictwo Politechniki Warszawskiej, Warszawa, Poland, p 98
[25] Kandhal PS (1999) "Evaluation of baghouse fines for hot mix asphalt", National asphalt pavement association. Information Series 127, February,
1999, p 36
[26] Cooley L, Stroup-Gardiner M, Brown ER, Hanson DI, Fletcher M (1998)
"Characterization of asphalt-filler mortars with superpave binder tests", Paper presented at the 1998 annual meeting of the association of asphalt paving technologists. Boston, March, 1998, vol 67-98, p 42
[27] Kandhal PS (1981) "Evaluation of baghousefines in bituminous paving mixtures", proceedings. J Assoc Asphalt Paving Technol 50: 150-210 [28] Anderson DA (1987) "Guidelines on the use of baghouse fines, national
asphalt pavement association", Information Series 101, Maryland, November, 1987
[29] Rigden PJ (1947) "The use of filler in bituminous road surfacings'. J Soc Chem Ind 66: September, 1947
[30] Heukelom W (1965) "The role offiller in bituminous mixes". Proc Assoc Asphalt Paving Technol 34: 396-429
[311 Anderson DA, Goetz WH (1973) "Mechanical behavior and reinforcement of mineral filler--asphalt mixtures". Proc Assoc Asphalt Paving Technol 42: 37-66
[32] Grabowski W, Wilanowicz J (2004) "Influence of structural parameters of mineral fillers on their functional features- research and mathematical modeling". Archives of civil engineering, L, 1, Pan'stwowe Wydawnictwa
Naukowe, Warszawa, s. 161-173
[33] Grabowski W, Wilanowicz J (1996) "Evaluation of structure of mineral dusts applied in Hot Mix Asphalt". Drogownictwo, nr 8, Stowarzyszenie
In_zyniero'w i Techniko'w Komunikacji, Warszawa, s. 238-242
[34] Shahrour, M. A., Saloukeh, B. G., (1993) "Effect of quality and quantity of locally produced filler (passing sieve No. 200) on asphaltic mixtures in Dubai". XII Congreso Mundial IRF, Madrid, Spain, 1993, vol IV, pp 1053- 1071
[35] Kim J, Jeon J, Lee K (2002) "Rheological properties of asphalt binder modified by slag dust". Paper presented at the 3rd international conference on bituminous mixtures and pavements, Session 1, No. 4, Aristotle University of Thessaloniki, Thessaloniki, Greece, 21-22 November 2002
[36] European Standard EN 13043 (2002) "Aggregates for bituminous mixtures and surface treatments for roads, airfields and other trafficked areas".
European committee for standardization, Brussels
APPENDICES