Factors Associated with Farmers’
Adaptation Practices to Weather Variability in Rice-based Farming System in Myinmu Township, Sagaing Region, Myanmar
1*KAY THI KHAING, 2ROWENA DT. BACONGUIS,
2EVELIE P. SERRANO, 3POMPE C. STA CRUZ, and 4RAMONCITO G. CAMBEL
ABSTRACT. Due to its dependence on agro-climate condition, the rice-
ȋȌǡ Myanmar is one of the sectors that is vulnerable to weather variability.
This study aimed to analyze the association of adaptation practices on production and income of rice farmers in Myinmu Township. One
ϐ
were conducted to gather primary data. Results revealed that most farmers received agricultural and weather information from fellow farmers, extension agents from the Department of Agriculture, attendance to group meetings, and mass media channels such as radio and television. Adaptation practices were categorized into changing cultivated varieties and crops, changing farming systems, conserving rain water, improving irrigation systems, and engaging in non-farm activities. Factors associated with adaptation practices were type of agriculture (ecosystem), total cultivated area, total rice cultivated area, credit accessibility, attendance to training programs and access to inputs. Overall, results revealed an observable pattern of increased weather variability and minimal adaptation practices, which calls for a more vigorous extension intervention to promote practices that can
ǯ
income.
ǣ adaptation practices, sources of information, extension framework
________________________
1Department of Agricultural Extension, Yezin Agricultural University, Yezin, Myanmar
2College of Public Affairs and Development (CPAf), University of the Philippines Los Baños (UPLB), Laguna, Philippines
3College of Agriculture and Food Science, UPLB, Laguna, Philippines
4College of Arts and Sciences, UPLB, Laguna, Philippines
*Corresponding author: +95-9254023393, [email protected]
INTRODUCTION
Global climate change is reshaping crop production and the farming communities (Sharma, 2015), which affects the availability of water for irrigation, amount of solar radiation for plant growth,
ȋǡ ǡ Ƭ ǡ ʹͲͳͲȌǤ
that climate change will trigger the increased occurrence of extreme
ϐǡǡ ǡ
the poverty situation in many rice-farming communities (ADAS UK Ltd.
and University of Leeds, 2013).
Myanmar is among the most vulnerable to the impacts of weather variability as it has experienced rainfall scarcity, irregular
ǡ ǡ ǡ ϐǡ ǡ
ǡϐ ǡǡ
(Kywe, Hom, Htwe, Hein, & Than, 2015). It has several variant climate
ȋȌǡǡǡǤ Annual rainfall intensity is far lower than normal average in Central Myanmar and this area also suffers from below average and uneven
ǡͶͲԨ
summer (Climate Change Management, 2010 as cited in The, 2012). In
ǡ ϐ
declines in total rainfall amount that led to reduced water availability for consumption and farming (Livelihoods and Food Security Trust Fund, 2014).
Mary and Majule (2009) argued that while climate change is
ǡ Ǧ ϐ Ǥ
ȋȌ ϐ
ȋȌDz
actual or expected climatic stimuli or their effects, which moderates
ϐ dz ȋ
on Climate Change, 2007, p. 6). Adger et al. (2007, p. 720), citing the Fourth Assessment Report of the IPCC, highlighted that CCA refers to Dz ǡ
ultimately enhance resilience or reduce vulnerability to observed or expected changes in climate.”
Singh and Tyagi (2003), as cited in Billah (2013), reported that farmers with reasonable adaptive capacities had little constraints in adapting to climate change. If not handled properly, however, these constraints can potentially reduce productivity. Thus, this study contends that farmers need to have adaptive capacities, which the
agricultural extension agency can help address. Central to this study, therefore, is the need to examine the role of extension in dealing with issues relating to weather variability adaptation in the rice-based farming system.
In Myanmar, agricultural extension is primarily responsible for providing educational activities, collecting agriculture-related data, enforcing standard weights and measures, procuring and distributing farm inputs such as high-quality seeds, fertilizers, and insecticides.
However, adaptation to weather variability is a complex activity that requires more than addressing a component technology or providing component inputs.
Due to the importance of adaptive capacities and adaptation practices in addressing weather variability, this study aimed to discuss the sources of information on adaptation practices to weather Ǣ Ǣ
ǯ Ǣ
Ǣ
strategies to weather variability.
METHODOLOGY Theoretical Framework
ȋʹͲͲȌ ϐ
ǡ ϐ
interval. Climate is usually based on the weather in one locality averaged for at least 30 years. Climate change, on the other hand, refers to direct or indirect activities of humans, leading to changes in global atmosphere components and changes of natural climate
ȋ
Convention on Climate Change, 2007). Climate change would lead to more extreme climate events, compromising crops, food security, shelter, and livelihoods (Intergovernmental Panel on Climate Change, 2007). An extreme weather event refers to meteorological conditions that are rare for a particular place and/or time, such as an intense storm or heat wave. An extreme climate event, on the other hand, is an unusual average over time of a number of weather events, for example
ȋ ǡʹͲͲ͵ȌǤ
An effective way to address the impacts of weather variability is to integrate adaptation measures into sustainable development strategies to reduce the pressure on natural resources, improve
ǡ Ǧ
of the poor. Adaptation means the adjustment in natural or human systems in response to actual or expected climatic stimuli or their
ǡ ϐ
(Intergovernmental Panel on Climate Change, 2001). Adaptation also refers to the process of adapting and the condition of being adapted.
Societies have a long record of adapting to the impacts of weather and ϐ ǡ
ǡǡȋ
et al., 2007).
Regarding human dimensions, Smit (1993) noted that adaptation involves adjustments to enhance the viability of social and economic activities and reduce their vulnerability to climate, including its current variability and extreme events as well as longer term climate Ǥ
to reduce vulnerability or enhance resilience in response to observed or expected changes in climate and associated extreme weather events. Adaptation occurs in physical, ecological, and human systems.
It involves changes in social and environmental processes, perceptions
ǡ
to realize new opportunities (Adger et al., 2007).
ǡ while others are planned and implemented by governments on behalf of societies, sometimes in anticipation of change but mostly in response to experienced climatic events, especially extremes (Adger, Huq, Brown,
ǡ Ƭ ǡ ʹͲͲ͵Ǣ ǡ ʹͲͲ͵Ǣ Ƭ ǡ ʹͲͲ͵ȌǤ
a long record of practices to adapt to the impacts of weather as well as natural climate variability on seasonal to inter annual timescales Ȃ ÓǦ ȋȌǤ
ϐ ǡ
ǡ Ǧ ǡ famine warning systems, insurance, water storage, and supplementary irrigation (Mace, 2006).
According to Mace (2006), technological adaptation can serve as potent means of adapting to climate variability and change. New technologies can be developed to adapt to weather variability, and the transfer of appropriate technologies to developing countries forms an
important component of the UNFCCC. However, technologies are not a panacea. Adaptation options that are effective in one location may be ineffective in other places, or may create new vulnerabilities for other places or groups.
Conceptual Framework
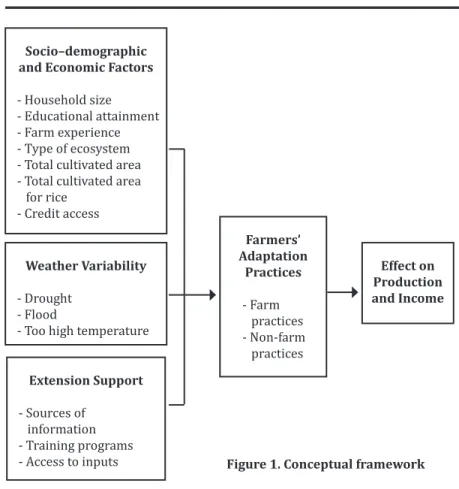
in Figure 1. Adaptation refers to farm and non-farm adjustments in relation to actual or expected changes in weather variability. The weather variability phenomenon investigated was determined based on the frequency of occurrence using the review of climate data for
͵Ͳ Ǥ ǡ ϐǡ
too high temperature were the most frequent weather events in the area of study. Employing any adaptation measure is hypothesized to be associated with socio-demographic characteristics of the farm household. The selected socio-demographic factors, which were based on review of literature, included household size, educational attainment, farm experience, type of ecosystem, total cultivated area, total cultivated area for rice, and credit access. Additionally, the choice of adaptation measures will also depend on access to information, training programs, and agricultural inputs from different institutions.
These adaptation practices are hypothesized to be associated with production and income.
Research Sites
ϐ ǡ
ǡ ȋȌ Ǥ
study area was located in Myinmu Township having a total population of 113,339 with 25,278 households. The respondents came from 10 purposively selected villages (Figure 2).
The general criteria in choosing these villages were the
ϐ ȋ ʹȌ
extent of occurrences of extreme weather events. Occasionally, all 10
ϐ
rainy season. Except for the villages of Kan Pyar, Kan Taw, and Pe Ku, some areas for crop cultivation in the other seven villages are affected
ϐ ȋȌ
ϐǤ Ǣ
month is August. On the other hand, some cultivated areas in the
ǡǡϐ
ǡ dams, and canals.
Respondents of the Study
The total number of sampled households was calculated using
ǯȋͳͻ͵ȌǤʹͷǡʹͺͳͲ
margin of error, a total of 100 sample size was computed.
While the computation suggested 100 respondents, the researchers opted to increase the number of respondents to 150. Hence, 15 respondents per village were selected using simple random sampling.
Socio–demographic and Economic Factors - Household size - Educational attainment - Farm experience - Type of ecosystem - Total cultivated area - Total cultivated area for rice
- Credit access
Weather Variability - Drought
- Flood
- Too high temperature
Extension Support - Sources of
information - Training programs - Access to inputs
Farmers’
Adaptation Practices - Farm practices - Non-farm practices
Effect on Production and Income
Figure 1. Conceptual framework
ǣ 1. Kan Pyar Village 3. Mu Wa Ywar Htaung Village 5. Htee Saung Village 7. Pe Ku Village 9. Let Ka Pin Village ʹǤͶǤǤͺǤͳͲǤ Figure 2. Myanmar relative to its neighboring countries (left); Myinmu Township highlighting the 10 villages covered by the study (right) (Department of Agriculture, 2017)
Data Gathering Instrument in Research
ʹͲͳǤ
data were obtained through survey and interviews. The survey questionnaire included socio-demographic and socio-economic characteristics of farmers, major impacts of weather variability over the past 5 and 10 years, perceived impacts of weather variability on crop production, adaptation of farming practices in response to climate change, constraints faced by farmers in adapting to weather variability, and extension support received. Primary data were collected from rice growing farmers, while secondary data were gathered from the Department of Agriculture (DOA) and the Department of Meteorology and Hydrology (DMH) in Myinmu Township and from published and unpublished documents from other government agencies, journals,
ǡ Ǥ ȋ Ȍ
informant interviews (KIIs) were also conducted in 10 villages. The discussions revolved around resources available in the community, perceptions of climate change and weather variability, experiences and
ǡ ǡ
constraints, agricultural extension services, and forms of institutional support.
Statistical Analysis
The data collected were coded and analyzed using Microsoft
ͳǤͲǡ ȋȌ
20.0, and STATA Version 14.1. STATA is a command and menu-driven
ǡǡ and statistical analyses (Stata Corp, 2019). SPSS is a popular and widely
ǡ data transformations, and interpretation of results from a large sample
ȋǡʹͲͳͶȌǤ
Descriptive statistics such as frequency, percentage, mean, and standard deviation were used to describe the local patterns of rainfall variability and other variables. Correlation analyses among variables were performed to determine if association exists among variables. Spearman correlation analysis was employed to determine if monotonic association exists between variables measured such as some socio-demographic variables (education level, household size, farming experiences, total cultivated area and total cultivated area for rice) and
ȋƬǡ 2003). On the other hand, Chi-square Test of Independence was used to determine if association exists between two categorical variables such as crop production and family income and adaptation practices.
RESULTS AND DISCUSSIONS
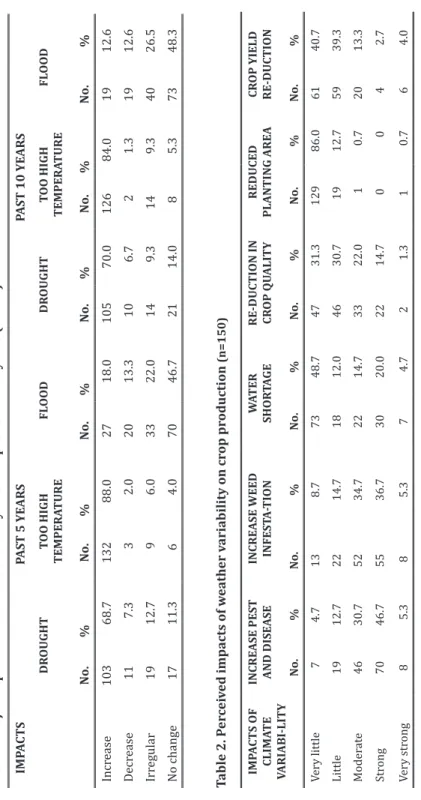
Major Impacts of Weather Variability over the Past 5 and 10 Years Table 1 shows the impact of weather variability over the past 5 and 10 years. Respondents reported increased occurrence of drought (69%) and high temperature (88%) in the past 5 years. In the past 10 years, almost the same trend was reported: There were observed increases in the occurrence of drought (70%) and high temperature (84%). ǡ
interviews revealed that drought and high temperature occurred more frequently during the periods covered.
Perceived Impacts of Weather Variability on Crop Production Agricultural production is among the major economic activities
ǯ
(rainfed) and lowland (irrigated) rice farming. Table 2 shows the impacts of weather variability on crop production as reported by the respondents. Drought and too high temperature led to water shortage that eventually resulted in yield reduction and soil degradation. Delayed monsoon rain, on the other hand, reduced the area for cultivation for
Ǥ ǡ ϐ
yield loss.
Pest and disease infestation was the most serious problem in the study area followed by weed infestation due to weather variability.
Nearly half (47%) of respondents indicated that their crop production was strongly affected by infestation of pest and diseases, while more than one-third (37%) noted that their crops were strongly affected by weeds. Less than one-fourth (20%) of the respondents indicated that their crop production was affected by water shortage.
In terms of crop quality reduction, only 15 percent of the respondents reported that they suffered strongly while the majority
Table 2. Perceived impacts of weather variability on crop production (n=150) IMPACTS OF CLIMATE VARIABI-LITY
INCREASE PEST AND DISEASEINCREASE WEED INFESTA-TIONWATER SHORTAGERE-DUCTION IN CROP QUALITYREDUCED PLANTING AREACROP YIELD RE-DUCTION No.%No.%No.%No.%No.%No.% Very little 74.7138.77348.74731.312986.06140.7 Little1912.72214.71812.04630.7 1912.75939.3 Moderate4630.75234.72214.73322.0 1 0.72013.3 Strong7046.75536.73020.02214.7 0 0 4 2.7 Very strong8 5.3 85.37 4.7 2 1.3 1 0.7 6 4.0
Table 1. Major impacts of weather variability over the past 5 and 10 years (n=150) IMPACTS PAST 5 YEARSPAST 10 YEARS DROUGHTTOO HIGH TEMPERATUREFLOODDROUGHTTOO HIGH TEMPERATUREFLOOD No.%No.%No.%No.%No.%No.% Increase10368.713288.02718.010570.012684.01912.6 Decrease 11 7.3 3 2.02013.3 10 6.7 2 1.31912.6 Irregular 1912.7 9 6.03322.0 14 9.3 14 9.34026.5 No change 1711.3 6 4.07046.7 2114.0 8 5.37348.3
DzdzDz ǤdzȋͺΨȌ
reported that they reduced their planting area, which they considered as a minor impact of weather variability. While most farmers encountered problems relating to pests, diseases, and weeds, nearly half (41%) of
ϐ Ǥ
The results of the FGD offer an explanation to the minor yield reduction experienced by farmers despite being strongly affected by weather extremes. It was found that there were several sources of irrigation in the study area such as a reservoir, tube well, and the River Water Pumping Station. A farmer from Pyawt said:
“We used chemical insecticides and/or herbicides to manage insect pests and weeds, respectively. When we were confronted by water shortage because of drought during the planting period, we sourced water from the River Water Pumping Station. If
ϔ ǡ
ϔ
well.”
Farmer’s Communication Exposure
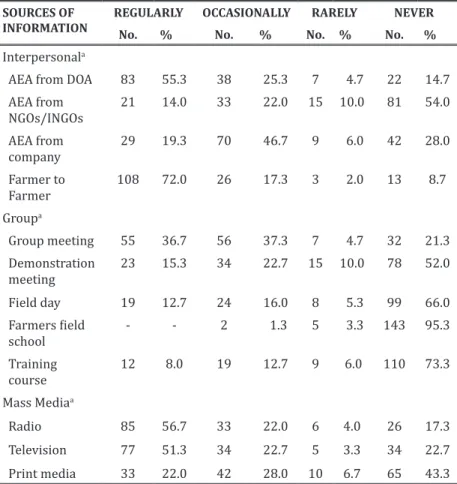
Sources of information on farmers’ adaptation practices.
ϐ
in disseminating to farmers new agricultural technologies and farming adaptation practices. Information sources relating to adaptation practices are presented in Table 3.
Under interpersonal channel, most (72%) of the respondents reported that they accessed information from their co-farmers regularly. Similarly, more than half (55%) of the farmers said that they accessed information from agricultural extension agents (AEA) from DOA on a regular basis. In sum, the farmer-farmer mode of accessing information appears to be the most effective among the sources of interpersonal information.
Group meetings were a regular source of information for
Ǧ ȋ͵ΨȌ ǦǤ ϐ
that should be highlighted under the Group category is that a large majority (95%) of the farmer-respondents reported that they have
ϐ ȋ ȌǤ
Table 3. Percent distribution of accessibility of information sources (n=150) SOURCES OF
INFORMATION
REGULARLY OCCASIONALLY RARELY NEVER
No. % No. % No. % No. %
Interpersonala
AEA from DOA 83 55.3 38 25.3 7 4.7 22 14.7
AEA from
NGOs/INGOs 21 14.0 33 22.0 15 10.0 81 54.0
AEA from
company 29 19.3 70 46.7 9 6.0 42 28.0
Farmer to
Farmer 108 72.0 26 17.3 3 2.0 13 8.7
Groupa
Group meeting 55 36.7 56 37.3 7 4.7 32 21.3
Demonstration
meeting 23 15.3 34 22.7 15 10.0 78 52.0
Field day 19 12.7 24 16.0 8 5.3 99 66.0
ϐ
school - - 2 1.3 5 3.3 143 95.3
Training
course 12 8.0 19 12.7 9 6.0 110 73.3
Mass Mediaa
Radio 85 56.7 33 22.0 6 4.0 26 17.3
Television 77 51.3 34 22.7 5 3.3 34 22.7
Print media 33 22.0 42 28.0 10 6.7 65 43.3
aMultiple response Legend:
AEA: agricultural extension agents INGOs: International NGOs DOA: Department of Agriculture NGOs: Non-government organizations
Interestingly, most (73%) of them also said that they have never accessed information from training courses.
Radio (57%) and TV (51%) were accessed regularly by farmers.
Nearly half (43%) of the farmer-respondents have never accessed information from the print media.
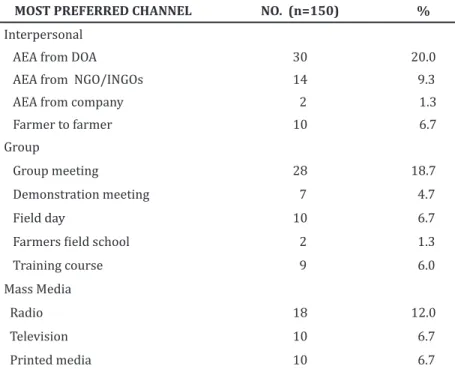
Farmers’ communication channels. It was also in the
Ǧǯ
sources of information by farmer-respondents. Summarized in Table 4,
ϐ
promoting adaptation practices. The AEA from DOA were mentioned by almost one-fourth (20%) of the respondents as the most preferred
immediately. Group meetings occupied the second position in the most preferred channels (19%), while radio came in third (12%). Farmers said that they prefer to get information from radio because they can easily listen to the weather and agricultural information being broadcasted. They can also carry it anywhere and listen to it.
Overall, interpersonal sources, particularly the AEA, were the
ǤȋʹͲͳͳȌ
preferred sources of information because they can outrightly respond to the technical issues raised by farmers. Mass media, especially the print media, is least preferred owing to the high number of farmers
ϐ Ǥ
Table 4. Percent distribution of communication channel preferences
MOST PREFERRED CHANNEL NO. (n=150) %
Interpersonal
AEA from DOA 30 20.0
AEA from NGO/INGOs 14 9.3
AEA from company 2 1.3
Farmer to farmer 10 6.7
Group
Group meeting 28 18.7
Demonstration meeting 7 4.7
Field day 10 6.7
ϐ 2 1.3
Training course 9 6.0
Mass Media
Radio 18 12.0
Television 10 6.7
Printed media 10 6.7
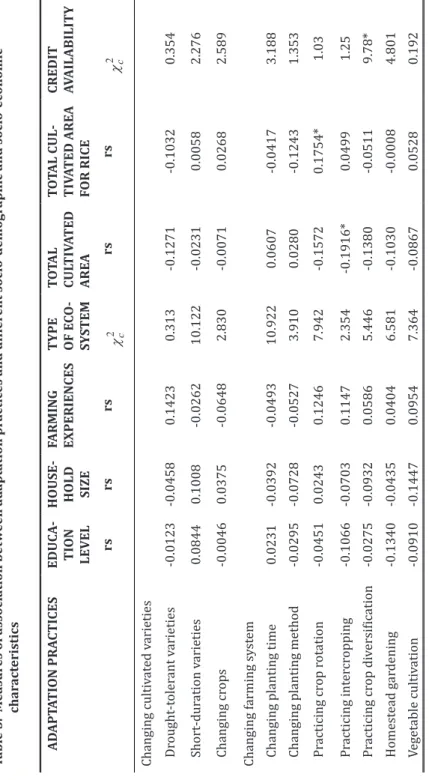
Factors Associated with Adaptation Practices to Weather Variability
Association between the farmers’ adaptation practices and socio-demographic and economic variables. Spearman correlation analysis was performed on selected socio-demographic and
Ǧ ǯ ͳͺ
ϐ ȋ ͷȌǤ
was to verify if association exists between these adaptation measures and the socio-demographic and socio-economic variables of farmers.
Ǧ ϐ Ǧ
statistics are shown in Table 5.
Adaptation practices were categorized into changing cultivate varieties, changing farming system, rain water conservation, improving irrigation system, and non-farm adaptation activities. These adaptation practices were initially shortlisted from the list of adaptation farming practices gathered from review of literature and from interviews with
Ǥ
Results revealed that type of ecosystem, total cultivated area, total cultivated area for rice, and credit availability were associated with some adaptation practices. Based on the analysis, there was an association between the frequency of intercropping and total ͷ ϐ Ǥ
of 1 as practicing and 4 as not practicing, results showed that as the
ǡ intercropping. In addition, there was also an association between the practice of crop rotation and total cultivated area for rice. As the
ǡ
practice crop rotation. It appears that as farmers have larger farms, the propensity to adopt intercropping increases.
However, when the farm area is planted with rice alone, they prefer to plant rice all throughout the year. Ecosystem types were
ϐ Ȁ
ͳ ϐ Ǥ
ǡ
would dig a well or use water pumps to address this issue is high. It can be inferred that total area cultivated for rice affected the decision to
ϐ
Ǥ ǡ ϐ
ϐ Ǥ
Table 5. Measures of association between adaptation practices and different socio-demographic and socio-economic characteristics ADAPTATION PRACTICESEDUCA- TION LEVEL
HOUSE- HOLD SIZE
FARMING EXPERIENCESTYPE OF ECO- SYSTEM TOTAL CULTIVATED AREA TOTAL CUL- TIVATED AREA FOR RICE
CREDIT AVAILABILITY rsrsrsrsrs Changing cultivated varieties Drought-tolerant varieties-0.0123-0.04580.14230.313 -0.1271-0.10320.354 Short-duration varieties0.08440.1008-0.026210.122 -0.02310.00582.276 Changing crops-0.00460.0375-0.06482.830 -0.00710.02682.589 Changing farming system Changing planting time0.0231-0.0392-0.049310.922 0.0607-0.04173.188 Changing planting method-0.0295-0.0728-0.05273.910 0.0280-0.12431.353 Practicing crop rotation-0.04510.02430.12467.942 -0.15720.1754*1.03 Practicing intercropping-0.1066-0.07030.11472.354 -0.1916*0.04991.25 ϐ -0.0275-0.09320.05865.446-0.1380-0.05119.78* Homestead gardening-0.1340-0.04350.04046.581 -0.1030-0.00084.801 Vegetable cultivation-0.0910-0.14470.09547.364 -0.08670.05280.192 ȗϐ ͲǤͲͷϐ ȗȗϐ ͲǤͲͳϐ
2 cF2 cF
ͻǤ ADAPTATION PRACTICESEDUCA- TION LEVEL
HOUSE- HOLD SIZE
FARMING EXPERIEN- CES
TYPE OF ECO- SYSTEM
TOTAL CULTIVATED AREA TOTAL CUL- TIVATED AREA FOR RICE
CREDIT AVAILABILITY rsrsrsrsrs Rain water conservation Digging pond/well-0.12000.08090.153512.209*-0.02530.12002.865 Mulching with crop residue0.1047-0.0487-0.00015.811 0.1046-0.11570.241 Improving irrigation system Use of pumps for irrigation-0.12210.12340.037020.638**0.01500.14501.842 Use of drainage system-0.03620.0728-0.05044.419 0.0511-0.13466.184 Non-farm activities 0.0369-0.1469-0.14285.810 0.0399-0.03700.049 Engaging in trading activities-0.12540.06660.14110.640 0.1392-0.00020.014 ȋȌ-0.0059-0.0951-0.02255.649 0.11960.02430.273 Migration-0.0422-0.1072-0.07675.8000.0305-0.07400.80 ȗϐ ͲǤͲͷϐ ȗȗϐ ͲǤͲͳϐ
2 cF2 cF
farmers would need credit to buy inputs such as high-quality seeds and fertilizers. Yirga and Hassan (2010) noted that access to credit of a household indicates the availability of funds that will enable adoption of adaptive strategies.
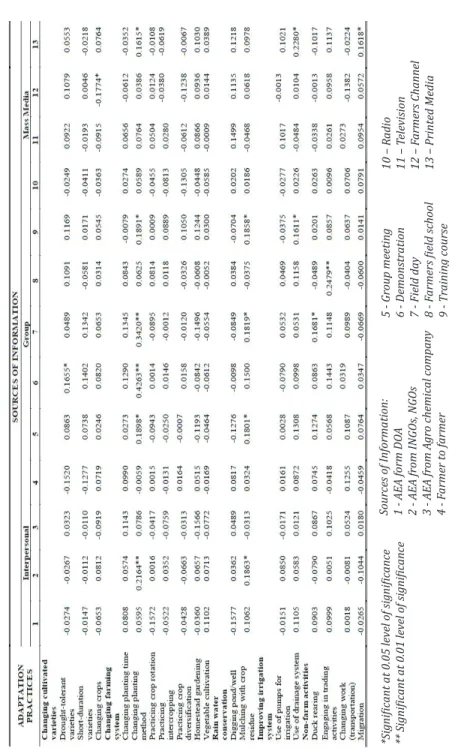
Association between farmers’ adaptation practices and information sources.
analysis shows the association between the adaptation practices and
ȋȌǤϐ
using drought-tolerant varieties and getting information from
ͷ ϐ Ǥ
of 1 as practicing and 4 as not practicing for adaptation practices and a reverse coding of 1 as regular source of information and 4 as not at all for source of information as farmers participate in demonstrations,
ǦǤǡ
ǯ decision regarding changing cultivated varieties/crops in their farm as a response to weather variability.
ǡϐ
evidence that there existed a positive monotonic association with some
ȋǦȏȐ
ȏȐǡ ǡ ϐ ǡ
meetings, training course, and printed media) at 1 percent level of
ϐ ͷ ϐ ǡ Ǥ
that as farmers tend to use these as sources of information, they are
Ǥ
Ǥ
information, attendance to demonstration had a moderate association with changing of planting method.
Results of the analysis further showed that there was a very
Ȁǡǡϐǡ and training course as sources of information at 5 percent level of
ϐ Ǥ
ǡ Ǥ
ϐ that there existed a positive monotonic association between using the drainage system and getting information from training course
Table 6. Summary of relationships between some adaptation practices and information sources ȗϔ ͶǤͶͻϔ ȗȗϔ ͶǤͶͷϔ Sources of Information: 1 - AEA form DOA 2 - AEA from INGOs, NGOs 3 - AEA from Agro chemical company 4 - Farmer to farmer 5 - Group meeting 6 - Demonstration 7 - Field day ;Ǧ ϔ 9 - Training course 10 – Radio 11 – Television 12 – Farmers Channel 13 – Printed Media
ͷ ϐ Ǥ
as farmers tend to use these as sources of information, they are more
Ǥ
ǡ Ǧ
ϐϐ
ͷ ϐ Ǥ
ϐ ǡ
Ǥ ǡ
activities and getting information from ϐ
ͳ ϐ Ǥ
ǯ
in non-farm activities as a way to cope with the adverse impacts of weather variability.
In sum, results cogently showed that the various sources of
ǯ
cultivated varieties/crops, changing farming system, conserving rain water, and engaging in non-farm activities in their farm as responses to weather variability. Overall, information sources such as AEA from
ǡǡǡǡϐǡ ǡ training course, and printed media were associated with the decision to employ most of the adaptation practices.
Attendance to training programs and access to inputs.
Knowledge of different agricultural information and technologies is important in adapting to weather variability. Farmers obtained information on these matters by attending training programs provided by public and private institutions. Among the training providers were the DOA, Agricultural Mechanization Department (AMD), and INGOs (e.g., World Hunger Health). Some of the topics relating to adaptation
ϐ
and farm machinery. The descriptive statistics for information and
as attendance to agriculture-related training programs and access to inputs provided by different organizations are shown in Table 7.
Most (67%) of the respondents reported that they have never attended any training program provided by the public sector through DOA, while about a third (33%) reported to have attended related
ϐ
to weather variability. On the other hand, this may imply that only a
regards adaptation practices to climate change. None of the farmers surveyed reported that they have attended a training on understanding the technical aspects of weather variability.
There were several input providers in the research site. For instance, there were public and private organizations that provided seeds to farmers through DOA. The AMD provided access to farm machines through custom hiring services or by selling them with different payment terms. Maung (2014) reported that the chance is high for farmers to adapt to weather variability by adjusting their
Ǥǡ 68 percent of the respondents reported that they have no access to the inputs cited above.
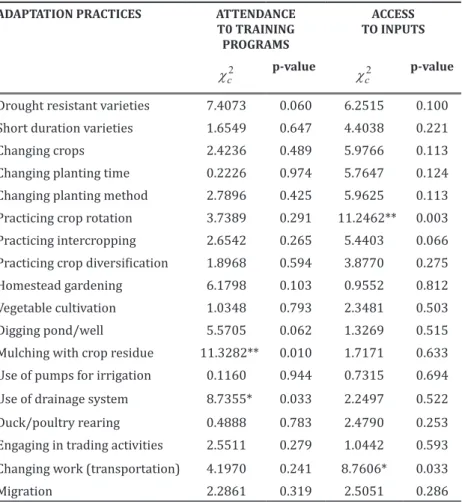
Association of farmers’ adaptation practices and attendance to training programs. Correlational analyses were conducted to identify the factors that are associated with the decisions of farmers in employing certain adaptation practices (Table 8). There
ϐ
the training attendance provided by private or public sector through DOA and the mulching with crop residue at 1 percent level, p value = 0.010. Considering the raw data, the association means that a large number of farmers who do not attend training provided by private or public sector through DOA also do not practice mulching with crop
Ǥ ǡ ϐ
association between the training attendance provided by private or
ǯ
ͷ ϐ ǡαͲǤͲ͵͵Ǥ
that a large number of farmers who do not attend training provided Table 7. Forms of access to institutional support
CHARACTERISTICS NO. (n=150) %
Attendance to training programs
Yes 50 33.3
No 100 66.7
Access to inputs
With access 48 32.0
Without access 102 68.0
by private or public sector through DOA also do not use the drainage
Ǥǡϐ
between training attendance and other adaptation practices to weather variability. An initiative of the Food Security and Agriculture Thematic Group (2010), as cited in Maung, Pulhin, Espaldon, and Lalican (2016),
ǡ
ǡ
poorly developed to promote community resilience for food security in Myanmar.
Table 8. Measures of association among attendance of training program, access to input, and some adaptation practices
ADAPTATION PRACTICES ATTENDANCE T0 TRAINING PROGRAMS
ACCESS TO INPUTS
c2
F p-value Fc2 p-value Drought resistant varieties 7.4073 0.060 6.2515 0.100 Short duration varieties 1.6549 0.647 4.4038 0.221
Changing crops 2.4236 0.489 5.9766 0.113
Changing planting time 0.2226 0.974 5.7647 0.124
Changing planting method 2.7896 0.425 5.9625 0.113 Practicing crop rotation 3.7389 0.291 11.2462** 0.003 Practicing intercropping 2.6542 0.265 5.4403 0.066
ϐ 1.8968 0.594 3.8770 0.275
Homestead gardening 6.1798 0.103 0.9552 0.812
Vegetable cultivation 1.0348 0.793 2.3481 0.503
Digging pond/well 5.5705 0.062 1.3269 0.515
Mulching with crop residue 11.3282** 0.010 1.7171 0.633 Use of pumps for irrigation 0.1160 0.944 0.7315 0.694 Use of drainage system 8.7355* 0.033 2.2497 0.522
Ȁ 0.4888 0.783 2.4790 0.253
Engaging in trading activities 2.5511 0.279 1.0442 0.593
ȋȌ 4.1970 0.241 8.7606* 0.033
Migration 2.2861 0.319 2.5051 0.286
ȗϐ ͲǤͲͷϐ ȗȗϐ ͲǤͲͳϐ
ϐ
access to agricultural inputs provided by either private or public sector
ͳ ϐ Ǥ This means that if farmers will have more access to agricultural inputs, their chance to adapt to weather variability is high. Moreover, there was
ϐ
ͷ ϐ Ǥ
large number of farmers who do not have access to inputs also do not use the drainage system.
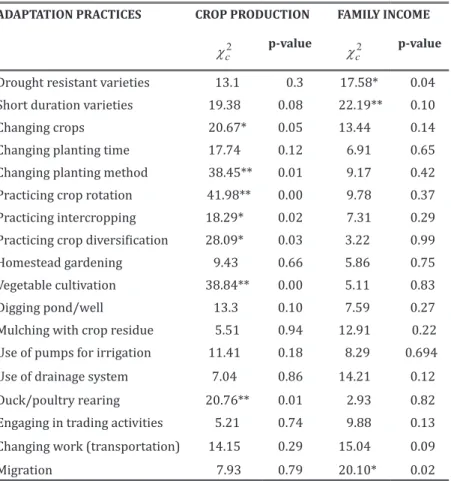
Perceived Effects of Farmers’ Adaptation Practices on Agricultural Production and Family Income
An association existed between crop production and adaptation practices (i.e., changing planting method, practicing crop
ǡ ǡ Ȍ ͲǤͲͳ
ϐ ȋͻȌǤ
area reduced the adverse impacts of weather variability on their crop production by adapting these practices. This association can be proven by the result in Table 2 showing that nearly half (41%) of the farmers perceived that the weather variability reduced only slightly their Ǥǡϐ
production and the adaptation practices involving changing crops,
ǡ ϐ Ǥ
data pointed out that the factors affecting crop production were those adaptation practices that engage farmers in activities such as animal
ǡ ϐ ǡ Ǥ Ǧϐ
family income and short-duration varieties. The use of short-duration varieties, in general, is recommended as an adaptive practice to weather variability as it somehow enables the farmers to avoid the
ϐǤ
ǡ ϐ
income and the use of drought-tolerant varieties and migration. This means that use of drought-tolerant varieties and migration affected family income. Overall, it can be deduced that only these three adaptation practices were the factors that affected family income.
Table 9. Association between crop production and family income, and farmers’ adaptation practices
ADAPTATION PRACTICES CROP PRODUCTION FAMILY INCOME c2
F p-value Fc2 p-value Drought resistant varieties 13.1 0.3 17.58* 0.04 Short duration varieties 19.38 0.08 22.19** 0.10
Changing crops 20.67* 0.05 13.44 0.14
Changing planting time 17.74 0.12 6.91 0.65 Changing planting method 38.45** 0.01 9.17 0.42 Practicing crop rotation 41.98** 0.00 9.78 0.37 Practicing intercropping 18.29* 0.02 7.31 0.29
ϐ 28.09* 0.03 3.22 0.99
Homestead gardening 9.43 0.66 5.86 0.75
Vegetable cultivation 38.84** 0.00 5.11 0.83
Digging pond/well 13.3 0.10 7.59 0.27
Mulching with crop residue 5.51 0.94 12.91 0.22 Use of pumps for irrigation 11.41 0.18 8.29 0.694
Use of drainage system 7.04 0.86 14.21 0.12
Ȁ 20.76** 0.01 2.93 0.82 Engaging in trading activities 5.21 0.74 9.88 0.13
ȋȌ 14.15 0.29 15.04 0.09
Migration 7.93 0.79 20.10* 0.02
ȗϐ ͲǤͲͷϐ ȗȗϐ ͲǤͲͳϐ
Proposed Extension Framework in Promoting Adaptation Strategies to Weather Variability in Rice-based Farming Systems ͵
adaptation strategies to weather variability in a rice-based farming system. It should be noted that most farmers adopt only selected adaptation farming practices such as crop rotation and use of short- duration varieties. Given the ongoing and projected weather variability,
Outcome: Resilient Farms and Farmers Objectives - Improved adaptation strategies on rice-based farming system - Improved farm productivity - Increased income Knowledge Creation Agricultural Research Institutions - Public (DAR, DOA, YAU) - Private (INGOs, NGOs) - Farmer organizations (Suitable cropping patterns, improved varieties) Government Support - Policy reforms - Infrastructures Ǧ
Knowledge Dissemination through Interpersonal, Group, and Mass Media - Climate/Weather information Ǧ - Access to agricultural inputs Ǧ Figure 3. Extension framework for improving adaptation strategies in rice- based farming systems Knowledge Utilization Ǧ Ǧ farming system