Social Networks and the Employability of Filipinos
in the United States
1Ruby ABSUELO and Peter HANCOCK
A b s t r a c t A b s t r a c tA b s t r a c t A b s t r a c t A b s t r a c t
This paper examines Filipino graduates’ social networks, educational attainment, degree field, English language proficiency, immigration status, age and gender—factors that influence and determine their employability in the U.S. labor market. While each of these factors does have an effect on employability, the paper argues that the use of Weak Ties was the strongest and most beneficial in improving employability, that is, in securing their first job in the United States after migration and in obtaining more advantageous employment opportunities. These include higher pay, a more secure job status, and a higher percentage working in occupations commensurate with their educational qualifications. The strength of Weak Ties in affecting employability was established through statistical analysis of demographical data collected from Filipino graduates.
Keywords: Foreign-born Graduates, Asian American, Philippine Immigrants, Filipino-American, Social Network, Weak Ties, Strong Ties
Introduction Introduction Introduction Introduction Introduction
IT IS SAID THAT FILIPINOS face limited economic opportunities, overwhelming underemployment, and low salaries and benefits, all of which are primary reasons why they migrate(d) to the United States, among other countries. Prior to migration to the U.S., most educated Filipinos worked in higher-level occupations (management) in professional, technical and/or related fields (Commission on Filipinos Overseas 2013). But even though they have a higher level of education, once they enter the U.S.
labor market, many are underemployed or work in fields unrelated to their education and experience.
After migrating to the U.S., a substantial percentage of Filipinos were demoted to entry-level positions (Almirol 1985), as is the case of Filipino accountants. Despite sufficient educational qualifications and experience, they end up in menial, low-paying clerical jobs (Valle 2005). The disparity between education and employment is particularly pronounced among Filipinos with bachelors or advanced degrees. Madamba’s (1998) findings indicate that almost 50 percent of Filipinos with advanced degrees and more than 35 percent with a bachelor’s degree acquired jobs below their educational qualifications. This was true of approximately 60 percent of Filipino graduates with a bachelor’s degree, 48 percent with an unfinished master’s degree, 23 percent with a master’s degree, and 27 percent with professional/doctoral degrees. Running parallel to this trend are the findings of Batalova (2006), Karas (2002), Painter (2010), and Sanders, Nee and Sernau (2002).
R RR
RResearesearesearesearesearch Gapch Gapch Gapch Gapch Gap
Many explanations on the disparity between educational qualifications and actual employment largely focus on educational attainment, degrees, inadequate English language skills, immigration status, age discrimination, gender issues, strict professional U.S. licensing requirements, and, less frequently, a lack of full recognition of their academic qualifications.
Indeed, previous research on labor market outcomes of foreign- born immigrants suggests that such factors affect employability. However, much of this research focuses on a single variable (e.g. English language proficiency); many studies fail to consider other intervening reasons that contribute to poor and unsuccessful employment among immigrants (i.e.
acquiring jobs incommensurate with their educational qualifications). But recent theoretical developments in social networking (Weak Ties versus Strong Ties) helped provide new insight into its important role in facilitating immigrants’ employability: that regardless of educational attainment, English proficiency, immigration status, and other factors, the use of Weak Ties is the strongest determinant of employability.
Social networks are not only beneficial for migrants’ entry to the U.S.2—they also play a crucial role in facilitating their integration into American society. Moreover, social networks help immigrants attain economic well-being during their initial settlement in the country. And for Filipinos, if not other immigrants, one critical element of this “well-being”
is their participation in the labor market.
The use of social networks is believed to be associated with employment mobility (Granovetter 1973, 1995) and economic success (Waldinger 2000). Similarly, Weak Ties Theory has been used as the conceptual basis of other studies that examine the connection of social networks to employment status, type of employment, and earnings. Other studies concentrate on establishing and measuring the effects of Weak Ties on wages (Bridges and Villemez 1986; Marsden and Hurlbert 1988;
Wegener 1991) and on employment prospects (see Brown and Konrad 2001; Granovetter 1973). Others like Bagchi (2001) examine the role of Weak Ties in the immigration process of professionals in the U.S.
Greenwell, Valdez and Da Vanzo (1997) investigate how social ties affect immigrants’ employment status and wages. In contrast, studies tackling the effect of weak ties on the employability of Filipino migrants in the United States are almost nonexistent.
Char Char Char
CharCharting the Emploting the Emploting the Emploting the Employting the Employyyyability of Filipinos in the United Statesability of Filipinos in the United Statesability of Filipinos in the United Statesability of Filipinos in the United Statesability of Filipinos in the United States This paper develops an overview of the employability3 in the U.S.
labor market of Filipinos who graduated from Philippine universities.4 It aims to (1) determine if there is a statistically significant relationship between the respondents’ employability and the following variables: a) educational attainment, b) degree field; c) English language proficiency;
d) immigration status; e) age; f) gender; and g) social networks. Each variable affects the employability of Filipino immigrants in different ways, creating (dis)parities between their educational qualifications and initial employment upon entry to the United States. Each variable also contributes to the improvement or stagnation of later employment prospects. However, while each variable does contribute to employability, the paper shows—through statistical analysis of demographical data collected from Filipino immigrants—how and why weak ties is the strongest and most beneficial factor in determining employment outcomes.
Theoretical Perspective: Social Networks and Weak Ties Theory
Weak Ties and Strong Ties are operationally defined by Granovetter (1973; 1983) and other sociologists. Weak ties are nonpersonal and nonfamilial relationships, i.e. acquaintances. Strong ties, on the other hand, involve relationships for which there are emotional bonds generally involving family or friends (Wasserman and Faust 1994).
Weak Ties and Strong Ties are part of the study of social networking, which has been a common and broad topic of discussion in various disciplines including economics, business, and sociology. On the subject of immigration alone, a plethora of studies on social networking exists—covering its pivotal role in the immigration process, assimilation of immigrants, the lives of the immigrants, their participation in the labor market, including its impact on job search, earnings, and employment and occupational outcomes. (Aguilera and Massey 2003; Amuedo-Dorantes and Mundra 2007; Greenwell, Valdez and Da Vanzo 1997; Livingston 2006; Pfeffer and Parra 2009; Sanders, Nee and Sernau 2002; Waldinger 1997).
In general, when pertaining to helping job seekers, proponents of Weak Ties Theory and Strong Ties Theory argue that their type of social network provides a better alternative and is more effective than the other.
For some, Weak Ties offers more novel or valuable information that is more likely to lead to employment than relying on close friends and family ties (Strong Ties). The case for Weak Ties was Granovetter’s (1973) argument in his seminal work in the early 1970s. He argued that “those to whom we are weakly tied are more likely to move in circles different from our own and will thus have access to information different from that which we receive”
(1371). Granovetter (1983) later discussed some of the empirical studies that tested his theory. Most of the findings mirrored his, suggesting that Weak Tie connections tend to be the best source for new jobs, though the trend differed by occupation (ibid.). But while other studies are not completely supportive of the Weak Ties theory, Granovetter (1983) indicated that the results of the studies clarified the advantages of Weak Ties. He concluded that “Weak Ties provided people with access to information and resources beyond those available in their own social circle” (209).
There was also a relationship between the use of Weak Ties in finding employment and having a higher occupational status (Lin, Ensel, and Vaughn 1981). Bridges and Villemez (1986) and Marsden and Hurlbert (1988) found a statistically significant relationship between the strength of Weak Ties and labor outcomes (e.g. earnings). However, after control variables were introduced, the results were not as significant, rendering the original relationship spurious. In contrast, later studies do affirm the advantage of Weak Ties in obtaining desirable jobs (Bagchi 2001; Brown and Konrad 2001). Williams and Durrance (2008) searched the ProQuest database for dissertations testing Granovetter’s theory. Their findings indicated that of the 60 dissertation abstracts, 45 percent confirmed/
supported the theory, 37 percent found that Strong and Weak Ties were equally influential, and 17 percent said Strong Ties were more effective than Weak Ties. Furthermore, in seeking information about employment in higher skilled jobs, job seekers are more likely to employ Weak Ties.
On the other, lower status or lower-skilled jobs more likely to have been obtained by Strong Ties.
Other Determinants of Employability
Before establishing the primacy of weak ties, it is still necessary to take a closer look at other factors that contribute to or influence immigrants’
employability, namely: educational attainment, degree field, English language proficiency, immigration status, age, and gender.
Education plays a vital role in preparation for entry in the labor market. Data from the U.S. Bureau of Labor Statistics (2014) consistently show favorable economic returns, as well as lower unemployment rates, among those with higher levels of educational attainment. Graduate and postgraduate degree holders are better positioned in the U.S. labor market than bachelor’s degree holders. The former have higher earnings and occupational status (Borjas 1987; Chiswick 1978; U.S. Bureau of Labor Statistics 2014). However, some immigrants do not fully succeed in the labor market solely because of their education. Chiswick and Miller (2009) and Friedberg (2000) indicate that education and previous employment history acquired abroad tend to be less valued than those obtained in the host country. The absence or lack of recognition of academic and educational credentials by some U.S. employers in some professions hinders immigrants’ access to employment. Batalova and Fix (2008) and Zeng and Xie (2004) suggest that this “devaluation” is one of the barriers immigrants face. Friedberg (2000) shows that immigrants from Asia and Africa are more likely to experience labor market disadvantage (e.g., lower earning) because their foreign education is less valued in the destination country.
Furthermore, certain degree fields are less valuable in the U.S.
economy, which puts some migrants at a further disadvantage (Painter 2010). However, for other Asian countries—particularly China, India, and the Philippines—this may not be entirely true. Most of the recipients of the H-1B Visa program have been from these nations (US Citizenship and Immigration Service 2012).5 For instance, many Filipino professionals have come to the U.S. after the passage of the Immigration and Nationality Act of 1965. This has been particularly true in the medical field when the
U.S. faced a shortage of medical professionals (Choy 2003). Accordingly, emigrating nursing professionals have dominated health-related professions. In demand, Filipino nurses succeeded in the U.S. labor market because their degrees, though acquired in the Philippines, were generally recognized by American employers. And most Filipinos whose expertise is in demand (e.g. nursing, education, and computer-related fields) are employed in the U.S. through pre-arranged, secured jobs; and they work in occupations commensurate with their educational attainment.
The success of some Filipino immigrants may not be similar in all labor markets. Although the Philippine education system is patterned after that of the U.S., professionals in certain industries have failed to experience the same opportunities as those in Nursing, Education, and Computer Science. Filipinos with degrees in Law, Medicine, Pharmacy, and Engineering face employment barriers (Alba and Nee 2003; Vallangca 1987) often due to professional licensing issues; rigorous state licensing requirements; and the lack of recognition of Filipinos’ education and work experiences. As a result, many Filipino professional immigrants do not practice their professions, are underemployed, or suffer employment delays.
For instance, Filipino Certified Public Accountants (CPAs) were demoted to entry-level positions at their initial employment, working as bookkeepers and accounting clerks even though they had considerable work experience prior to migration (Valle 2005). Others have resorted to acquiring lower- level or unskilled jobs (Alba and Nee 2003).
Another human capital investment that has determined the success of an immigrant’s participation in the labor market is the ability to communicate in English, particularly for those who wish to land a professional job (Cooney and Ortiz 1983; Kim 1999) or to secure an occupation comparable to what they held prior to immigration. In the mainstream labor market, greater fluency and accent-free English has been a requirement for the majority of the higher (managerial) positions (Portes and Rumbaut 2006). Das (2010) revealed the positive significant effect of education and English proficiency on the outcomes of female immigrants’
occupational attainment. At the same time, immigrants who graduated from foreign colleges and universities but whose English proficiency is limited may not be considered qualified for certain positions. This is the case even though their education and experience make them overqualified (De Jong and Madamba 2001). Batalova and Fix (2008) show that highly skilled immigrants with inadequate English proficiency have been twice as likely to be significantly underemployed.
English proficiency not only affects employability but also earning potential, providing immigrants with higher wages in the U.S. (Chiswick 2005; Chiswick and Miller 2002; Chiswick and Taengnoi 2007; Stone et al. 2006) and in other countries (Dustmann and Fabbri 2003; Posel and Casale 2011; Shields and Price 2002). These results have confirmed that language skills complement other acquired human capital (e.g.
educational attainment, experience, etc.).
In terms of gender, studies show patterns of female disadvantage in the labor market. They earn less and occupy positions lower than their male counterparts (US Government Accountability Office 2011). In Batalova’s (2006) study on skilled immigrants and U.S.-born workers in the United States, she found out that skilled female workers, whether US- born or foreign-born, earned less than their male counterparts regardless of equal investment in human capital (e.g. education) and demographic profile (e.g. age, race). There are ironies to this gender pay gap, which continues to be one of the major inequalities women face in the labor market (Padavic and Reskin 2002). More Filipino women completed their bachelor’s degree than their male counterparts (36 percent compared to 13 percent) (Allard 2011). Furthermore, more Filipino female immigrants are more likely to retain their professional status in the U.S. than their male counterparts. This transferability of credentials especially holds true in the case of registered nurses. Because of their profession, they can migrate more easily to and find the same job (nursing). This indicates that females are not fundamentally disadvantaged because their education is accepted in their chosen career fields (e.g. nurses). However, these facts do
not determine whether Filipino women immigrants as a whole fare better than Filipino males.
In terms of labor market outcomes, it appears that immigrants who enter the U.S. via employment-based programs have a greater advantage, at least initially, than those admitted through family-based programs. Filipinos admitted via the latter perform tasks for which they were educationally trained, thus retaining the professional status they held prior to migration. However, because of the concern over the influx of immigrants from the so called “Third World,” as well as employment competition between those who are foreign-born and U.S.-born, the U.S.
Congress passed several laws deterring the emigration of certain occupational groups who were negatively affecting employment opportunities of US-born Americans. The first was the Health Professions Educational Assistance Act of 1972, which limited foreign medical graduates from entering the U.S. and practicing in the field. The legislation naturally decreased the number of foreign medical doctors immigrating to the U.S. Therefore, medical doctors and other health professionals who did not qualify for employment-based admittance turned to family ties and used family-based policies to immigrate.
However, upon entry to the U.S., the rigorous licensing requirements (such as that of the National Board of Medical Examiners) impacted the immigrants and hindered medical doctors from practicing their specializations. This situation has also been true for Filipinos and all immigrants. Thus, many were left with limited options, one of which was to seek various low-income jobs that were not in line with their educational attainment (Alba and Nee 2003).
Data and Methodology Data and MethodologyData and Methodology Data and Methodology Data and Methodology6
The research was conducted from March 2011 to February 2012.
There were a total of 325 respondents who constituted the sample size, 305 of whom participated in the survey and 20 in the interview component.
The primary criteria for the selection of the participants were as follows:
(1) Respondents must be Filipino-born immigrants and must have obtained their baccalaureate degree in the Philippines; (2) Respondents must either be permanent, or temporary U.S. residents, or naturalized U.S. citizens;7 (3) Respondents must have worked, are currently working, or are searching for employment. Respondents may have attended and attained degrees from colleges and universities in the U.S. in addition to the undergraduate degree they obtained in the Philippines.
The study comprised two sets of respondents. One group participated in the survey and the other group took part in the interview component. A snowball sampling technique was employed to select the participants.8 Web-based and paper based survey methods were used to administer the survey. The initial sampling was done by selecting 500 respondents (400 via webmail, 100 via traditional mail) prior to the use of the snowball sampling technique. However, only 305 constituted the sample size. The 20 interview participants were chosen using the purposive sampling technique. The interviews were conducted through synchronous (Yahoo instant messaging) and asynchronous (e-mail) computer communications, and face-to-face and telephone interviews.
The following data about the immigrants when they first arrived in the United States were collected: social networks used, immigration status,9 educational attainment, degree field, English proficiency, age, and gender.
All these factors determine employability, which was measured according to three indicators: salary on first job, employment status (professional or nonprofessional), and length of time in finding employability.10 Employability was also analyzed in terms of differences in salary and employment status between their first job and current occupation.
All the factors affecting employability were treated as independent variables, or predictor variables. The social network was categorized as Strong Ties, Weak Ties, or No Ties. Respondents were asked whether they received assistance in obtaining their initial employment (first job). Those who obtained help had to identify the source of such assistance (i.e. Strong Ties, Weak Ties). Immigration status was either immigrant or nonimmigrant.11 Immigrants enter the United States to reside permanently, while nonimmigrants reside in the county on a temporary basis; these include those on temporary work, business, study, or tourism. However, as it was noted, only individuals with work authorization visas were included in the study. Other predictor variables such as immigration status, educational attainment, degree field, English proficiency, age, and gender were treated as categorical.12 A mixed methods design was employed to provide a more comprehensive analysis and understanding of the subject matter.
Many factors affect employability, and thus at first glance, it is difficult to isolate, let alone establish, the primacy of Weak Ties in enhancing employment prospects. To do this, standard but complex statistical procedures were all conducted to determine why Weak Ties is the strongest determinant of employability.
Basic and complex quantitative data analyses were treated in-depth using the Statistical Package for Social Sciences (SPSS), version 21. One- way Analysis of Variance (ANOVA), t test, and two-way ANOVA between subjects were performed. The one-way ANOVA and t test are essentially the same. The t-test was performed to measure the difference between the mean scores of two groups (e.g. Gender – Male, Female). On the other hand, the one-way ANOVA test measure the difference between the mean scores of more than two groups (e.g. Education: Bachelor, Master, Professional/Doctoral). This determined whether the groups differ. However, it does not provide where the significant difference lies.
Thus, post hoc multiple comparison tests, Bonferroni and Tukey tests were used to identify where the groups significantly diverged. Bonferroni was performed for groups of fewer than four and the Tukey was performed for groups over four.
A two-way ANOVA between subjects tested the impact of two independent variables (factors affecting employability) on the dependent variable (employability). The variables contrasted with employability were examined in terms of their capability to moderate the relationship between employability and the type of social network. Moderation occurs when the relationship between social network and employability depends on a third independent variable, also known as the moderator variable (e.g.
degree field, English language proficiency). The effect of the third variable is characterized as an interaction effect, which means that the effect of an independent variable is influenced by another independent variable. The hypotheses were stated in the null form.13 All statistical tests were performed at the standard 0.05 level of significance (a = 0.05).14 An alpha level of 0.05 was assumed to provide an acceptable level of type l error rate.15Any value less than .05 will result in significant effects and any value greater than .05 will result in nonsignificant effects.
The qualitative data were collected through interviews, and were initially analyzed using the a priori coding method. Seven a priori codes were developed for the initial analysis: (1) Social networks; (2) educational attainment; (3) degree field; (4) English proficiency; (5) immigration status;
(6) age; and (7) gender. A systematic grounded theory data analysis technique was used (Strauss and Corbin 1998; Charmaz 2006) to emphasize the use of data analysis steps of open coding, axial coding, and selective coding.16 It must be said, at any rate, that there are limitations to the quantitative and qualitative methods.
Pr PrPr
PrProfofofof ile of Philippine Grofile of Philippine Grile of Philippine Grile of Philippine Grile of Philippine Graduates Upon Arrivaduates Upon Arrivaduates Upon Arrivaduates Upon Arrivaduates Upon Arrivalalalalal to the United States
to the United States to the United States to the United States to the United States
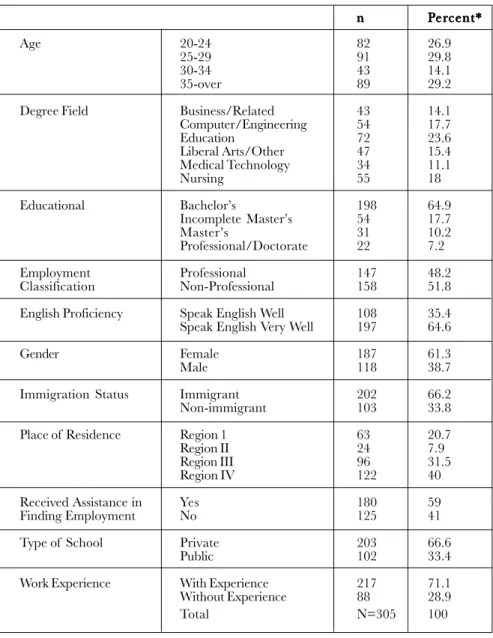
Table one provides a snapshot of the demographic characteristics of respondents upon their first arrival in the United States: age, field, educational attainment, employment classification, English proficiency, gender, immigration status, place of residence, receipt of assistance in finding employment, type of school, and work experience.
Age
Most respondents were in their early to late twenties, which may suggest that younger Filipinos tend to migrate from their homeland in greater numbers than older Filipinos. But they were second only to those aged 35 and over.
Gender
Majority of our respondents (61.3 percent) were females. More than half were in the 20–24 and 25–29 age range categories.
Degree
Majority of respondents held a bachelor’s degree in Education, and most graduated from a private college or university.
Educational Attainment
Less than half of the respondents have advanced degrees. But most have at least a bachelor’s degree.
Work Experience
A vast majority of respondents had work experience or had worked in their chosen fields prior to immigration.
English proficiency
More than half of the respondents self-assessed their English speaking capacities as “very well.”
Employment Classification17
More than half of the respondents (51.8 percent) initially acquired low-level, unskilled jobs while 48.2 percent obtained occupations commensurate with their educational qualifications.
TABLE 1: Demographic Characteristics of Philippine Graduates Upon Entry to the US n
nn
nn PPPPPererererercent*cent*cent*cent*cent*
Age 20-24 82 26.9
25-29 91 29.8
30-34 43 14.1
35-over 89 29.2
Degree Field Business/Related 43 14.1
Computer/Engineering 54 17.7
Education 72 23.6
Liberal Arts/Other 47 15.4
Medical Technology 34 11.1
Nursing 55 18
Educational Bachelor’s 198 64.9
Incomplete Master’s 54 17.7
Master’s 31 10.2
Professional/Doctorate 22 7.2
Employment Professional 147 48.2
Classification Non-Professional 158 51.8
English Proficiency Speak English Well 108 35.4
Speak English Very Well 197 64.6
Gender Female 187 61.3
Male 118 38.7
Immigration Status Immigrant 202 66.2
Non-immigrant 103 33.8
Place of Residence Region 1 63 20.7
Region II 24 7.9
Region III 96 31.5
Region IV 122 40
Received Assistance in Yes 180 59
Finding Employment No 125 41
Type of School Private 203 66.6
Public 102 33.4
Work Experience With Experience 217 71.1
Without Experience 88 28.9
Total N=305 100
* Total percentage per category.
Immigration status
More than two-thirds of the respondents entered the United States with an immigrant status (Green Card holders).
Assistance in Finding Employment
Table 1 shows that more than half of the respondents received assistance from relatives, friends, employment agencies, organizations, or professional affiliations (social networks) while searching for their initial employment.
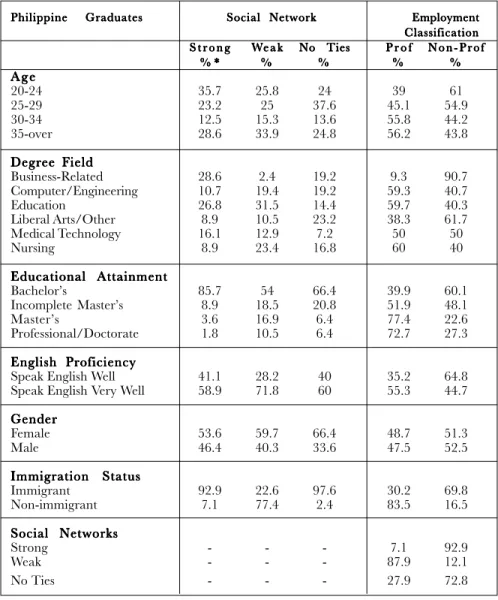
Table 2 indicates that the respondents’ use of the types of social networks at their initial employment varied depending on their gender, age, educational attainment, degree field, English proficiency, and immigration status. It also illustrates the relationship of these variables with their employment status (professional or nonprofessional).
In terms of age, respondents in the “35 years and over” age category were more reliant on Weak Ties than respondents aged 20–24, who counted more on Strong Ties. It also shows that master’s and professional or doctorate degree holders had the highest percentage among professionals. Majority (90.7 percent) of respondents with business-related degrees were employed in nonprofessional positions. Fewer than 9 percent worked in professional occupations.
Respondents with Bachelor of Science degrees in Nursing, Education and Computer/Engineering composed more than half of those employed in professional positions, about 60 percent, 59.7 percent and 59.3 percent, respectively.
Females relied more on both Weak Ties and Strong Ties than their male counterparts. Bachelor’s degree holders relied more on Strong Ties than those with advanced degrees. Business-related degree holders also counted on Strong Ties more.
Table 2 shows that respondents who utilized their social networks in securing their initial employment also varied. More than 87 percent of
TABLE 2: Use of Social Networks Vis-a-Vis Determinants of Employability and Employment Classification at Initial Employment
Note: Data in the left column (Social Network) should be read row to row. On the right side, read column to column (Employment Classification).
Philippine Graduates Philippine Graduates Philippine Graduates Philippine Graduates
Philippine Graduates Social Network Social Network Social Network Social Network Social Network Employment Employment Employment Employment Employment Classification Classification Classification Classification Classification S t r o n g
S t r o n gS t r o n g
S t r o n gS t r o n g WWWWWe a ke a ke a ke a ke a k No TiesNo TiesNo TiesNo TiesNo Ties P r o fP r o fP r o fP r o fP r o f N o n - P r o fN o n - P r o fN o n - P r o fN o n - P r o fN o n - P r o f
% *
% *% *
% *
% * %%%%% %%%%% %%%%% %%%%% A g e
A g eA g e A g eA g e
20-24 35.7 25.8 24 39 61
25-29 23.2 25 37.6 45.1 54.9
30-34 12.5 15.3 13.6 55.8 44.2
35-over 28.6 33.9 24.8 56.2 43.8
Degree Field Degree FieldDegree Field Degree FieldDegree Field
Business-Related 28.6 2.4 19.2 9.3 90.7
Computer/Engineering 10.7 19.4 19.2 59.3 40.7
Education 26.8 31.5 14.4 59.7 40.3
Liberal Arts/Other 8.9 10.5 23.2 38.3 61.7
Medical Technology 16.1 12.9 7.2 50 50
Nursing 8.9 23.4 16.8 60 40
Educational Attainment Educational AttainmentEducational Attainment Educational AttainmentEducational Attainment
Bachelor’s 85.7 54 66.4 39.9 60.1
Incomplete Master’s 8.9 18.5 20.8 51.9 48.1
Master’s 3.6 16.9 6.4 77.4 22.6
Professional/Doctorate 1.8 10.5 6.4 72.7 27.3
English Proficiency English ProficiencyEnglish Proficiency English ProficiencyEnglish Proficiency
Speak English Well 41.1 28.2 40 35.2 64.8
Speak English Very Well 58.9 71.8 60 55.3 44.7
Gender GenderGender GenderGender
Female 53.6 59.7 66.4 48.7 51.3
Male 46.4 40.3 33.6 47.5 52.5
Immigration Status Immigration StatusImmigration Status Immigration StatusImmigration Status
Immigrant 92.9 22.6 97.6 30.2 69.8
Non-immigrant 7.1 77.4 2.4 83.5 16.5
Social Networks Social NetworksSocial Networks Social NetworksSocial Networks
Strong - - - 7.1 92.9
Weak - - - 87.9 12.1
No Ties - - - 27.9 72.8
*Total percentage per category
respondents who utilized Weak Ties secured professional jobs, while only 12.1 percent obtained nonprofessional jobs. Those who relied on Weak Ties also earned more than those who used Strong Ties.
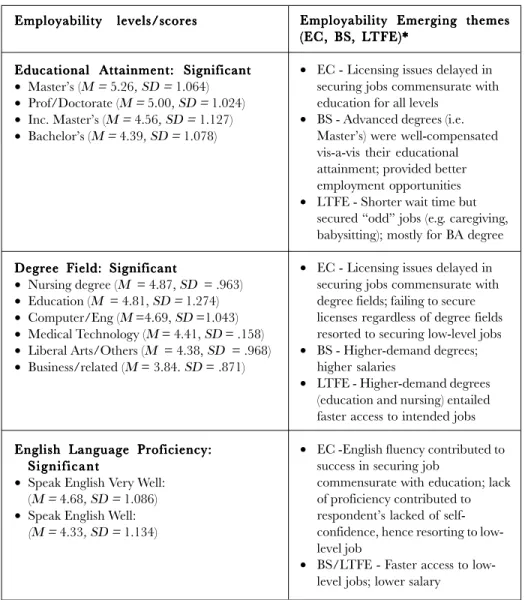
The left column of Table 3 shows the employability scores of the respondents vis-a-vis several determinants of employability, which in turn is measured by the differences in the duration of time in finding their initial employment (LTFE, length of time finding employment);
employment classification (EC, professional or nonprofessional); and beginning salary (BS, salary received at their first job).
Table 3 indicates the employability score of a nurse, educator, a person who uses a particular type of social network, a male, a female, and so on. To compute for the employability/level or score, we collected the following data:
(1) length of time finding employment/wait time (LTFE); (2) beginning salary (BS);18 and (3) employment classification (EC). In order to have a more precise measurement of employability, the three indicators were combined to form a composite index for employability during initial employment.19 The employability level/score at initial employment and the outcome or the result was designated as the dependent variable.
As shown in Table 3, those who have a masters degree, nursing degree, are very proficient in English language, hold non-immigrant/non- green card holders, and most importantly those who utilized weak ties social networking, received the highest employability levels/scores (M = 5.26, M = 4.87, M = 4.68, M = 5.41, and M = 5.39, respectively).
The right column features the trends that respondents revealed in the interviews, where they explained the reasons of their employability (or the lack thereof) and their experiences. The interview narratives in the qualitative component provided insight into the employability of respondents.
This matrix also displayed and allowed for the examination of the congruency of results to achieve a broader understanding of Filipino graduates’ employability. All data sets corroborated each other. As noted, the hypotheses were stated in the null form, i.e. employability is not associated with the following factors: educational attainment, degree field, English
TABLE 3: Employability Scores Vis-a-vis Various Determinants Thereof At Initial Employment
Employability levels/scores Employability levels/scores Employability levels/scores Employability levels/scores Employability levels/scores
Educational Attainment: Significant Educational Attainment: Significant Educational Attainment: Significant Educational Attainment: Significant Educational Attainment: Significant
• Master’s (M = 5.26, SD = 1.064)
• Prof/Doctorate (M = 5.00, SD = 1.024)
• Inc. Master’s (M = 4.56, SD = 1.127)
• Bachelor’s (M = 4.39, SD = 1.078)
Degree Field: Significant Degree Field: Significant Degree Field: Significant Degree Field: Significant Degree Field: Significant
• Nursing degree (M = 4.87, SD = .963)
• Education (M = 4.81, SD = 1.274)
• Computer/Eng (M =4.69, SD =1.043)
• Medical Technology (M = 4.41, SD = .158)
• Liberal Arts/Others (M = 4.38, SD = .968)
• Business/related (M = 3.84. SD = .871)
English Language Proficiency:
English Language Proficiency:
English Language Proficiency:
English Language Proficiency:
English Language Proficiency:
S i g n i f i c a n t S i g n i f i c a n tS i g n i f i c a n t S i g n i f i c a n tS i g n i f i c a n t
• Speak English Very Well:
(M = 4.68, SD = 1.086)
• Speak English Well:
(M = 4.33, SD = 1.134)
Employability Emerging themes Employability Emerging themesEmployability Emerging themes Employability Emerging themes Employability Emerging themes (EC
(EC(EC
(EC(EC,,,,, BS BS BS BS BS,,,,, L L L LTFE)* LTFE)*TFE)*TFE)*TFE)*
• EC - Licensing issues delayed in securing jobs commensurate with education for all levels
• BS - Advanced degrees (i.e.
Master’s) were well-compensated vis-a-vis their educational attainment; provided better employment opportunities
• LTFE - Shorter wait time but secured “odd” jobs (e.g. caregiving, babysitting); mostly for BA degree
• EC - Licensing issues delayed in securing jobs commensurate with degree fields; failing to secure licenses regardless of degree fields resorted to securing low-level jobs
• BS - Higher-demand degrees;
higher salaries
• LTFE - Higher-demand degrees (education and nursing) entailed faster access to intended jobs
• EC -English fluency contributed to success in securing job
commensurate with education; lack of proficiency contributed to respondent’s lacked of self- confidence, hence resorting to low- level job
• BS/LTFE - Faster access to low- level jobs; lower salary
*EC-Employment Classification; BS –Beginning Salary; LTFE-Length of Time Finding Employment
*EC-Employment Classification; BS –Beginning Salary; LTFE-Length of Time Finding Employment
• EC - Immigrant holders experience delayed in their employment process due to licensing/
certification requirements; resorted to securing low-level jobs while complying with the requirements
• BS/LTFE - Faster access to low- level jobs; lower salary
• EC/BS/LTFE - Respondents secured job regardless of age;
stressed “Knowledge-based” and
“meeting job requirements”
indicated U.S.-enforced “equal employment opportunity”
• EC/BS/LTFE - Respondents secured jobs regardless of gender;
“Knowledge-based” qualification rather than gender was more important; compensation was based on established rates but increased for respondents with advanced degrees
• EC/BS - Weak Ties secured professional jobs; Strong Ties secured lower level occupational status
• BS – WT earned higher salary comparable with the US-born Americans (advantage)
• LTFE - ST faster access to job but beneath education qualifications (disadvantage);
• No Ties/Individual – self-reliance on securing jobs
Immigration Status: Significant Immigration Status: SignificantImmigration Status: Significant Immigration Status: Significant Immigration Status: Significant
• Immigrant:
(M = 5.41, SD = .933)
• Non-immigrant:
(M = 4.11, SD = .931)
Age: Not Significant Age: Not SignificantAge: Not Significant Age: Not SignificantAge: Not Significant
• 20-24 (M = 4.40, SD = 1.076)
• 25-29 (M = 4.47, SD = .993)
• 30-34 (M = 4.74, SD = 1.115)
• 35-over (M = 4.67, SD = 1.250)
Gender: Not Significant Gender: Not SignificantGender: Not Significant Gender: Not Significant Gender: Not Significant
• Female (M = 4.53, SD = 1.113)
• Male (M = 4.58, SD = 1.120)
Social Network: Significant Social Network: SignificantSocial Network: Significant Social Network: SignificantSocial Network: Significant
• Weak Ties-(M = 5.39, SD = .824)
• No Ties/Individual (M =4.08, SD =.947)
• Strong Ties (M = 3.75, SD = .769) Employability levels/scores Employability levels/scores Employability levels/scores Employability levels/scores
Employability levels/scores Employability Emerging themesEmployability Emerging themesEmployability Emerging themesEmployability Emerging themesEmployability Emerging themes (EC
(EC(EC
(EC(EC,,,,, BS BS BS BS BS,,,,, L L L L LTFE)*TFE)*TFE)*TFE)*TFE)*
language proficiency, immigration status, age, and gender. The results rejected the null hypotheses exclusive of age and gender in relation to employability;
suggesting that age and gender do not have bearing upon employability.
However, educational attainment, degree field, English language, and immigration status were significantly associated with employability.
Statistical Analy Statistical Analy Statistical Analy Statistical Analy
Statistical Analysis of Emplosis of Emplosis of Emplosis of Emplosis of Employyyyyabilityabilityabilityabilityability and V
and V and V and V
and Various Farious Farious Farious Factors Therarious Factors Theractors Theractors Theractors Thereofeofeofeofeof
In the Analysis of Variance (ANOVA) test, the F-statistic determines if the variances between the means of two populations are significantly different. However, the importance of the interpretation for the significant effects lies in the p values (or significant value) which will determine the significance of the results. As indicated previously, all statistical tests were performed at the standard .05 level of significance (a = .05). Any value greater than .05 will result in nonsignificant effects.
Educational Attainment
A significant relationship of F (3, 301) = 7.15, p = .001 existed between respondents’ educational attainment and employability. While the respondents secured jobs at their initial employment, their level of employability varied across groups, suggesting that those with master’s degrees received the greatest advantage from their education. Respondents with a bachelor’s degree obtained the lowest employability score. The common themes in the interview narratives indicated that the lower employability score for the respondents—especially for bachelor’s degree holders—resulted from accepting unskilled jobs because of urgent income needs for themselves and their family.
Degree Field
Results revealed a significant relationship of F (5, 299) = 6.15, p = .001 between degree field and employability, suggesting that the levels of employability among the respondents varied across degrees. Respondents
with nursing degrees were found to be the most employable. Conversely, business-related degree holders were the least employable (M =3.84, SD
=.871). The common themes in the interview narratives indicated that the licensing or certification process for their professions was the most prevailing, time-consuming, negative barrier to employment. Stringent licensing requirements hindered respondents from securing initial professional jobs in a timely manner. For example, Respondent 5 stated that
“I tried looking for a job as a foreign graduate with no local experience;
no employer would hire me because of lack of local experience. Way back [in] 1976 as a foreign graduate [with] no local training, you can’t work as a laboratory technician or technologist. First, you must pass the (omitted) state licensing examination, if not you can’t practice your profession. As a beginner, it feels like there’s no “room” for you to start, even as a phlebotomist or lab asst.[laboratory assistant].”
Respondents in other professions that require certifications/licenses faced the same barrier in entering their intended occupation; their access to employment was delayed; even getting a job interview was a challenge.
English Language
An independent sample t test was conducted to compare employability scores vis-a-vis English language proficiency. The results revealed that there was a statistically significant difference in levels/scores for the categories,
“Speak English Well” (M=4.32, SD =1.13) and “Speak English Very Well”
(M=4.68, SD=1.08; t (303) = -2.65, p = .008, two-tailed). The qualitative findings provided pertinent information to support the findings in the quantitative study. Nineteen out of the 20 interviewees emphasized the importance of English proficiency and the role it played in the employment process. Findings further indicated that those comfortable with their verbal communication skills were better prepared to participate and compete in the U.S. labor market. In contrast, the lack of English proficiency contributed to the respondents’ inability to secure employment in line with their profession and affected the respondents’ self-confidence.
Immigration Status
There was a statistically significant difference in employability scores for respondents with immigrant status/Green Card holder (M=4.11, SD=.93) and non-immigrant/non-Green Card holder (M= 5.41, SD=.933; t (303) = -11.46, p = .001, two-tailed). Nonimmigrants had higher employability scores than respondents with immigrant status. These results also demonstrated that nonimmigrants were at an advantage because of faster access to their intended occupation, higher beginning salary, and a job that meets their educational qualifications. Based on the themes emerging from the interviews, respondents indicated that their immigration status played a role in finding employment, particularly in jobs commensurate with their education. The demand for nurses in the U.S. in the 1960s, 1970s, and 1980s provided opportunities for respondents to come to the U.S. using the H-1B Visa, while others came under the Exchange Visitor Nurse Program (EVP). The shortage of teachers and demand for computer technology degrees also provided respondents with better labor outcomes.
Age
Results revealed that the relationship of F (3, 301) = 1.43, p = .23 between age and respondents’ employability was not significant. In the qualitative component of the study, respondents who currently worked or had worked specified that their ages varied (21 to 49 years old) when they secured their initial employment in the U.S. None of the respondents reported experiencing age as a disadvantage in securing jobs. Respondents mentioned that employment success was “knowledge-based” and about
“meeting job requirements,” as opposed to age in securing jobs.
Gender
Results revealed that there was no significant difference in scores for females (M=4.53, SD= 1.113) and males (M= 4.58, SD= 1.120; t (303)
= -.32, p = .75, two-tailed). Males and females approximately had the
same employability scores. Respondents in the qualitative component said that skills required for the job mattered more than their gender. They emphasized “knowledge-based” qualifications rather than gender differences in securing employment.
Social Networks
Results revealed a statistically significant difference of F (2, 302) = 99.9, p = .001 between groups. An overview of the distribution of data is presented in Figure 1. These results suggest that there was a significant difference in terms of respondents’ employability and the type of
FIGURE 1
Social Network–Distribution of Data
Note: Outliers in the data were retained in the analysis. All trimmed mean and mean values were similar.
connection they used in finding their initial job and that higher levels/
scores of employability depend on the kind of social network they utilized.
In this case, a Weak Ties approach was beneficial. Respondents utilizing Strong Ties were at a disadvantage as they received the lowest employability scores. Interview narratives indicated that Strong Ties networks provided jobs that were easy to find but were not commensurate with their educational attainment. Respondents who reportedly acquired employment through the use of friends and relatives (Strong Ties) were mostly in caregiving, babysitting and lower-level job positions. One example, Respondent 17 stated that
“I could not teach right away, I don’t have a license. My friend assisted me in finding my [first] employment. I didn’t spend a lot of time finding a job. I was able to get a job as a store bagger.”
While respondents pointed to the importance of social networking, they emphasized social networking, especially having the “right connection.” Respondents who utilized a more formal, Weak Ties method—which respondents referred to as the “right connection”—
secured professional jobs as engineers, teachers, and registered nurses.
They indicated they acquired jobs similar to what they held prior to immigration and received earnings comparable to those of American workers.
Determinants of Emplo Determinants of Emplo Determinants of Emplo Determinants of Emplo
Determinants of Employyyyyability and Imprability and Imprability and Imprability and Imprability and Improoooovvvvvementementementementement of Emplo
of Emploof Emplo of Emplo
of Employment Pryment Pryment Pryment Pryment Prospects: Currospects: Currospects: Currospects: Currospects: Current Prent Prent Prent Prent Profofofofof ileileileileile
So far, each variable (exclusive of age and gender) has been linked to employability. This was, just to reiterate, measured by three factors:
length of time in finding employment, employment classification, and beginning salary. The study then collected current employment data: salary and employment classification in order to determine the relationship of the determinants with current employment status.
It should be noted that majority (65.6 percent) of the respondents acquired U.S. citizenship, 22.6 percent held immigrant status, and 11.8 percent had nonimmigrant status. Their average length of residence was 17 years.
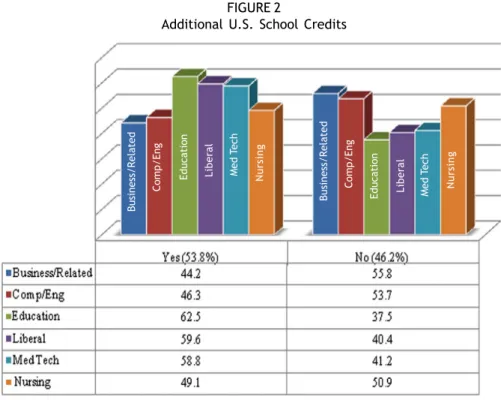
More than half (53.8 percent) of the respondents reported that they enrolled and received additional school/educational credits or complied with licensing/certification requirements from the U.S. in order to be employed in their respective career fields. However, 46.2 percent did not. The number of immigrants who took additional credits or furthered their education to comply with the U.S. standards were education degree holders (Figure 2).
Figure 3 illustrates that the number of respondents who had earned their master’s degree since they arrived in the United States were in
FIGURE 2
Additional U.S. School Credits
Business/Related Comp/Eng Comp/Eng
Business/Related
Education Education
Liberal Liberal
Med Tech Med Tech
Nursing Nursing
education. On the other hand, holders of liberal arts or other degrees had the highest proportions among those who are completing or have completed their professional/doctorate degrees.
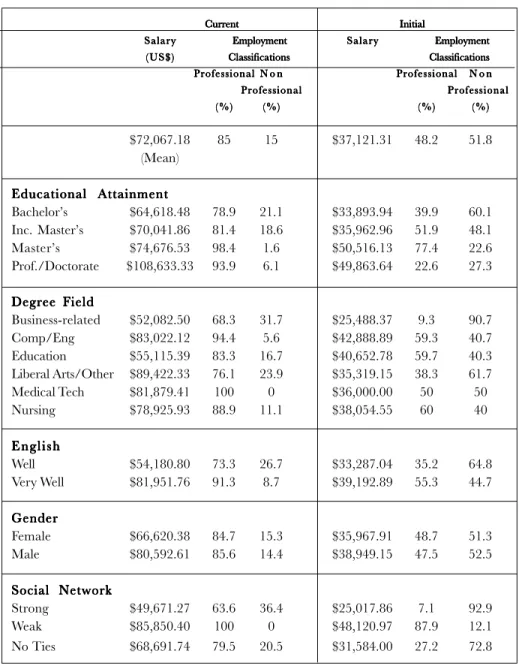
There were overall substantial improvements in levels of education, job/employment classification and annual salary (Table 4). The average beginning salary was US$37,000.20 Gender differences at the beginning salary were noticeable, with females earning less than what their male counterparts did. Males and females approximately showed the same percentages in acquiring professional and nonprofessional jobs in their initial and current employment. Beginning salaries also varied depending on respondents’
educational attainment and degree fields. Respondents with a bachelor’s degree earned less than those with a master’s degree (approximately difference
FIGURE 3
Degree Field and Education Level at the Time of the Study
Business/Related Comp/Eng Comp/Eng
Business/Related Comp/Eng
Education Liberal Education
Med Tech Med Tech Med Tech
Med Tech
Nursing Business/RelatedBusiness/Related Comp/Eng
Nursing Nursing
Education Liberal
Education Nursing
Liberal
Liberal
TABLE 4: Comparative Employment Status: Salary and Employment Classification
CurrentCurrentCurrentCurrentCurrent Initial InitialInitialInitialInitial Salary
Salary Salary Salary
Salary EmploymentEmploymentEmploymentEmploymentEmployment SalarySalarySalarySalarySalary EmploymentEmploymentEmploymentEmploymentEmployment ( U S $ )
( U S $ )( U S $ ) ( U S $ )
( U S $ ) Classifications ClassificationsClassificationsClassificationsClassifications ClassificationsClassificationsClassificationsClassificationsClassifications Professional
Professional Professional Professional
Professional N o nN o nN o nN o nN o n ProfessionalProfessionalProfessionalProfessionalProfessional N o nN o nN o nN o nN o n Professional
ProfessionalProfessional Professional
Professional ProfessionalProfessionalProfessionalProfessionalProfessional ( % )
( % ) ( % ) ( % )
( % ) ( % )( % )( % )( % )( % ) ( % )( % )( % )( % )( % ) ( % )( % )( % )( % )( % )
$72,067.18 85 15 $37,121.31 48.2 51.8
(Mean) Educational Attainment Educational Attainment Educational Attainment Educational Attainment Educational Attainment
Bachelor’s $64,618.48 78.9 21.1 $33,893.94 39.9 60.1
Inc. Master’s $70,041.86 81.4 18.6 $35,962.96 51.9 48.1
Master’s $74,676.53 98.4 1.6 $50,516.13 77.4 22.6
Prof./Doctorate $108,633.33 93.9 6.1 $49,863.64 22.6 27.3 Degree Field
Degree Field Degree Field Degree Field Degree Field
Business-related $52,082.50 68.3 31.7 $25,488.37 9.3 90.7
Comp/Eng $83,022.12 94.4 5.6 $42,888.89 59.3 40.7
Education $55,115.39 83.3 16.7 $40,652.78 59.7 40.3
Liberal Arts/Other $89,422.33 76.1 23.9 $35,319.15 38.3 61.7
Medical Tech $81,879.41 100 0 $36,000.00 50 50
Nursing $78,925.93 88.9 11.1 $38,054.55 60 40
E n g l i s h E n g l i s h E n g l i s h E n g l i s h E n g l i s h
Well $54,180.80 73.3 26.7 $33,287.04 35.2 64.8
Very Well $81,951.76 91.3 8.7 $39,192.89 55.3 44.7
Gender Gender Gender Gender Gender
Female $66,620.38 84.7 15.3 $35,967.91 48.7 51.3
Male $80,592.61 85.6 14.4 $38,949.15 47.5 52.5
Social Network Social Network Social Network Social Network Social Network
Strong $49,671.27 63.6 36.4 $25,017.86 7.1 92.9
Weak $85,850.40 100 0 $48,120.97 87.9 12.1
No Ties $68,691.74 79.5 20.5 $31,584.00 27.2 72.8
Source: 2011-2012 survey
of US$17,000). Respondents with business/related degrees pulled down the lowest average annual salary, while respondents with computer and engineering degrees earned the highest incomes.
In contrast, the average annual salary at the time of study was approximately US$72,000, much higher than the US$37,000 they received at their initial employment. This increase can be attributed to, among other things, the fact that those who obtained advanced degrees reaped the benefits of their human capital investment (i.e., taking additional U.S. school/educational credits). Respondents with professional/doctorate degrees received the highest earnings, but it must be noted that there are substantial differences between the earnings and occupational status of those who have advanced degrees. It is clear, however, that those who invested in education benefited from it. The annual earnings of respondents differed across the field as well. Liberal arts/other degree category earned the highest annual salary while business-related degree fields had the lowest.
There has been great improvement in occupational status as well.
Table 4 shows that more than half of the respondents initially acquired low-level, nonprofessional jobs, but at the time of the study, only a fraction of respondents remained in that category. Eighty-five percent of respondents, for example, now occupied jobs in line with their career professions. Only a small fraction (15 percent) of respondents remained employed in nonprofessional jobs that were incommensurate with their educational qualifications. One of our respondents, Respondent 18 shared that
“I agree that in the U.S., many Filipinos who graduated from the Philippines are employed in jobs below their educational qualification
—especially with their initial employments. However, I also believe that a great number of Filipino professionals will advance their academic and professional qualifications by pursuing advanced degrees, obtaining licensure and going through on the job training that will put themselves at par or better than their American counterparts.”
Despite the overall improvement, note that the degree fields that earned higher annual salaries at their initial employment were unable to maintain that advantage. For instance, an education degree holder at initial employment received the second highest salary, but received only the fifth largest compensation at the time of the research. Furthermore, amidst the advancement of employability, males earned more than their female counterparts (US$81,000 compared to US$67,000).
Other factors reveal their consistency in improving employability.
Those who reported having greater English proficiency at their initial employment maintained an advantage both in earnings and employment classification. Thus, Filipino graduates who utilized Weak Ties at their initial employment continued to have the advantage in terms of higher earnings and acquisition of professional jobs.
In terms of their current (at the time of the research) occupational category, Table 4 shows that more respondents eventually acquired professional jobs related to their educational attainment. Of the respondents working in their degree fields, 71 percent indicated they acquired employment in their field, and 13.7 percent worked as professionals outside their field. Only a small fraction (15 percent) worked in a position that does not match their expertise and remained in lower- level job classifications. Respondents with a degree in Medical Technology (Figure 4) acquired the highest number of professional jobs. On the other hand, business-related degree fields lagged behind other degree fields. It had the lowest number of respondents working in their respective fields.
Wh Wh Wh
WhWhy Wy Wy Wy Wy Weak Ties is the best and streak Ties is the best and streak Ties is the best and streak Ties is the best and streak Ties is the best and strongest indicatorongest indicatorongest indicatorongest indicatorongest indicator
It is clear from the preceding discussion, statistical analyses, and discussions that employability is affected by many variables. Educational attainment, degree field, immigration status, and English language proficiency of the respondents were significant predictors of employability.