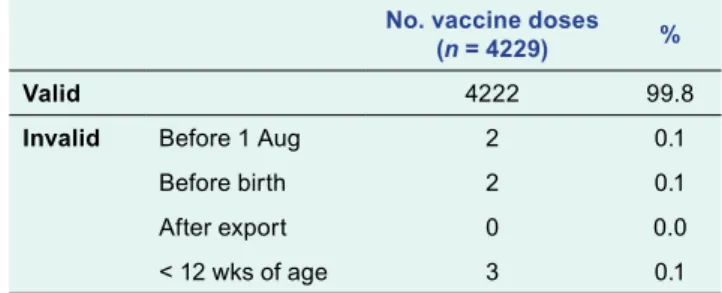
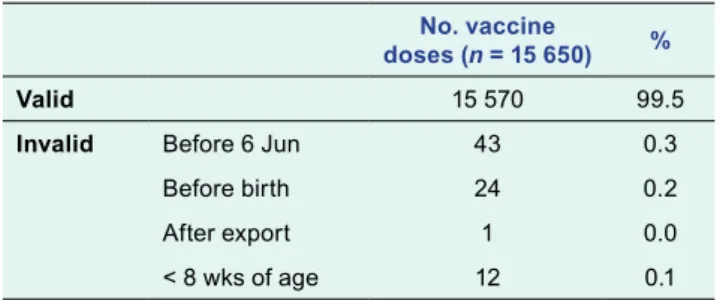
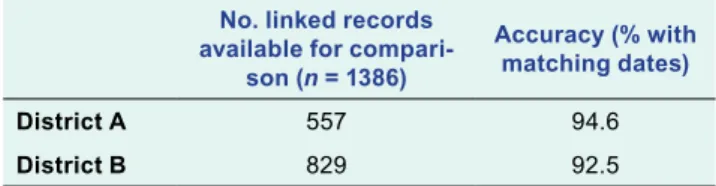
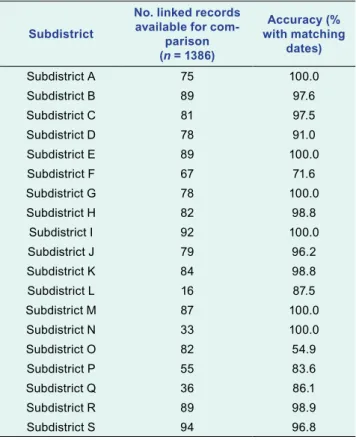
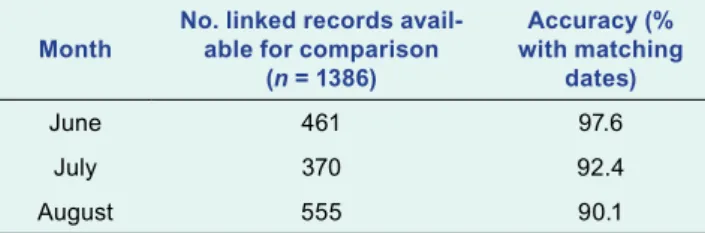
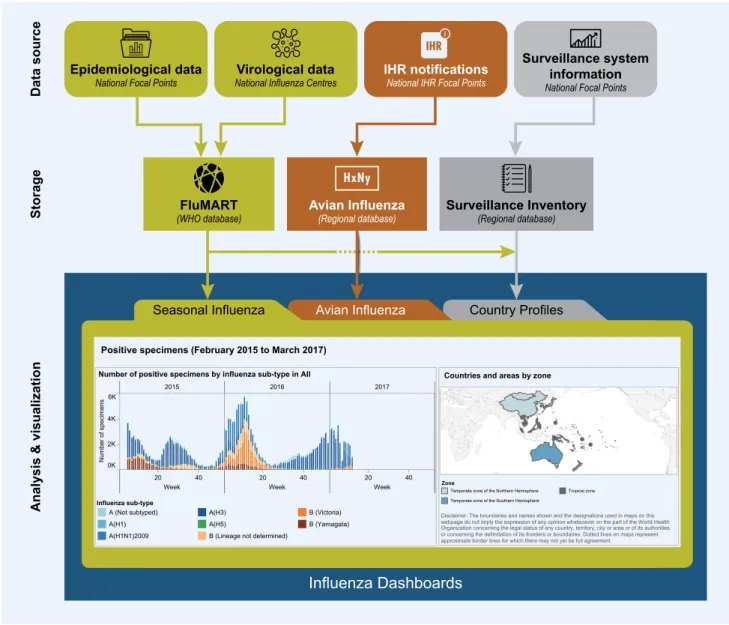
We linked the data from the written records to the electronic vaccination register with the national identification number to determine the completeness and accuracy of the electronic register. The usefulness of the immunization registry depends on the completeness and accuracy of the information it contains. Accuracy of the Electronic Immunization Registry For the 1273 patients who could be linked, there were 1386 records (or doses) that could be compared.
This audit showed that the overall completeness of the Mongolian Electronic Immunization Registry had high reliability compared to written records. When the electronic register is rolled out nationally, it is important to re-examine the completeness and correctness of the register. Validity of vaccination cards and parental memory to estimate vaccination coverage: a systematic review of the literature.
Completeness and accuracy of the Wisconsin immunization registry: an assessment coinciding with the onset of meaningful use. We would like to thank the immunization clinic staff for their time and effort in adopting the use of the electronic immunization record and facilitating data collection for this audit.
RESULTS
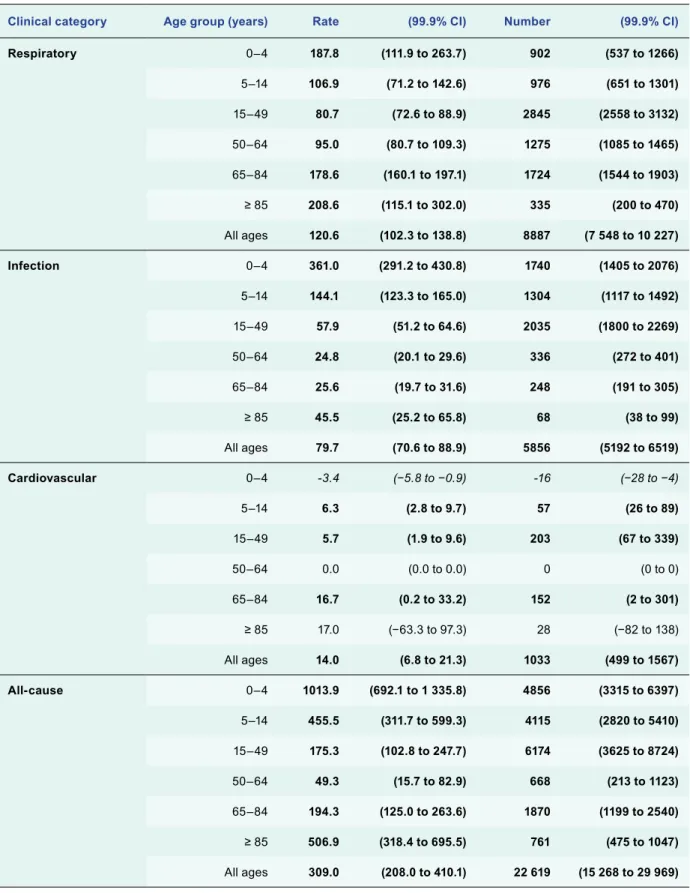
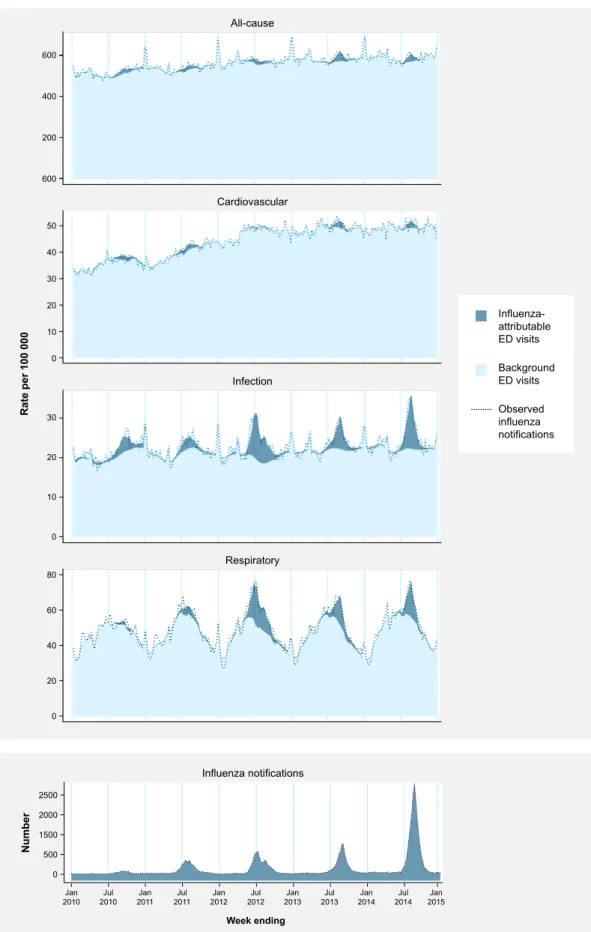
On average from 2010 to 2014, there was a U-shaped relationship between age and estimated respiratory visit rates in < 5-year-olds and ≥ 65-year-olds higher than 15–64-year-olds based on confidence intervals. The estimated infection visit rate in < 5-year-olds was significantly higher than the estimated respiratory rate in the same age group. Estimated all-cause incidence rates were highest in < 5-year-olds and decreased with age until the 50–64-year age group, then increased again with rates in ≥ 85-year-olds about half of.
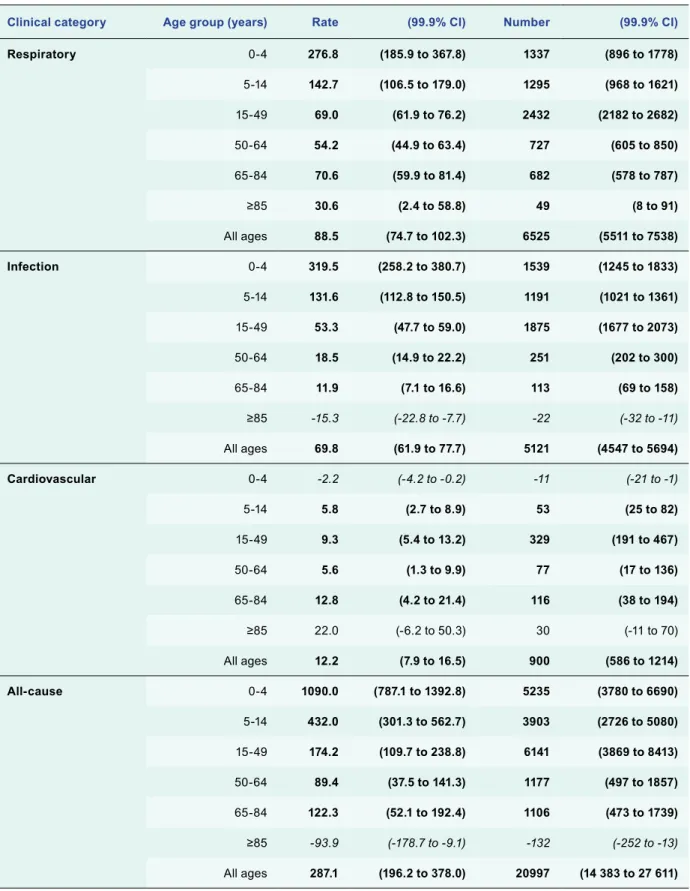
Observed weekly number of influenza reports, estimated influenza-attributable and non-influenza-attributable (background) visit rates/100,000 population/week for all-cause, cardiovascular, infectious, and respiratory clinical categories, and observed visit rates/ 100 000 population/week in each clinical category, for persons of all ages, NSW, 2010 to 2014 (n = 260 weeks). Mean annual estimated rate/100 000 population and number of influenza attributed ED visits by clinical category and age, NSW, 2010 to 2014. Mean annual estimated rate/100 000 population and number of unadmitted influenza ED visits by clinical category and age, NSW , 2010 to 2014.
Interpreting variation in flu-attributable burden from year to year requires an understanding of the flu strains that have been circulating and the effectiveness of flu vaccines. This is consistent with low levels of flu-attributable ED demand, although there was significant demand in the younger age groups, particularly in the infection clinical category. The vaccine showed good effectiveness of at least 70% against the pandemic strain in those years.20,21 The older age group experienced relatively low susceptibility to the pandemic strain due to pre-existing immunity. These factors combined would have contributed to the relatively low overall levels of flu-related visits in 2010–2011.
This season had the highest estimated incidence of respiratory emergency room visits or infection of all years studied in subjects of all ages and in children < 5 years. Rates in those ≥ 65 years old were also highest in 2012 for respiratory visits, infections, and all causes. Significantly estimated flu-related visits were evident in younger age groups broadly similar to surrounding years.
Vaccine efficacy against A(H3N2) in 2013 was good at 67%,24 which may explain the relatively lower levels of influenza-attributable visit numbers in older age groups compared to surrounding years.
DISCUSSION
Vaccine effectiveness in Australia against the circulating H3N2 strain was low in that season at 30% in 2012, which may be due to antigenic drift in the H3N2 virus. The greatest demand occurs among young children and in some years among the oldest population. Varying vaccine effectiveness may have explained the varying impact in the relatively well-immunised elderly population.
Improved vaccines and vaccination strategies that protect young children as well as older adults are needed to reduce morbidity in the population. In that year, vaccine efficacy was moderate (55%) against pandemic A(H1N1) but low (26%) against A(H3N2),24 possibly explaining significant influenza-attributable incidence in the elderly population. Changes in information systems over time may have led to inconsistencies in the recording of diagnoses and other information.
Bias may arise in the influenza notifications we used because the decision to test for influenza is at the discretion of the health care provider and notifications come from any type of medical service. Using all-age rather than age-specific influenza notifications in the model may explain negative estimates attributed to influenza, which are unlikely in reality. Using age-specific notifications in the model may improve estimates, but this requires further research.
Close involvement from leaders and the need to rapidly review and adapt the curriculum were important lessons learned, and collaboration between external partners was considered important in promoting a harmonized approach to health needs in the Pacific. The Pacific Islands and Territories in the Western Pacific (WHO) are American Samoa, Cook Islands, Fiji, French Polynesia, Guam, Kiribati, Marshall Islands, Federated States of Micronesia, Nauru, New Caledonia, Niue, Commonwealth of the Northern Mariana Islands, Palau, Papua New Guinea, Pitcairn Islands, Samoa, Solomon Islands, Tokelau, Tonga, Tuvalu, Vanuatu, and Wallis and Futuna. Despite the efforts of various programs, average life expectancy is generally low1 and has not improved significantly over the past two decades.2 The Global Burden of Disease 2015 Study estimated that lower respiratory tract infections, ischemic heart disease and diabetes represent the largest burden of disease in the cause world. Pacific Ocean;3 however, due to a lack of good quality, useful data, estimates of the global burden of disease for the Pacific Ocean are largely model based.4.
Recently, meetings of Pacific Island Health Ministers in 2011 and 2013 reinforced the need to further build the epidemiological capacity of staff in the Pacific.
ACTION
Academic accreditation was achieved in 2010 with the introduction of the Postgraduate Certificate in Field Epidemiology by the Fiji School of Medicine, which is now the College of Medicine, Nursing and Health Sciences of FNU. Regional development partners were once again called upon to assist with training programs “to address the lack of trained and experienced epidemiologists in the region. In response, PPHSN partners revamped the existing DDM program to ensure greater student engagement, improve relevance to current Pacific Island priorities and needs, and adopt a health system-wide approach applicable to both communicable diseases and NCDs.
CONTEXT
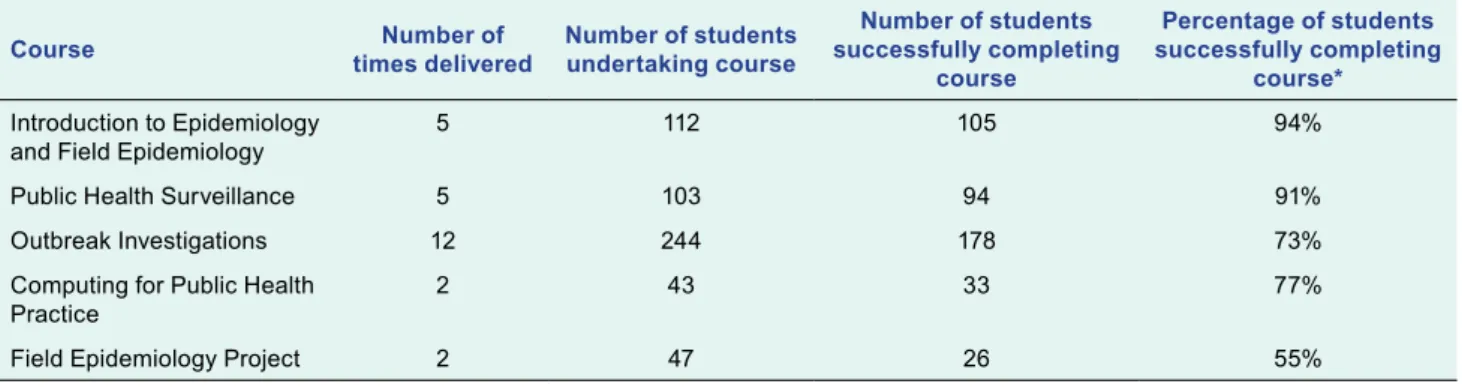
1).14 Students were required to develop an information product for each course (eg their own data analysis product, standard operating procedures for their control systems, outbreak reports). Changes to an existing FNU-accredited program have been accredited through an FNU program change. Students in each of the first four courses were assessed through formative and summative assessment.
Formative testing consisted of various forms of testing that did not contribute to the final mark and were intended to provide feedback to students. After each classroom course, facilitators met to review the course and make necessary refinements. For example, if it was felt that students did not understand a particular topic, more time was spent on it the following day, as well as in the subsequent delivery of the program entry requirements.
Prior to enrollment in the Pacific DDM program, students were required to have either a bachelor's degree or a minimum of five years of experience in the healthcare industry (demonstrated on their curriculum vitae) with a written and positive reference from a supervisor. The Pacific DDM program was delivered in-country by epidemiologists working for PPHSN partners including (in alphabetical order) CDC, FNU, PIHOA, SPC, University of Guam, University of Newcastle (Australia) and WHO. The original DDM program was modified to increase the use of participatory learning methods based on adult learning principles.
Sessions were structured so that theoretical concepts were presented in an interactive manner and reinforced through practical hands-on group activities, case studies and other interactive hands-on learning methods. Most of the existing presentations, exercises and resources were re-developed to ensure that the newly acquired knowledge and skills could be immediately applied by students within their health systems. Students who did not successfully complete a course either opted out of the assessment or took the assessment and failed.
OUTCOME
Service-oriented training in public health: a model for improving public health surveillance in the Pacific. Arboviruses continue to pose serious public health threats in the Western Pacific Region of the World Health Organization (WHO). The test performance of the 25 laboratories in the region in 2016 was high with 23 (92%) reporting correct results in all samples for dengue and chikungunya viruses.
Comparing the iterations of this EQA program in the region between 2013 and 2016, the number of participating laboratories increased from 18 to 25. The observed proficiency in arbovirus diagnostics between 2013 and 2016 is an indicator of the improvement in the quality of laboratories in the region. Therefore, public health laboratories and their equivalents in the research sector across the region have developed or adopted molecular methods for the detection of arboviruses.
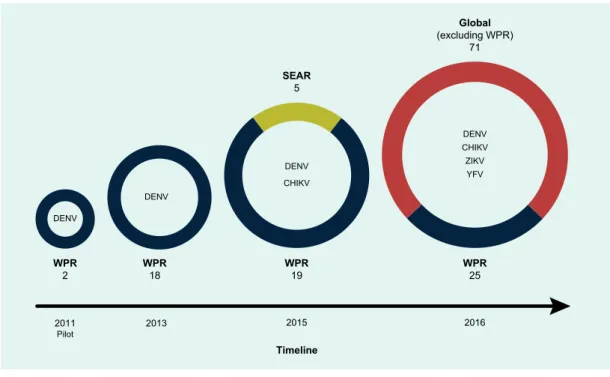
Of the 13 laboratories participating in the optional YFV detection module, nine (69%) successfully identified YFV in test samples. Comparing the results of EQA programs in the region between 2013 and 2016, EQA participation has consistently increased since 2013 (Figure 2). The main reference laboratories and participating centers in the region participated in the development of the EQA program (Figure 1).
Of the 26 invited laboratories, 25 laboratories from 19 countries, territories and areas of the Region provided results; one laboratory was unable to participate due to Increase in the number of participating laboratories, geographic coverage and pathogen diversity of the WHO EQA program for arbovirus diagnostics from pilot program to global program, 2011–2016. Capacity* of laboratories in the WHO Western Pacific Region participating in the EQA program for arbovirus diagnostics, 2013–2016.
First round of external quality assessment of dengue diagnostics in the WHO Western Pacific Region, 2013. The authors are grateful to the laboratories that have participated in the development of the EQA program for arboviruses since 2011. They also want all public health and research laboratories at the national level that have participated in the EQA program since its rollout in 2013.