HECTOR, GAYOMBA C. APRIL 2006. Growth and Yield of Promising Potato Genotypes Grown in an Organic Farm at Sinipsip, Buguias. Benguet State University, La Trinidad, Benguet.
Adviser: Ms. Esther Josephine D. Sagalla, BSc
ABSTRACT
The study aimed to evaluate the growth and yield of different potato genotypes in an organic farm, to identify the best performing potato genotypes based on yield, to determine the profitability of the different potato genotypes and to determine which of the potato genotypes will be selected by the organic farmer.
The study revealed that 13.1.1 had the highest canopy cover, highest resistance to late blight and highest total yield. Genotype 13.1.1 also had the highest ROCE for both seed and table potato production.
Genotype 13.1.1 could be produced at Sinipsip, Buguias. Genotypes 38025.17, 676070, and 5.19.2.2 could also be produced in the area since these genotypes were selected by the farmer.
Page
Introduction . . . i
Table of Contents . . . i
Abstract . . . ii
INTRODUCTION . . . 1
REVIEW OF LITERATURE . . . 3
Varietal Evaluation . . . 3
Productivity of Organically Grown Crops . . . 3
Effects of Organic Fertilizer on the Growth of Crops . . . 4
MATERIALS AND METHODS . . . 5
RESULTS AND DISCUSSION . . . 12
Temperature and Relative Humidity . . . 12
Soil Analysis . . . 13
Plant Survival . . . 13
Plant Height . . . 14
Plant Vigor . . . 15
Canopy Cover . . . 16
Leaf Miner . . . Late Blight Incidence . . . 17 17 Marketable, Non-marketable and Total Yield of Potato Tubers . . . 19
Potato Genotypes Selected by the Farmer . . . 20
Dry Matter Content . . . 24
SUMMARY, CONCLUSION AND RECOMMENDATION . . . 26
Summary . . . 26
Conclusion . . . 27
Recommendation . . . 27
LITERATURE CITED . . . 28
APPENDICES . . . 30
Potato is considered a world crop since it is produced in 130 nations. It is grown from sea level to 13,000 feet, and its edible dry matter accounts for a higher volume of the food consumed in the world than fish and meat combined (Rhaodes, 1982). Potato can also give 11,000 kg or more of tubers per hectare even in underdeveloped agricultural situations (Schultz, 1982).
In Benguet, Mountain Province, and some other areas where potatoes and other crops are grown, most of the farmers are using chemicals in farming. They use synthetic fertilizers and pesticides as a method to increase production and reduce yield loss.
However, these practices resulted in persistence or resistance of some pests and diseases, soil degradation, low yield and water pollution.
To solve some of these problems and to increase profit, some farmers in Benguet are now practicing organic farming. Instead of using chemicals, farmers employ crop rotation, biological control, and others to reduce pest and disease incidence. They also practice green manuring and use compost or organic fertilizer to sustain the fertility of their soil. As a result, higher yields are produced (Lang, 2005) and higher profit is gained.
Many farmers believe that potato has a potential for sustainable, non-chemical farming since it fits well with many crop rotations, and does very well with natural fertilizers. However, growing potato organically need a potential variety which is able to produce high yield.
The objectives of the study is to:
1. evaluate the growth and yield of different potato genotypes grown in an organic farm;
2. identify the best performing potato genotypes based on yield;
3. determine the profitability of the different potato genotypes; and
4. determine which of the potato genotypes will be selected by the organic farmer.
The study was conducted in an organic farm at Sinipsip, Buguias, Benguet from November 2005 to February 2006.
REVIEW OF LITERATURE
Varietal Evaluation
To have a high yield, selecting a variety is necessary. Rasco and Amante (1994) stated that variety evaluation is a process of documenting variety traits that can be used to distinguish one variety from other varieties. Furthermore, Work and Carew (1995) cited that varietal evaluation is done to observe characters such as yield, earliness, vigor, maturity and quality.
Bautista and Mabesa (1972) suggested that a variety to be selected should be high yielding, resistant to pest and disease, early maturing, and requires less input. In addition, Cagampang and Lantican (1977) observed that the choice of variety is important. The wise use of an improved and well-selected variety may result to tremendous increase in yield.
Productivity of Organically Grown Crops
Yields in an organic farm during drought are comparable to or slightly better than in a conventional farm. Organic farming yields would vary from moderately less than to nearly comparable with conventional farming yields (Poincelot, 1986).
Organic farming produced either the same yield or lower but consume less energy. Crop yields may be 20 % lower in the organic system, but input of fertilizer and energy is reduced by 34 % to 53 % and pesticides input by 77 % (Madder and Fliebach, 2002).
Scientist and farmers agree that it is economically feasible to grow potatoes
thousand to forty thousand pounds per acre is the usual range of organic yields while conventional growers, often on muck soils, average around twenty seven thousand pounds per acre (Caldwell, 1993). Furthermore, organic potatoes can be grown on a large scale without commercial pesticides and standard fertilizers. However, yields are lower than conventionally produced potatoes.
Huntsinger (1995) cited that in carefully monitored fields tests in 1990, organic farming yield an average of twenty one thousand two hundred pounds of potatoes per acre (over three tested varieties) while conventional farming methods yielded thirty two thousand eight hundred pounds per acre.
Effects of Organic Fertilizer on the Growth of Crops
Donahue (1971) reported that organic matter supply some of the nutrients needed by the growing plants as well as hormones and antibiotics. The nutrients are released in harmony with the needs of plants. When environmental conditions are favorable, rapid growth may happen.
Pandosen (1980) found out that organic matter contains nutrients, which can be available through the work of microorganisms. The nutrients from the organic fertilizer are supplemented by inorganic fertilizer mainly nitrogen (N), phosphorous (P) and potassium (K). Once they are available, they are translocated by potassium thereby influencing the growth of plants.
MATERIALS AND METHODS
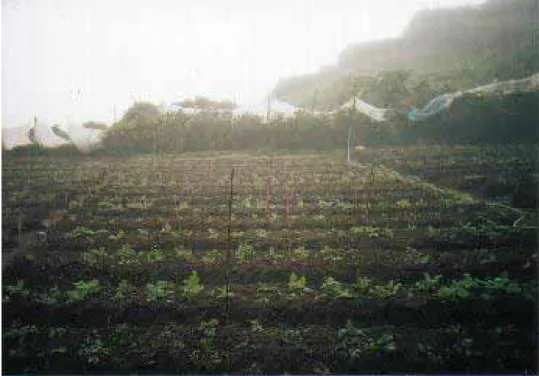
The study was conducted in a 150 m2 area which was thoroughly prepared. The area was divided into three blocks containing ten plots measuring 1 x 5 meters each to accommodate all the ten potato genotypes ( Figure 1).
The potato genotypes that were observed are the following:
GENOTYPE ORIGIN
380251.17 CIP, Peru
384558.10 CIP, Peru
676070 CIP, Peru
Ganza Philippines
285411.22 CIP, Peru
573275 CIP, Peru
676089 CIP, Peru
5.19.2.2 CIP, Peru
575003 CIP, Peru
13.1.1 CIP, Peru
Preparation of Planting Materials
Clean mother plants were established and cut after 12 to 14 days. The stem cuttings were then rooted in plastic trays containing sterilized black subsoil and compost.
After 8-12 days, the rooted cuttings were planted in the field.
Layout and Planting
The experiment was laid out in randomized complete block design (RCBD) with three replications. The planting distance was 25 x 30 cm between hills and rows.
The Farmer and the Farm
Mr. Johnny F. Osting is organic practitioner for almost six years. He updates himself by attending seminars and trainings to gain additional knowledge and skills on organic farming. He last attended the 1st Cordillera Organic Agriculture Congress in January of 2006.
His farm which is almost flat and located on the top of a mountain is 2,350.31 meters above sea level. The crops he previously planted were carrots and raddish. The soil type of his farm is sandy loam.
His farm was conventional for almost ten years and transitioned to an organic farm four years ago.
Cultural Management Practices
Fertilizer application was done before planting. The basal fertilizer that was used is a combination of compost chicken manure, sunflower and other weeds. Botanical fungicide was used only during the occurrence of late blight.
All cultural management practices were employed uniformly to all plots as needed throughout the duration of the study.
Data Gathered
1. Temperature and relative humidity. The temperature and relative humidity of the area were taken every after two weeks using a Compact Sling Psychrometer.
2. Soil analysis. The nitrogen, phosphorous, potassium, soil pH, and organic matter content of the soil were taken before planting and after harvesting.
3. Percentage survival. This was taken one week after transplanting and computed using the formula:
Number of surviving plants Total number of plants planted
4. Plant height. Initial and final height was taken one week after hilling up and one week before harvest respectively.
5. Plant vigor. This was recorded at 30 and 45 days after transplanting using the rating scale of 1-5 as follows:
RATING DESCRIPTION 5 Highly vigorous 4 Vigorous 3 Moderate vigor 2 Poor vigor 1 Very poor vigor
6. Canopy cover. It was taken 30, 45, 60 and 75 DAP by using a wooden frame 120 x 60 cm in size and have equally sized 12 x 6 cm grids.
7. Leaf miner incidence. The appearance of insects was observed at 30, 45, 60, and 75 DAP using the following scale (CIP, 2000):
% Survival = X 100
RATING DESCRIPTION REMARKS 1 Less infested (1-20 %) Resistant
2 Infested (20-40 %) Moderately resistance 3 Moderate infested (41-60 %) Intermediate
4 Severely infested (61-80 %) Moderately susceptible 5 Most serious Susceptible
8. Late blight incidence. Observation was done at 45, 60 and 75 DAP using the following scale (Henfling 1982):
BLIGHT CIP SCALE*
DESCRIPTION OF CORRESPONDING SYMPTOMS
0 1 No blight can be observed.
0.1-1.0 1 Very few plants are affected with lesions.
1.1-2.0 2 Not more than two lesions per 10 m of row (+/=30 plants).
3.1-10. 0 3 Up to 3 small lesions per plant or 1 lesion per 2 leaflet attacked.
10.1-24.0 4 Most plants are visibly attacked by late blight, 1 in 3 leaflets infected but few multiple infection per leaflet.
25.0-29.0 5 Newly every leaflet have lesions, multiple infection per leaflet is common, fields or plot looks green but plants in plot are infected.
50.0-74.0 6 All plants have blight and half area is infected, plots look green, freckled and brown blight is very obvious.
75.0-90.0 7 As previous, but three quarters of each plant blighted. Lower branches may be overwhelming killed off, and the only green leaves if any are at the top of the plants. Shade of the plant maybe more spindly due to extensive foliage loss. Plots
91.0-97.0 8 Some leaves and most stems are green. Plots look brown with some green patches.
98.0-99.9 9 Few green leaves, almost all that remain are those with blight lesions. Many stem lesion, plot looks brown. All leaves and stem are dead.
100 9 All leaves and stem are dead.
*Description: 1-Highly resistant; 2-3 Resistant; 4-5 Moderately resistant;
6- Moderately susceptible; 8-9 Susceptible.
9. Weight of marketable tubers per 5 m2 (g). All tubers with marketable quality were weighed at harvest.
10. Weight of non-marketable tubers per 5 m2 (g). Tubers which were less than 11 g, cracked, deformed, rotten, and damaged by pest were weighed at harvest.
11. Total yield per 5 m2 (g). This was taken by adding the weight of non- marketable and marketable tubers.
12. Selection of the farmer. The potato genotypes which were selected by the organic farmer and his reasons for selection were noted.
13. Return on cash expense (ROCE) per 5 m2. This was computed using the formula:
Net Return Expense
14. Dry matter content (%). Dry matter content of potato tubers was taken using the following formula:
% Dry Matter = 100 % - % Moisture content
Where: Fresh weight – Oven dry weight Fresh weight
ROCE = X 100
% Moisture content = X 100
Data Analysis
All quantitative data was analyzed using Analysis of Variance (ANOVA) of the randomized complete block design (RCBD) with three replications. The significance of differences among the treatment means will be tested using Duncan’s Multiple Range Test (DMRT).
Figure 1. Overview of the experiment 35 days after planting
RESULTS AND DISCUSSION
Temperature and Relative Humidity
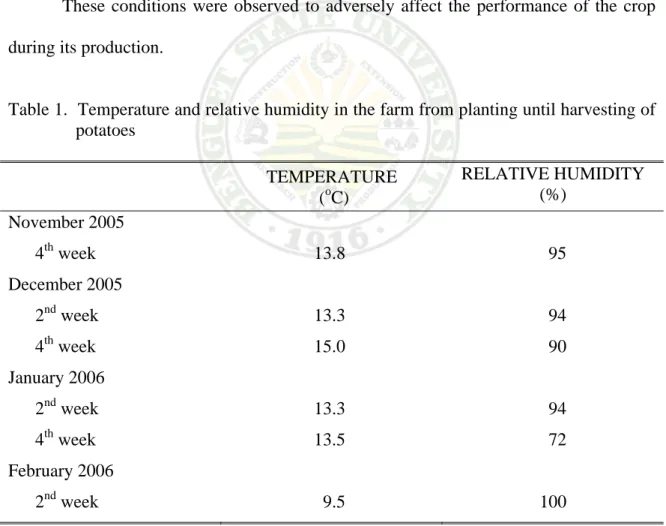
Table 1 shows the temperature and relative humidity during the growth and development of the plants. The lowest temperature was found in the 2nd week of February whereas, the highest was during the 4th week of December.
Relative humidity (%) was found to be highest during the 2nd week of February and lowest in the 3rd week of January. The location was observed to be always cloudy and windy which might be due to the high elevation of the farm.
These conditions were observed to adversely affect the performance of the crop during its production.
Table 1. Temperature and relative humidity in the farm from planting until harvesting of potatoes
TEMPERATURE (oC)
RELATIVE HUMIDITY (%)
November 2005
4th week 13.8 95
December 2005
2nd week 13.3 94
4th week 15.0 90
January 2006
2nd week 13.3 94
4th week 13.5 72
February 2006
2nd week 9.5 100
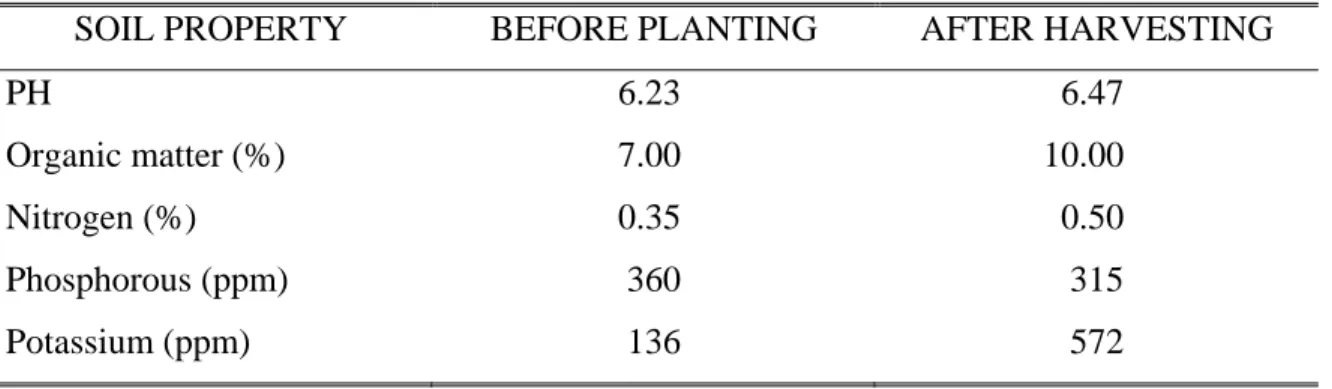
Soil Analysis
The soil analysis before planting and after harvesting is shown in Table 2. The soil pH, organic matter, nitrogen and potassium increased after harvest. This may be indirectly due to the low temperature of the soil. Low soil temperature causes crop roots to be stunted, stubby and have few branches, thus reducing the ability of the roots to absorb water and nutrients (Kohnke, 1968). Hence, the fertilizer applied before planting was probably not absorbed by the potato plants.
Phosphorous content of the soil on the other hand decreased from 360 ppm to 315 ppm. This might be the only element absorbed by the plant at its early stage of growth.
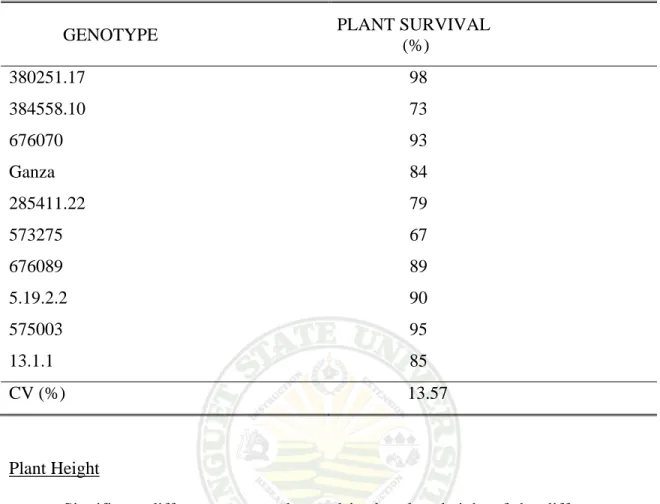
Plant Survival
Percent survival of the different genotypes was taken at 30 days after planting (Table 3). No significant differences was observed among the genotypes. However, 380251.17 had the highest percentage survival despite the strong wind and rain.
Table 2. Soil analysis before planting and after harvesting
SOIL PROPERTY BEFORE PLANTING AFTER HARVESTING
PH 6.23 6.47
Organic matter (%) 7.00 10.00
Nitrogen (%) 0.35 0.50
Phosphorous (ppm) 360 315
Potassium (ppm) 136 572
Table 3. Plant survival of the different potato genotypes at 30 days after planting
GENOTYPE PLANT SURVIVAL (%)
380251.17 98 384558.10 73 676070 93 Ganza 84 285411.22 79 573275 67 676089 89 5.19.2.2 90 575003 95 13.1.1 85 CV (%) 13.57
Plant Height
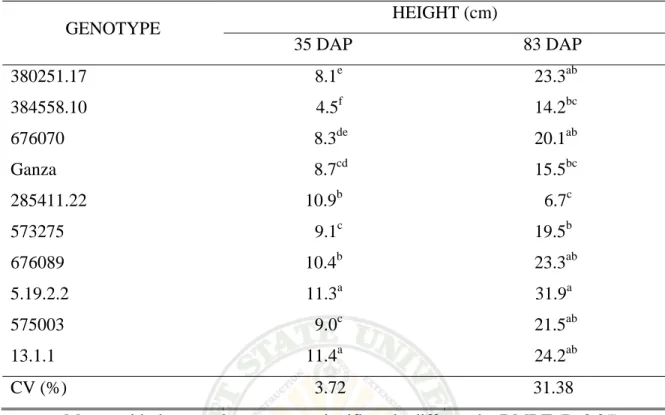
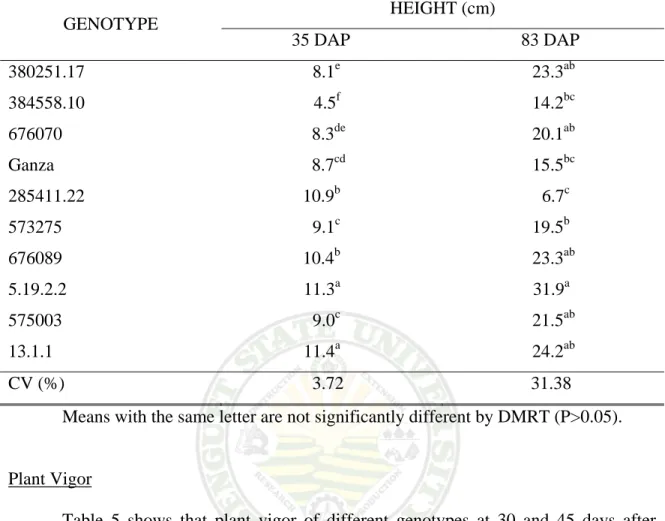
Significant differences were observed in the plant height of the different potato genotypes at 35 and 83 days after planting (Table 4). Initially, genotype 13.1.1 and 5.19.2.2 were the tallest while 384558.10 was the shortest but after 83 DAP 5.19.2.2 remained to be the tallest while 285411.22 turned out to be the shortest.
The differences of height among the genotypes could be attributed to their genotypic characteristics.
Table 4. Plant height of the different potato genotypes at 35 and 83 days after planting
GENOTYPE HEIGHT (cm)
35 DAP 83 DAP
380251.17 8.1ee 23.3ab
384558.10 4.5fe 14.2bc
676070 8.3de 20.1ab
Ganza 8.7cd 15.5bc
285411.22 10.9be 6.7ce
573275 9.1ce 19.5be
676089 10.4be 23.3ab
5.19.2.2 11.3ae 31.9ae
575003 9.0ce 21.5ab
13.1.1 11.4ae 24.2ab
CV (%) 3.72 31.38
Means with the same letter are not significantly different by DMRT (P>0.05).
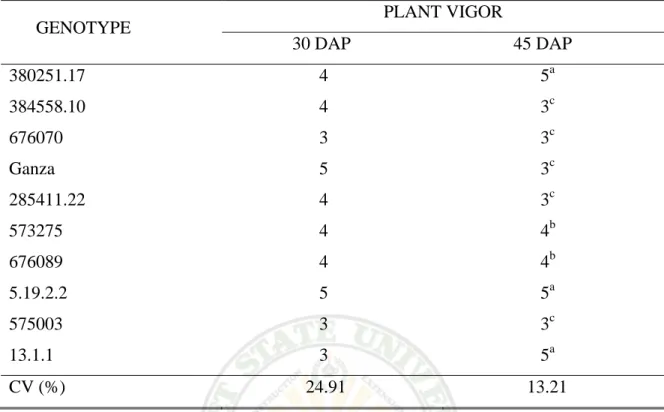
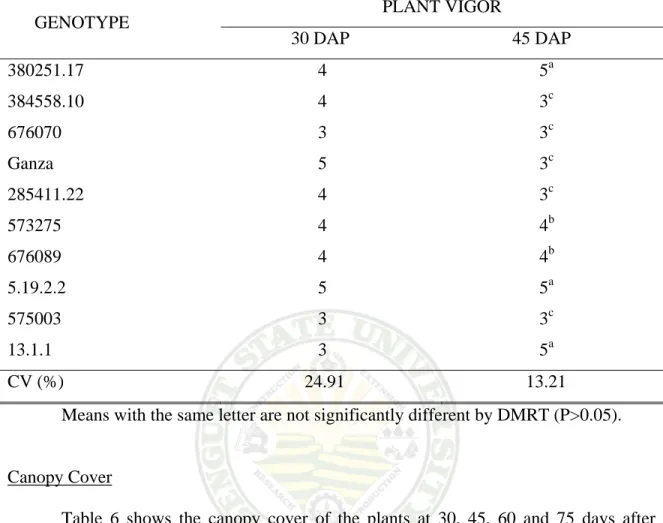
Plant Vigor
Table 5 shows that plant vigor of different genotypes at 30 and 45 days after planting. Statistical differences were observed among the genotypes at 45 DAP but not at 30 DAP. Genotypes 368025.17, 5.19.2.2 and 13.1.1 were found to be highly vigorous while the other genotypes were either moderately vigorous or vigorous.
It was observed that at 45 DAP, genotype 380251.17 and 13.1.1 turned highly vigorous even after they were rated as only vigorous and moderately vigorous at 30 DAP.
This occurrence might be due to the rejuvenation of the plants. Some of the plants from these genotypes were observed to have produced new shoots.
There was a decrease in vigor in the remaining genotypes which could be due to
Table 5. Plant vigor of the different potato genotypes at 30 and 45 days after planting
GENOTYPE PLANT VIGOR
30 DAP 45 DAP
380251.17 4 5a
384558.10 4 3c
676070 3 3c
Ganza 5 3c
285411.22 4 3c
573275 4 4b
676089 4 4b
5.19.2.2 5 5a
575003 3 3c
13.1.1 3 5a
CV (%) 24.91 13.21
Means with the same letter are not significantly different by DMRT (P>0.05).
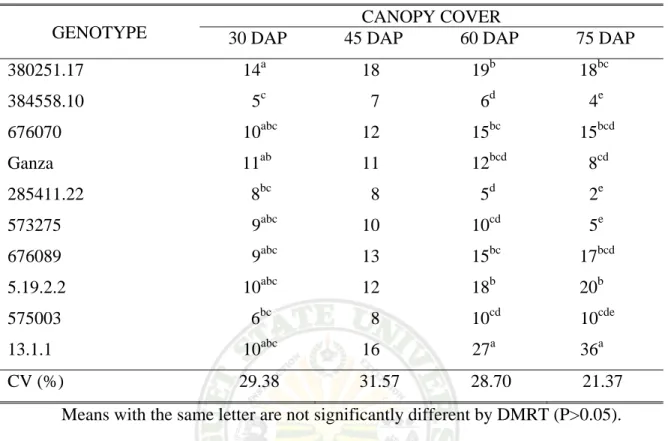
Canopy Cover
Table 6 shows the canopy cover of the plants at 30, 45, 60 and 75 days after planting. Significant differences were observed among the genotypes except at 45 DAP.
Genotype 13.1.1 consistently had the highest canopy cover until 75 DAP while 384558.10 had the lowest. The differences in canopy cover might be attributed to the earliness or lateness of tuber formation of the different genotypes. It was found that genotypes which tuberize later develop more canopies of longer duration than genotypes twhich tuberize earlier (Cardesa et al., 2001).
Furthermore, an increasing trend of canopy cover can be observed from genotypes 13.1.1, 5.19.2.2, and 676089, which could be an indication of their resistance to late
Table 6. Canopy cover of the ten different potato genotypes at 30, 45, 60 and 75 days after planting
GENOTYPE CANOPY COVER
30 DAP 45 DAP 60 DAP 75 DAP 380251.17 14abc 18 19bbc 18bcb
384558.10 5cbc 7 6dbc 4ebc
676070 10abc 12 15bcb 15bcd
Ganza 11abb 11 12bcd 8cdb
285411.22 8bcb 8 5dbc 2ebc
573275 9abc 10 10cdb 5ebc
676089 9abc 13 15bcb 17bcd
5.19.2.2 10abc 12 18bbc 20bbc
575003 6bcb 8 10cdb 10cde
13.1.1 10abc 16 27abc 36abc
CV (%) 29.38 31.57 28.70 21.37 Means with the same letter are not significantly different by DMRT (P>0.05).
676070 and 575003 which maintained the same canopy cover at 60 and 75 DAP. The decrease in canopy might in turn be an indication of susceptibility to late blight injection.
Leaf Miner Incidence
Leaf miner incidence was absent among the genotypes which might be due to the low temperature and high relative humidity in the farm.
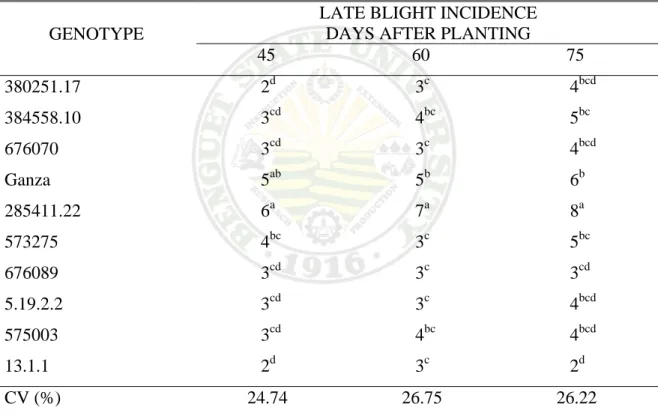
Late Blight Incidence
Table 7 shows significant differences on the resistance of the ten potato genotypes to late blight at 45, 60 and 75 days after planting. Initially at 45 DAP, most of the potato
resistant while the rest of the genotypes were either moderately resistant or susceptible to the disease.
The resistance of the genotypes were also observed to decrease at 45 to 75 DAP except for 13.1.1. Furthermore, genotypes 676089 and 575003 remained resistant and moderately resistant at 75 DAP which might be due to the botanical fungicide (Virtuoso) sprayed at 55 DAP.
Table 7. Late blight incidence of the ten different potato genotypes at 45, 60 and 75 days after planting
GENOTYPE
LATE BLIGHT INCIDENCE DAYS AFTER PLANTING
45 60 75
380251.17 2d 3c 4bcd
384558.10 3cd 4bc 5bc
676070 3cd 3c 4bcd
Ganza 5ab 5b 6b
285411.22 6a 7a 8a
573275 4bc 3c 5bc
676089 3cd 3c 3cd
5.19.2.2 3cd 3c 4bcd
575003 3cd 4bc 4bcd
13.1.1 2d 3c 2d
CV (%) 24.74 26.75 26.22
Means with the same letter are not significantly different by DMRT (P>0.05).
Scale and description: 1–Highly resistant; 2-3–Resistant; 4-5–Moderately resistance; 6-7–
Moderately susceptible, 8-9–Susceptible.
Marketable, Non-marketable and Total Yield of Potato Tubers
Significant differences can be observed in the marketable, non-marketable and total yield of tubers of the ten different potato genotypes (Table 8). Genotype 13.1.1 produced the highest marketable and non-marketable tubers while 384558.10 produced the lowest marketable and non-marketable tubers. Moreover, it follows that 13.1.1 produced the highest weight of total yield and 384558.10 produced the lowest total yield.
Fig. 2 shows the harvested tubers from the different genotypes.
The genotype with the highest yield (13.1.1) was also found to be the most resistant to late blight infection and had the highest canopy cover.
Table 8. Marketable, non-marketable and total yield of potato tubers
GENOTYPE YIELD (g)/5 m2 MARKETABLE NON-
MARKETABLE TOTAL
380251.17 1,580b 77ab 1,657b
384558.10 228e 15c 243f
676070 607de 46bc 653cdef
Ganza 477de 28bc 505def
285411.22 249e 55abc 304ef
573275 781cd 48bc 829cde
676089 880cd 58abc 9.38cd
5.19.2.2 1,124bc 33bc 1,157c
575003 465de 71ab 536def
13.1.1 2,570a 103a 2,673a
CV (%) 15.79 30.14 29.38
Means with the same letter are not significantly different by DMRT (P>0.05).
Potato Genotypes Selected by the Farmer
Out of the ten potato genotypes, the farmer selected only 380251.17, 676070, 5.19.2.2, and 13.1.1 (Table 9). These genotypes were selected due to their resistance to late blight, medium to large tuber size, attractive skin color (676070), and high plant vigor. Furthermore, these genotypes are considered adapted to the area since it can withstand the unfavorable environment condition in the farm.
Table 9. Potato genotypes selected by the farmer and his reasons for selection POTATO GENOTYPES REASONS FOR SELECTION
380251.17 Resistant to late blight, medium sized tubers, highly vigorous, and can withstand the unfavorable environmental condition in the farm.
676070 Resistant to late blight, large tubers even, uniform number of tubers per plant, and attractive red skin color.
5.19.2.2 Resistant to late blight, medium sized tubers, highly vigorous, and can withstand the unfavorable environmental condition in the farm.
13.1.1 Resistant to late blight, large sized tubers, highly vigorous, and can withstand to the unfavorable environmental condition in the farm.
380251.17
384558.10
676070
Ganza
285411.22
573275
676089
5.19.2.2
575003
13.1.1
Cost and Return Analysis
Table 10a shows the cost of producing seed tubers from the ten potato genotypes in an area of 5 m2. Genotype 13.1.1 had the highest ROCE of 896 % while 384558.10 had the lowest ROCE of 22 %. This result indicates that the genotypes with the highest yield also had the highest profit.
Most of the potato genotypes had a negative return on cash expense (% ROCE) if produced as table potatoes (Table 10b). This negative result might be due to the small tuber sizes and low weight of tubers of the different genotypes. Genotype 13.1.1, however, had a positive albeit low ROCE (%). This might be due to the presence of a few large tubers which contributed to the increased weight of the genotype.
Table 10a. Cost and return analysis of the ten potato genotypes per 5 m2 for seed tuber production
GENOTYPE YIELD
(No./5m2)
GROSS SALE
(Php)
TOTAL EXPENSES
(Php)
NET INCOME
(Php)
ROCE (%)
380251.17 93 372 98 274 280
384558.10 30 120 98 22 22
676070 72 288 98 190 194
Ganza 55 220 98 122 124
285411.22 52 208 98 110 112
573275 64 256 98 158 161
676089 62 248 98 150 153
5.19.2.2 112 448 98 350 357
575003 47 188 98 90 92
13.1.1 244 976 98 878 896
Note: Php 4.00 is the selling price per G1 tuber.
Total expenses include labor cost, cost of planting material, fertilizer and botanical fungicide (Virtouso).
Table 10c shows that the return on cash expense of seed tubers is much higher than the return on cash expense for table potato. This result indicates that production of the ten different potato genotypes for G1 seed tubers is more profitable.
Table 10b. Cost and return analysis of the ten potato genotypes per 5 m2 for table potato production
GENOTYPE GROSS SALE (Php)
TOTAL EXPENSES
(Php)
NET INCOME (Php)
ROCE (%)
380251.17 63 98 -35 -36
384558.10 9 98 -89 -91
676070 24 98 -74 -76
Ganza 19 98 -79 -81
285411.22 10 98 -88 -90
573275 31 98 -67 -68
676089 35 98 -53 -54
5.19.2.2 45 98 -53 -54
575003 19 98 -79 -81
13.1.1 103 98 5 5
Note: Php 4.00 is the selling price of table potato tubers per kilogram.
Total expenses include cost of labor, fertilizer, planting material and botanical fungicide (Virtouso).
Table 10c. Cost and return analysis of the ten potato genotypes per 5 m2 for both seed and table potato production
GENOTYPE ROCE (%)
SEED TUBER TABLE POTATO
380251.17 280 -36
384558.10 22 -91
676070 194 -76
Ganza 124 -81
285411.22 112 -90
573275 161 -68
676089 153 -54
5.19.2.2 357 -54
575003 92 -81
13.1.1 896 5
Dry Matter Content
Table 11 shows the significant differences in the dry matter content of the different genotypes. Highest dry matter content was obtained from genotypes 5.19.2.2 and 13.1.1. The differences of dry matter among the genotypes are due to varietal characteristics (Hesen, 1985) since dry matter content of the tubers is related to the potato variety.
Furthermore, genotypes 5.19.2.2 and 13.1.1 may be good for chips and French fry processing since high dry matter content of potatoes results in lower oil content of the fried product (Hesen, 1985).
Table 11. Dry matter content of the ten different potato genotypes
GENOTYPE DRY MATTER
(%)
380251.17 17c
384558.10 18b
676070 16d
Ganza 17c
285411.22 17c
573275 17c
676089 18b
5.19.2.2 19a
575003 18b
13.1.1 19a
CV (%) 2.34
Means with the same letter are not significantly different by DMRT (P>0.05).
SUMMARY, CONCLUSION AND RECOMMENDATION
Summary
The study was conducted in an organic farm at Sinipsip, Buguias, Benguet to evaluate the growth and yield performance of different potato genotype in an organic farm, to identify the best performing potato genotypes based on yield, to determine the profitability of the different potato genotypes, and to determine which of the potato genotypes will be selected by the organic farmer.
Temperature was low and the relative humidity was high in the organic farm during the growth of the different potato genotypes. The soil pH, organic matter, nitrogen and potassium increased after harvest while the phosphorous content of the soil decreased.
No significant differences were observed among the genotypes but 380251.17 had the highest percentage survival. Moreover, genotype 5.19.2.2 was the tallest at 35 and 83 days after planting. Genotypes 380251.17, 5.19.2.2, and 13.1.1 also were found to be highly vigorous while the rest were either moderately vigorous or vigorous.
An increasing trend of canopy cover was observed from genotypes 13.1.1, 5.19.2.2 and 676089 which could be an indication of resistance to late blight.
Genotypes 380251.17, 676070, 5.19.2.2 were selected by the farmer due to their resistance to late blight, medium to large tubers and high plant vigor. These genotypes can also withstand the unfavorable environmental condition in the farm.
Genotype 13.1.1 also had the highest ROCE (%) in both seed and table potato.
Furthermore, genotypes 13.1.1 and 5.19.2.2 significantly had the highest dry matter
Conclusion
Based on the results, genotype 13.1.1 which had the highest canopy cover and highest resistance to late blight infection also had the highest total yield. Furthermore, genotype 13.1.1 also had the highest ROCE (%) for both seed and table potato. Thus, it appears that wide canopy cover and resistance to late blight infection may enhance better yield.
Genotype 13.1.1 is therefore adopted and could be produced at Sinipsip, Buguias.
In addition, genotypes 380251.17, 676070 and 5.19.2.2 might also be produced since these genotypes were selected by the farmer.
A low yield was observed in most of the genotypes which could be due to the very low temperature and high relative humidity at Sinipsip. This occurrence may explain the negative values of ROCE (%) for table potatoes.
Recommendation
Genotype 13.1.1 can be recommended for both seed and table production in Sinipsip, Buguias, Benguet.
Furthermore, to verify the results gathered, the genotypes could be planted during the months of February to May since conditions are more favorable for potato production during these months.
LITERATURE CITED
BAUTISTA, O. K. and R. C. MABESA. 1972. Vegetable production. University of the Philippine, Los Banos (UPLB). P. 16.
CARDESA, Y., WONG YON CHEONG, K. and N. GOVINDEN. 2001. Tropical potato clones with larger canopies do not effect the growth, yield and yield components of intercropped sugar cane. Http://www.bioline.org.br/request?cs01035.
CAGAMPANG, I. C. and H. C. LANTICAN. 1977. Field production guidelines in the Philippines: Multiple cropping. University of the Philippines, Los Banos (UPLB), Laguna. P. 177.
CALDWELL, B. 1993. Production and marketing of organic potato New York.
Extension Education, South Central NY Fruit and Vegetable Program. P. 61.
CIP. 2000. Compiled data sheet (loose sheet). International Potato Center (CIP). 3 pages.
DONAHUE, R. L. 1971. Soils and introductory to soils and plant growth. 3rd ed.
Interstate Printers and publishers, Inc. Danville, Illinoines. Pp. 226-227.
HESEN, J.C. 1985. Potato processing. Institute for storage and processing of agricultural product (IBVL). Wageningen, Netherlands. P. 8.
HENFLING, J. W. 1982. Field screening procedures to evaluate resistance to late blight.
technology evaluation. Series no. 1982-05. International Potato Center (CIP).
Lima, Peru. P. 11.
HUNTSINGER, T. 1995. Sustainable potato production. University of New Castle upon Tyre. 15: 4-5.
KOHNKE. H. 1968. Soil physics. Tata Mc Graw-hill Publishing Company LTD.
Bombay, New Delhi: Pp. 171-187.
LANG, S. S. 2005. Growing potato organically: if it is profitable. Cornell University News Service. Http//www.CUnewsservice.edu.com.
MADDER, P. and A. FLIEBACH. 2002. Soil fertility and biodiversity in organic farming. Science V. 296, n. 5573. P. 321.
PANDOSEN, M. .D. 1980. Effect of different rates of N, K and organic fertilizer on the yield of Irish potato. BSA Thesis. Mountain State Agricultural College, La Trinidad, Benguet.
POINCELOT, R. P. 1986. Toward a more sustainable agriculture. AVI Publishing Company, Inc. WestPoint, Connecticut. P. 75.
RASCO, E. T and V. R. AMANTE. 1994. Sweet potato variety evaluation. Southeast Asia Program for Potato Research and Development (SAPRRAD). P. 20.
RHAODES, R. E. 1982. The incredible potato. National Geographic. P. 30.
SCHULTZ, W. J. 1982. Great taste in potatoes. Organic gardening. A Prentice Hall/Macmillan Company. P. 5.
APPENDICES
APPENDIX TABLE 1. Percent survival of the different potato genotypes at 30 days after planting
GENOTYPE BLOCK
TOTAL MEAN I II III
380251.17 100 95 100 285 98
384558.10 48 78 93 219 73
676070 85 100 95 280 93
Ganza 90 83 78 251 84
285411.22 80 63 95 238 79
573275 75 58 73 206 67
676089 100 93 75 268 89
5.19.2.2 83 88 98 269 90
575003 85 100 100 285 95
13.1.1 75 83 98 256 85
ANALYSIS OF VARIANCE
SOURCE OF VARIATION
DEGREES OF FREEDOM
SUM OF SQUARES
MEAN SQUARE
COMPUTED F
TABULATED F
0.05 0.01
Block 2 385.067 192.533
Treatment 9 2,488.033 276.448 2.05ns 2.46 3.60
Error 18 2,488.267 134.904
TOTAL 29 5,301.367
ns – Not significant Coefficient of Variation = 13.57 %
APPENDIX TABLE 2. Plant vigor of the different potato genotypes at 30 days after planting
GENOTYPE BLOCK
TOTAL MEAN I II III
380251.17 5 3 5 13 4 384558.10 5 3 3 11 4
676070 3 3 3 9 3
Ganza 5 5 5 15 5
285411.22 5 5 3 13 4
573275 3 3 5 11 4
676089 5 3 3 11 4
5.19.2.2 5 5 5 15 5
575003 3 3 5 11 3
13.1.1 3 5 3 11 3
ANALYSIS OF VARIANCE
SOURCE OF VARIATION
DEGREES OF FREEDOM
SUM OF SQUARES
MEAN SQUARE
COMPUTED F
TABULATED F
0.05 0.01
Block 2 0.800 0.400
Treatment 9 11.333 1.259 1.27ns 2.46 3.60
Error 18 17.867 0.993
TOTAL 29 30.000
ns – Not significant Coefficient of Variation = 24.91 %
APPENDIX TABLE 3. Plant vigor of the different potato genotypes at 45 days after planting
GENOTYPE BLOCK
TOTAL MEAN I II III
380251.17 5 5 5 15 5a
384558.10 3 3 3 9 3c
676070 3 3 3 9 3c
Ganza 3 3 3 9 3c
285411.22 3 3 3 9 3c
573275 5 3 3 11 4b
676089 5 5 3 13 4b
5.19.2.2 5 5 5 15 5a
575003 3 3 3 9 3c
13.1.1 5 5 5 15 5a
ANALYSIS OF VARIANCE
SOURCE OF VARIATION
DEGREES OF FREEDOM
SUM OF SQUARES
MEAN SQUARE
COMPUTED F
TABULATED F
0.05 0.01
Block 2 0.800 0.400
Treatment 9 23.467 2.607 10.35** 2.46 3.60
Error 18 4.533 0.252
TOTAL 29 28.800
** – Highly significant Coefficient of Variation = 13.21 %
APPENDIX TABLE 4. Plant height of the different potato genotypes at 35 days after planting
GENOTYPE BLOCK
TOTAL MEAN I II III
380251.17 7.8 8.0 8.5 24.3 8.1e e 384558.10 4.9 4.5 4.1 13.5 4.5fe
676070 8.4 8.4 8.0 24.8 8.3de
Ganza 9.1 8.9 8.0 26.0 8.7cd
285411.22 11.7 11.0 10.0 32.7 10.9be
573275 9.0 9.3 9.2 27.3 9.1ce
676089 10.7 10.5 10.0 31.2 10.4be 5.19.2.2 11.7 11.2 11.1 34.0 11.3ae
575003 9.2 9.0 8.9 27.1 9.0ce
13.1.1 11.8 11.5 10.9 34.2 11.4ae
ANALYSIS OF VARIANCE
SOURCE OF VARIATION
DEGREES OF FREEDOM
SUM OF SQUARES
MEAN SQUARE
COMPUTED F
TABULATED F
0.05 0.01
Block 2 1.730 0.865
Treatment 9 114.614 12.735 109.44** 2.46 3.60
Error 18 2.094 0.116
TOTAL 29 118.438
** – Highly significant Coefficient of Variation = 3.72 %
APPENDIX TABLE 5. Plant height of the different potato genotypes at 83 days after planting
GENOTYPE BLOCK
TOTAL MEAN I II III
380251.17 23.2 23.3 23.5 70.0 23.3ab 384558.10 16.0 13.8 12.7 42.6 14.2bc 676070 23.2 20.0 17.2 60.4 20.1ab
Ganza 15.3 22.3 9.0 46.6 15.5bc
285411.22 0 20.00 0 20.00 6.7cc 573275 26.6 16.0 16.0 58.6 19.5bc 676089 28.7 24.8 16.3 69.8 23.3ab 5.19.2.2 29.3 31.1 35.3 95.7 31.9ac 575003 24.5 24.3 15.8 64.6 21.5ab 13.1.1 11.4 34.1 27.1 72.6 24.2ab
ANALYSIS OF VARIANCE
SOURCE OF VARIATION
DEGREES OF FREEDOM
SUM OF SQUARES
MEAN SQUARE
COMPUTED F
TABULATED F
0.05 0.01
Block 2 161.406 80.703
Treatment 9 1,244.936 138.326 3.50* 2.46 3.60
Error 18 711.081 39.504
TOTAL 29 2,117.423
* – Significant Coefficient of Variation = 31.38 %
APPENDIX TABLE 6. Canopy cover of the different potato genotypes at 30 days after planting
GENOTYPE BLOCK
TOTAL MEAN I II III
380251.17 20 7 14 41 14acc
384558.10 6 4 4 14 5ccc
676070 16 6 7 29 10abc
Ganza 13 9 12 34 11abc
285411.22 10 9 5 24 8bcc
573275 15 5 8 28 9abc
676089 15 6 6 27 9abc
5.19.2.2 12 8 10 30 10abc
575003 7 7 5 19 6bcc
13.1.1 12 11 6 29 10abc
ANALYSIS OF VARIANCE
SOURCE OF VARIATION
DEGREES OF FREEDOM
SUM OF SQUARES
MEAN SQUARE
COMPUTED F
TABULATED F
0.05 0.01
Block 2 178.067 89.033
Treatment 9 167.500 18.611 2.57* 2.46 3.60
Error 18 130.600 7.256
TOTAL 29 476.167
* – Significant Coefficient of Variation = 29.38 %
APPENDIX TABLE 7. Canopy cover of the different potato genotypes at 45 days after planting
GENOTYPE BLOCK
TOTAL MEAN I II III
380251.17 23 13 16 54 18 384558.10 7 8 6 21 7
676070 17 10 9 36 12
Ganza 14 10 10 34 11
285411.22 7 10 6 23 8
573275 15 5 9 29 10
676089 20 12 8 40 13
5.19.2.2 12 12 13 37 12
575003 9 9 6 24 8
13.1.1 24 15 8 47 16
ANALYSIS OF VARIANCE
SOURCE OF VARIATION
DEGREES OF FREEDOM
SUM OF SQUARES
MEAN SQUARE
COMPUTED F
TABULATED F
0.05 0.01
Block 2 207.200 103.600
Treatment 9 2,306.000 256.222 1.47ns 2.46 3.60
Error 18 3,140.800 174.489
TOTAL 29 5,654.000
ns – Not significant Coefficient of Variation = 31.57 %
APPENDIX TABLE 8. Canopy cover of the different potato genotypes at 60 days after planting
GENOTYPE BLOCK
TOTAL MEAN I II III
380251.17 21 14 23 58 19bdd
384558.10 3 9 7 19 6ddd
676070 17 14 13 44 15bcd
Ganza 12 14 9 35 12bcd
285411.22 4 5 6 15 5ddd
573275 16 6 9 31 10cdd
676089 22 15 9 46 15bcd
5.19.2.2 17 16 21 54 18bdd
575003 11 13 7 31 10cdd
13.1.1 34 23 23 80 27add
ANALYSIS OF VARIANCE
SOURCE OF VARIATION
DEGREES OF FREEDOM
SUM OF SQUARES
MEAN SQUARE
COMPUTED F
TABULATED F
0.05 0.01
Block 2 56.267 28.133
Treatment 9 1,136.033 126.226 8.08** 2.46 3.60
Error 18 281.067 15.615
TOTAL 29 1,473.367
** – Highly significant Coefficient of Variation = 28.70 %
APPENDIX TABLE 9. Canopy cover of the different potato genotypes at 75 days after planting
GENOTYPE BLOCK
TOTAL MEAN I II III
380251.17 23 9 21 53 18bcd
384558.10 5 4 4 13 4edv
676070 19 12 13 44 15bcd
Ganza 4 16 4 24 8dcd
285411.22 4 3 0 7 2edd
573275 8 2 5 10 5edd
676089 28 16 8 52 17bcd
5.19.2.2 20 15 25 60 20bdd
575003 12 13 6 31 10cde
13.1.1 38 38 31 101 36adv
ANALYSIS OF VARIANCE
SOURCE OF VARIATION
DEGREES OF FREEDOM
SUM OF SQUARES
MEAN SQUARE
COMPUTED F
TABULATED F
0.05 0.01
Block 2 104.867 52.433
Treatment 9 2,664.800 296.089 11.20** 2.46 3.60
Error 18 475.800 26.433
TOTAL 29 3,245.467
** – Highly significant Coefficient of Variation = 21.37 %
APPENDIX TABLE 10. Late blight incidence of the different potato genotypes at 45 days after planting
GENOTYPE BLOCK
TOTAL MEAN I II III
380251.17 1 2 2 5 2d
384558.10 2 5 3 10 3cd
676070 3 3 3 9 3cd
Ganza 5 4 5 14 5ab
285411.22 7 5 6 18 6a
573275 3 4 4 11 4bc
676089 3 4 3 10 3cd
5.19.2.2 3 4 3 10 3cd
575003 2 3 3 8 3cd
13.1.1 3 1 3 7 2d
ANALYSIS OF VARIANCE
SOURCE OF VARIATION
DEGREES OF FREEDOM
SUM OF SQUARES
MEAN SQUARE
COMPUTED F
TABULATED F
0.05 0.01
Block 2 0.600 0.300
Treatment 9 34.867 4.430 6.26** 2.46 3.60
Error 18 12.733 0.707
TOTAL 29 53.200
** – Highly significant Coefficient of Variation = 24.74 %
APPENDIX TABLE 11. Late blight incidence of the different potato genotypes at 60 days after planting
GENOTYPE BLOCK
TOTAL MEAN I II III
380251.17 3 3 3 9 3cc
384558.10 7 3 3 13 4bc
676070 3 4 3 10 3cc
Ganza 6 5 5 16 5bc
285411.22 8 6 6 20 7ac
573275 4 3 3 10 3cc
676089 3 3 3 9 3cc
5.19.2.2 3 3 3 9 3cc
575003 5 3 3 11 4bc
13.1.1 3 3 2 8 3cc
ANALYSIS OF VARIANCE
SOURCE OF VARIATION
DEGREES OF FREEDOM
SUM OF SQUARES
MEAN SQUARE
COMPUTED F
TABULATED F
0.05 0.01
Block 2 7.400 3.700
Treatment 9 38.800 4.311 4.17** 2.46 3.60
Error 18 18.600 1.033
TOTAL 29 64.800
** – Highly significant Coefficient of Variation = 26.75 %
APPENDIX TABLE 12. Late blight incidence of the different potato genotypes at 75 days after planting
GENOTYPE BLOCK
TOTAL MEAN I II III
380251.17 3 4 5 12 4bcd
384558.10 6 7 2 15 5bcc
676070 3 4 4 11 4bcd
Ganza 6 5 7 18 6bcc
285411.22 7 8 9 24 8acc
573275 3 6 6 15 5bcc
676089 2 3 4 9 3cdc
5.19.2.2 4 5 4 13 4bcd
575003 3 4 4 11 4bcd
13.1.1 2 3 2 7 2dcc
ANALYSIS OF VARIANCE
SOURCE OF VARIATION
DEGREES OF FREEDOM
SUM OF SQUARES
MEAN SQUARE
COMPUTED F
TABULATED F
0.05 0.01
Block 2 5.600 2.800
Treatment 9 70.833 7.870 6.65** 2.46 3.60
Error 18 25.067 1.393
TOTAL 29 101.500
** – Highly significant Coefficient of Variation = 26.22 %
APPENDIX TABLE 13. Weight of marketable tubers of the different potato genotypes per 5m2 (g)
GENOTYPE BLOCK
TOTAL MEAN I II III
380251.17 2,000 1,043 1,697 4,740 1,580be
384558.10 267 178 240 685 228ee
676070 632 522 667 1,821 607de
Ganza 667 364 400 1,431 477de
285411.22 325 182 240 747 249ee
573275 1,500 343 500 2,343 781cd
676089 1,520 720 400 2,640 880cd
5.19.2.2 1,667 667 1,037 3,371 1,124bc
575003 490 433 473 1,396 465de
13.1.1 2,609 2,727 2,375 7,711 2,570ae
ANALYSIS OF VARIANCE
SOURCE OF VARIATION
DEGREES OF FREEDOM
SUM OF SQUARES
MEAN SQUARE
COMPUTED F
TABULATED F
0.05 0.01
Block 2 1,142,080.267 571,040.133
Treatment 9 13,436,513.500 1,548,501.500 19.25** 2.46 3.60 Error 18 1,447,676.400 80,426.467
TOTAL 29 1+,526,270.167
** – Highly significant Coefficient of Variation = 15.79 %
APPENDIX TABLE 14. Weight of marketable tubers of the different potato genotypes per 5m2 (g)
GENOTYPE BLOCK
TOTAL MEAN I II III
380251.17 114 87 30 231 77abb
384558.10 0 4 40 44 15eb
676070 84 26 27 137 46bcb
Ganza 17 18 50 85 28bcb
285411.22 50 36 80 166 55abc
573275 67 6 67 140 48bcb
676089 56 64 53 173 58abc
5.19.2.2 22 33 44 99 33bcb
575003 40 100 73 213 71abb
13.1.1 87 91 130 308 103abb
ANALYSIS OF VARIANCE
SOURCE OF VARIATION
DEGREES OF FREEDOM
SUM OF SQUARES
MEAN SQUARE
COMPUTED F
TABULATED F
0.05 0.01
Block 2 835.800 417.900
Treatment 9 17,896.133 1,988.459 2.66* 2.46 3.60 Error 18 13,454.867 747.493
TOTAL 29 32,186.800
* – Significant Coefficient of Variation = 30.14 %
APPENDIX TABLE 15. Total yield of the different potato genotypes per 5m2 (g)
GENOTYPE BLOCK
TOTAL MEAN I II III
380251.17 2,114.4 1,130.4 1,727.2 4,972.0 1,657b 384558.10 266.8 182.4 280.0 729.2 243f 676070 716.0 548.0 6932.2 1,957.2 653cdef Ganza 683.2 382.0 450.0 1,515.2 505def 285411.22 374 218.4 320.0 912.0 304ef 573275 1,520.3 400.0 566.8 2,487.1 829cde 676089 1,576.0 784.0 453.2 2,813.2 938cd 5.19.2.2 1,688.8 700.0 1,0813.6 3,470.4 1,157c 575003 530.0 533.2 544.8 1,608.0 536def 13.1.1 2,695.6 2,818.0 2,505.2 8,018.8 2,673a
ANALYSIS OF VARIANCE
SOURCE OF VARIATION
DEGREES OF FREEDOM
SUM OF SQUARES
MEAN SQUARE
COMPUTED F
TABULATED F
0.05 0.01
Block 2 720.319 360.160
Treatment 9 9,104.912 1,011.657 20.14** 2.46 3.60 Error 18 904.201 50.233
TOTAL 29 10,729.433
** – Highly significant Coefficient of Variation = 29.68 %
APPENDIX TABLE 16. Dry matter content (%) of the different potato genotypes
GENOTYPE BLOCK
TOTAL MEAN I II III
380251.17 17 17 17 51 17c
384558.10 18 18 18 54 18b
676070 16 16 16 48 16d
Ganza 17 17 17 51 17c
285411.22 17 17 18 52 17c
573275 17 17 16 50 17c
676089 17 18 18 53 18b
5.19.2.2 19 19 20 58 19a
575003 18 18 18 54 18b
13.1.1 19 20 19 58 19a
ANALYSIS OF VARIANCE
SOURCE OF VARIATION
DEGREES OF FREEDOM
SUM OF SQUARES
MEAN SQUARE
COMPUTED F
TABULATED F
0.05 0.01
Block 2 0.267 0.133
Treatment 9 31.633 3.575 20.63** 2.46 3.60
Error 18 3.067 0.170
TOTAL 29 34.967
** – Highly significant Coefficient of Variation = 2.37 %