MENDOZA, MARVIN T. APRIL 2011. Evaluation of Bush Snap Bean Varieties Applied with Different Volumes of Water in La Trinidad, Benguet. Benguet State University, La Trinidad Benguet.
Adviser: Janet P. Pablo, M.Sc.
ABSTRACT
The study was conducted to determine the growth and yield of the different bush snap bean varieties applied with the different volumes of water; determine the best water requirements for bush snap bean production; and to determine the interaction effect of the bush snap bean varieties and the volumes of water on the growth and yield of bush snap beans.
Sablan and Bokod have the tallest plant height at 30 and 60 DAP, produced more flower clusters, more pods per clusters while Contender had the widest leaf area, highest percentage pod set per cluster, widest pod, longest pod, and more crown roots. On the other hand Sablan has the longest roots and Bokod had the highest total yield per plant.
The different volumes of water significantly affected the number of crown roots and length of the roots of the different bush bean varieties.
No significant differences were noted in all the parameters gathered as affected by the bush snap bean varieties and the application of different volumes of water.
Page
Bibliography……… i
Abstract ………. i
Table of Contents ……… ii
INTRODUCTION ……… 1
REVIEW OF LITERATURE ……… 3
Effect of Water stress on Plant ……… 3
Effects of Water Stress on Growth Stages of the Plant ……… 3
Effects of Water Stress on the Flower, Pod set and Pod Formation of the Plant ……… 4
Effect of Water Stress on Root ……… 4
Water Stress Resistance in Legumes ……… 5
MATERIALS AND METHODS ……… 7
RESULTS AND DISCUSSION ………...…. 13
Agro Climatic Data During the Study Period ……… 13
Days from Sowing to Emergence and Flowering ……… 13
Initial Plant Height at 30 and 60 DAP ……… 14
Plant Vigor at 30 and 60 DAP ……… 15
Days from Emergence to Pod Setting, First, and Last Harvest ……….…… 16
Number of Flower per Cluster ……… 17
Number of Pod per Cluster ……… 18
Percentage Pod Set per Cluster ……...………. 19
Pod Length and Width ………..…… 20
Leaf Length and Width ……… 21
Number of Crown Roots ………. 22
Root Length ……… 24
Reaction to Bean Rust and Pod Borer ……… 24
Weight of Marketable Pods (g) ……… 26
Non- Marketable Weight of Pods (g) ………... 26
Total Yield per Plant (g) ………...… 27
SUMMARY, CONCLUSION AND RECCOMENDATION ………. 30
Summary ……….. 30
Conclusions ………..……… 30
Recommendations ……….. 31
LITERATURE CITED ……….. 32
APPENDICES ………... 34
INTRODUCTION
Snap bean (Phaseolus vulgaris L.) is a common source of protein for human diet and as well as feed supplement for animals. Snap bean thrives well in cool medium to high altitude just like Benguet (Mariano, 2007). Further, it is one of the main sources of income of the farmers in the highlands, like Benguet. They plant this crop mostly for it is easily grown and does not require intensive management, but, for how many decades, climate change became one of the major constraints to the bean production.
Pendleton and Lawson (1987) quoted that weather and climate changes strongly affect the fluctuation of food supplies. Also, climate is a foremost factor in determining the adaptability of crops. High rainfall and humidity which adversely affect reproduction, ripening, drying, storage, increase pest and disease problems of cereals and grain legumes. Fluctuating rainfall patterns combined with soils of low moisture-holding capacity often lead to periodic drought.
One farmer mentioned that farming is a game of chance (“Sugal id niman nan men garden”) (BSU-ISRD and FAO, Undated). This proves that farmers in Benguet are already experiencing the effects of climate change as evident in the observed occurrence of new pests and diseases, also crop destruction due to El Niño, La Niña, hail stone and frost, and disruption of agricultural calendar.
At present, water stress is also one of the factors which limit the production of snap bean. Water stress reduced the expression of most traits with the exception of days to flower and leaf retention capacity. In addition, legume species often result in a loss of seed yield (Singh and Saxena, 1990). Plants react to stress where there is abnormal growth, and it could be either a decline in quality or yield reduction, where both are
important. Water stress can cause direct and indirect damages to the crops. Deficiency in water can cause poor stand when water stress occurs during germination, and yield reduction or decline in quality, such as deformity in the fruits of beans. Indirect damage may consists of calcium deficiency , while water excess can also cause direct damage, such as leaching of fertilizers, reduced root development, and development of adventitious roots. Indirect effect can favor the occurrences of root rot and other diseases.
In this case, there is a need to evaluate potential varieties of beans which are able to withstand different volume of water condition.
Thus, this study was conducted to:
1. evaluate the growth and yield of the different bush snap bean varieties applied with different volumes of water;
2. determine the best water requirements for bush snap bean production; and 3. determine the interaction effect of the bush snap bean varieties and the different volumes of water on the growth and yield of bush snap bean.
In addition, the choice of appropriate variety that can cope up with different volumes of water is an important factor in the successful production of beans because planting of variety that does not tolerate different volumes of water will lead to losses.
The study was conducted at Balili, La Trinidad, Benguet in a greenhouse from November 2010 to March 2011.
REVIEW OF LITERATURE
Effect of Water Stress on the Plant
Water stress affects practically every aspects of plant growth, modifying the anatomy, morphology, physiology and biochemistry (Kramer, 1993).
In 1975, Tisdale and Nelson stated that plants require water for the manufacture of carbohydrates, to maintain hydration of protoplasm, and as a vehicle of the translocation of foods and other mineral elements. It also said that moisture stress causes reduction in the cell elongation, hence retarding the growth of the plant. Recently, Chapman and Carter (1976) postulated that all plants are harmed to some degree by inadequate moisture and added that under condition of drought where total plant growths or dry matter is reduced consequently reducing yield.
However, excessive water also affects crop growth where it causes direct damage to shoots, high incidence of pests and diseases, physical destruction of flowers, and less activity of pollinators (AVRDC, 1990).
Effects of Water Stress on Growth Stages of the Plant
Maiti (1997) stated that the normal process of seedling development is largely controlled by environmental factors and influences the development of the adult plant.
Kramer (1976) as cited by Bawang (1990) stated that the vegetative growth is particularly sensitive to water deficit because growth is closely related to turgor and loss of turgidity stops cell division.
In addition, AVRDC (1990) stated that under this condition, guard cells lose their turgidity and stomatal opening decreases. Eventually, the rate of photosynthesis and
consequently growth and yield also decrease where in extreme condition the plant may either wilt or die.
However, under excess water conditions plant growth are being toxified, and finally retards growth of the plant. It also said that crops in the early vegetative stage may be unable to develop a deep root system if light watering is made regularly.
Effects of Water Stress on the Flower, Pod set and Pod Formation of the Plant
Salehi et al., (2006) reported that seedling and flowering stages were the most sensitive to water availability and water stress. However, occurrence of water stress during any growth stages in legume species often results in a loss of yield especially seed yield. Catipon et al. (1988) reported that intensive water stress in dry season and strong wind in humid season reduced mungbean seed yield.
For all crops grown for fruits and seed, Chapman and Carter (1976) stated that moisture stress before, during and immediately after flowering seems to have the greatest effect on reducing yield.
Excessive abortion of flowers, young pods and seeds occurs in dry bean because of water stress during pre- flowering (10 to 12 days before anthesis) and reproductive periods. Moderate to severe water stress reduced biomass and seed yield from 20 percent to 90 percent, harvest index, number of pods and seeds, seed weight, and days to maturity (Salehi et al., 2008).
Effect of Water Stress on Root
Drought stress increase root shrinkage that consequently affects nutrient transport to the root surface due to reduced contact between root and soil (North and Nobel, 1997).
Passioura (2002) stated that dry soil particles hold water and nutrient more strongly on the surface, and dry soil is more compact for root penetration. Root rots caused by Macrophomina phaseolina (Tassi) Groid; Fusarium solani f.sp.phaseoli (Burk), and other fungi may aggravate drought stress. Similarly, drought stress cultivars are prone to damage by leafhoppers in the tropics and subtropics. While excess water can also reduced root development and development of adventitious roots. Indirect damage due to excess water consists of root rot and other diseases, which are favored by high soil moisture (AVRDC, 1990). As a result, plant roots cannot obtain oxygen for respiration to maintain their activities for nutrient and water uptake.
Water Stress Resistance in Legumes
Some bean cultivars reportedly have a certain degree of resistance to water stress.
Resistant varieties are capable of growing and yielding satisfactorily under unfavorable growing conditions. Plants which can survive drought either avoid or tolerate drought are called to be drought avoiders where they avoid drying of their tissues by maintaining their water uptake and/or reducing water loss. The plant should be able to produce more roots than shoots. In addition, it has the ability to move its leaves so that only a very small leaf area is exposed to incoming radiation. It also develops hairs to insulate the leaf surface and it becomes waxier. According to AVRDC (1990) all these characteristics reduce light absorption, hence, reduce water loss. In most of these drought avoiders are, legumes.
On the other hand, tolerators survive drought by functioning normally even with a low amount of water in their tissues (AVRDC, 1990).
Kramer (1969) pointed out that very young seedlings are more resistant to water stress than older plants.
Excessive water also affects crop growth but however, the extent of flooding damages depends upon the susceptibility of species or variety (AVRDC, 1990).
MATERIALS AND METHODS
The experiment was done at BSU- Experimental Station in Balili, La Trinidad, Benguet in a greenhouse. The area was properly cleaned. Plastic pots with a measurement of 15.24cm x 27.94cm were used and filled with soil and bio-fertilizer with a 3:1 ratio.
Three bean seeds were planted per pot at a depth not exceeding 2.5 centimeters. After one week germination it was thinned to only one plant per pot. The study was laid out using 3x5 factor factorial in Completely Randomize Design (CRD) with three replications.
Weeding was done to avoid water and nutrient competition on the crop. A rate of 120 grams compost fertilizer was applied to every pot at 20 days after planting. Irrigation management as treatment was strictly applied to the plant when the true leaves fully appeared. The different volumes of water served as Factor A and the three bush snap bean varieties served as Factor B.
Factor A: Volume of water (T)
Code Treatment
T0 200 ml. of water will be applied to all control plants every other day (Farmers Practice)
T1 800 ml. of water will be applied every morning of the day to all plants when the true leaf has fully appeared
T2 500 of water will be applied every morning of the day to all plants when the true leaf has fully appeared
T3 100 ml. of water will be applied every other day to all plants when the true leaf has fully appeared
T4 45 ml. of water will be applied every other day to all plants when the true leaf has fully appeared
Factor B: Varieties (V)
Code Variety Source
V1 Contender BSU- NPRCRTC
V 2 Bokod BSU- NPRCRTC
V 3 Sablan BSU- NPRCRTC
The data gathered were the following:
1. Number of days from sowing to emergence. This was recorded by counting the number of days from sowing to emergence and when at least 60% of the seed sown has emerged.
2. Initial plant height (cm). This was measured from the base of the plant at the ground level to the youngest shoots, using a meter stick or a foot rule from five plant samples in different treatment at 30 days after planting.
3. Final height (cm). This was measured from the base of the plant at the ground level to the youngest shoots, using a meter stick or a foot rule from five plant samples in different treatment at 60 DAP.
4. Plant vigor. This was taken using these scales at 30 DAP and 60 DAP.
(NPRCRTC, 1997).
Scale Description Remarks
1 Plants are weak with few stems and leaves; very pale.
Poor vigor
2 Plants are weak with few thin stems and leaves; pale
Less vigor
Scale Description Remarks 3 Better than less vigorous Vigorous 4 Plants are moderately
strong with robust stem and leaves; leaves are light green in color.
Moderately vigorous
5 Plants are strong with robust stems and leaves;
leaves are light to dark green color.
Highly vigorous
5. Days from emergence to flowering. This was recorded starting from emergence to the day when 60% of plants have flowered.
6. Days from emergence to pod setting. This was taken by counting the number of days starting from flowering to the days when pods are formed at the same time recording the date of pod setting.
7. Days from emergence to first harvest. This was recorded by counting the number of days from emergence to first harvest at the same time recording the date of first harvest.
8. Days from emergence to last harvest. This was taken by counting the number of days from emergence to last harvest at the same time recording the date of last harvest.
9. Number of flower cluster per plant. This was taken by counting the flower cluster from the five sample plants.
10. Number of flower per cluster. This was taken by counting the flowers per cluster from the five sample plants.
11. Number of pods per cluster. This was recorded by counting the number of pods per cluster from five sample plants.
12. Percentage pod set per cluster. This was taken by using this formula:
% Pod Setting = Total number of pods per cluster x 100 Total number of flower per cluster
13. Length of pod (cm). This was recorded by measuring the five randomly selected pods at harvest maturity.
14. Width of pod (cm). This was recorded by measuring the five randomly selected pods at harvest maturity.
15. Leaf length (cm). This was recorded by measuring the first trifoliate leaves of five sample plants from petiole to leaf tip at 30 days after planting.
16. Leaf width (cm). This was recorded by measuring the first trifoliate leaves of five sample plants from tip to tip sides at 30 days after planting.
17. Root length. This was recorded by measuring the tap or primary roots of five sample plants using a meter stick or a foot rule after the last harvest.
18. Number of crown roots. This was recorded by counting the crown roots of five sample plants.
19. Weight of marketable fresh pod per plant (kg). This was the pods that are smooth, well- formed and free from damages. The fresh pod of variety in different treatment was weighed after harvest.
20. Weight of non- marketable fresh pods per plant (kg). This was the pods that are over matured, malformed, and damage by pest and diseases. This was obtained by weighing the non- marketable fresh pods of variety in different treatment.
21. Total yield per plant (kg). This was recorded by getting the total weight of marketable and non- marketable fresh pods per plant in the different treatment throughout the harvest period.
22. Disease and Pest Incidence. This was noted by visual observation and was assessed by rating the degree of disease and insect damage on the crop at 30 DAP and 60 DAP.
a. Bean rust. ( as cited by Jose, 2004).
Scale Description Remark
1 No infection High resistant
2 1-25% of the total plants are infected. Mild resistant 3 25-50% of the total plants are infected. Moderate resistant 4 50-75% of the total plants are infected. Susceptible
5 75-100% of the total plants are infected. Very susceptible
b. Pod borer.
Scale Description Remark
1 No infection High resistant
2 1-25% of the total plants are infected. Mild resistant 3 25-50% of the total plants are infected. Moderate resistant 4 50-75% of the total plants are infected. Susceptible
5 75-100% of the total plants are infected. Very susceptible
23. Agro- climatic data. The average monthly temperature, relative humidity, sun intensity was taken using the appropriate measuring devices like light meter and hygrometer every Mondays during the entire growing seasons of the crop from December 2010 to March 2011.
Data Analysis
All quantitative data was analyzed using analysis of variances (ANOVA) for Completely Randomize Design (CRD) with three replications. The significance of
difference among treatment means was tested using Duncan’s Multiple range test (DMRT) at 5% level of significance.
RESULTS AND DISCUSSIONS
Agro- Climatic Data during the Study Period
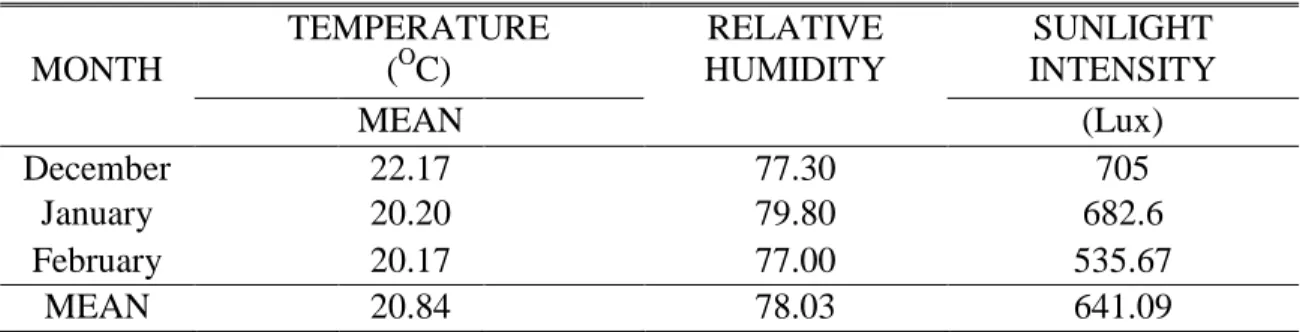
Table 1 shows the temperature, relative humidity and sunlight intensity.
Temperature ranged from 20.17 to 22.17 0C, relative humidity is 78.03 %, and light intensity in lux ranged from 535.67 to 705 with a mean of 641.
According to BNCRDC Technoguide, snap bean is best grown under cool climate condition. However, it can tolerate warm temperatures up to 25oC.
Days from Sowing to Emergence and Flowering
Effect of water volume. No significant differences were observed on the number of days to emergence until flowering of the three bush snap bean varieties as affected by the different volumes of water application. Different volume of water was applied after the appearances of true leaves at 13 DAP as shown in Figure 1.
Effect of varieties. Result showed that the three bush snap bean varieties uniformly emerged 8 days after sowing and flowered at 32 days from emergence.
Table 1. Agro climatic data during the study period (December, 2010 – February, 2011)
MONTH
TEMPERATURE (OC)
RELATIVE HUMIDITY
(%)
SUNLIGHT INTENSITY
MEAN (Lux)
December 22.17 77.30 705
January 20.20 79.80 682.6
February 20.17 77.00 535.67
MEAN 20.84 78.03 641.09
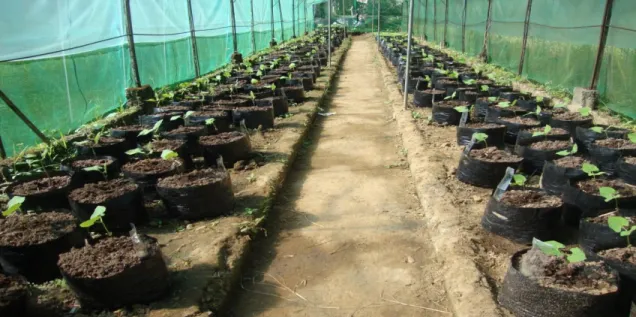
Figure 1. Bush snap bean at 13 DAP (formation of true leaf has fully appeared in the start of applying the different volumes of water)
Interaction effect. There was no significant difference observed in the days from emergence to flowering as affected by three varieties and the different volume of water.
Initial Plant Height at 30 and 60 DAP
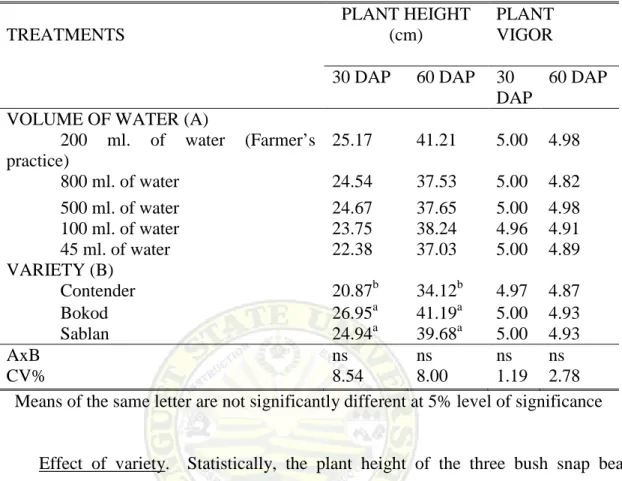
Effect of water volume. No significant differences were noted on the plant height of the three bush snap beans at 30 and 60 DAP. However, taller plants were noted in the bush snap beans varieties applied with 200 ml of water (farmer’s practice) with a height of 25.170 cm. This could be attributed to enough moisture applied to the plant for growth (Table 2).
Tisdale and Nelson (1975) stated that moisture stress causes reduction in the cell elongation, hence retarding the growth of the plant. In addition, Chapman and Carter (1976) postulated that all plants are harmed to some degree by inadequate moisture and added that under condition of drought where total plant growths or dry matter is reduced consequently reducing yield.
Table 2. Plant height at 30 DAP and 60 DAP of the three bush snap bean varieties as affected by the volume of water application
TREATMENTS
PLANT HEIGHT (cm)
PLANT VIGOR 30 DAP 60 DAP 30
DAP
60 DAP VOLUME OF WATER (A)
200 ml. of water (Farmer’s practice)
25.17 41.21 5.00 4.98
800 ml. of water 24.54 37.53 5.00 4.82
500 ml. of water 24.67 37.65 5.00 4.98
100 ml. of water 23.75 38.24 4.96 4.91
45 ml. of water 22.38 37.03 5.00 4.89
VARIETY (B)
Contender 20.87b 34.12b 4.97 4.87
Bokod 26.95a 41.19a 5.00 4.93
Sablan 24.94a 39.68a 5.00 4.93
AxB ns ns ns ns
CV% 8.54 8.00 1.19 2.78
Means of the same letter are not significantly different at 5% level of significance
Effect of variety. Statistically, the plant height of the three bush snap bean varieties was significantly different. Bokod and Sablan were taller than Contender at 30 and 60 DAP. The differences noted could be genetic in nature.
Interaction effect. Statistically, there was no significant interaction effect between the different volumes of water application on the plant height of the three bush snap bean varieties.
Plant Vigor at 30 and 60 DAP
Effect of water volume. Results showed that there were no significant differences on the plant vigor applied with the different volumes of waters at 30 and 60 DAP as shown in Table 2.
Effect of variety. Results showed that there were no significant differences among varieties. All of the varieties were observed to be highly vigorous with robust stem and the leaves are light to dark green in color.
Interaction effect. The interaction between the different volumes of water and bush snap bean varieties was observed to be not significant at 30 and 60 DAP.
Days from Emergence to Pod Setting, First, and Last Harvest
Effect of water volume. No significant differences on the volume of water application on the number of days from emergence to pod setting, days from emergence to first harvest, and days from emergence to last harvest were observed.
Effect of variety. Results showed that there were no varietal significant differences between the three bush snap bean varieties in the days from emergence to pod setting, days from emergence to first harvest, and days from emergence to last harvest.
Interaction effect. There was no significant interaction effect among the three varieties of bush snap beans and the volumes of water applications on the number of days from emergence to pod setting, and emergence to first and last harvest.
Number of Flower Cluster
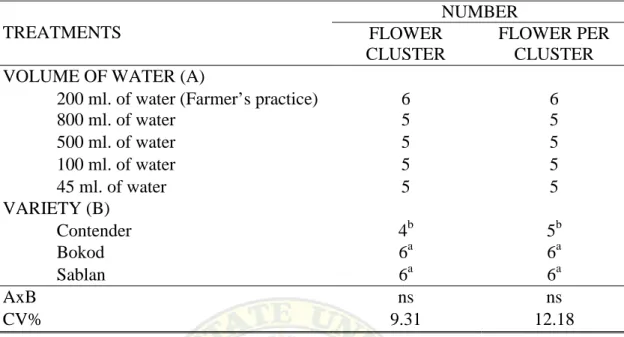
Effect of water volume. As shown in Table 3, there were no significant differences on the number of flower cluster as affected by the application of different volumes of water. All of the bush snap beans produced five flower clusters except the plants applied with 200 ml water with six.
Effect of variety. Results showed that there was a significant difference between the varieties on the number of flower cluster produced. Although, Bokod and Sablan have
Table 3. Number of flower cluster and number of flower per cluster of bush snap bean as affected by different volumes of water applied
TREATMENTS
NUMBER FLOWER
CLUSTER
FLOWER PER CLUSTER VOLUME OF WATER (A)
200 ml. of water (Farmer’s practice) 6 6
800 ml. of water 5 5
500 ml. of water 5 5
100 ml. of water 5 5
45 ml. of water 5 5
VARIETY (B)
Contender 4b 5b
Bokod 6a 6a
Sablan 6a 6a
AxB ns ns
CV% 9.31 12.18
Means of the same letter are not significantly different at 5% level of significance
six flower clusters while Contender has four flower clusters. These differences noted among the three bush snap bean varieties can be associated with their different genetic potentials. The number of flower cluster is an important factor contributing to yield of the plants. Theoretically, the more the flower cluster, the greater the yield (Singha, 1973).
Interaction effect. There was no significant interaction effect between the different volumes of water application on the three bush snap bean varieties on the number of flower cluster.
Number of Flower per Cluster
Effect of water volume. No significant differences were observed on the three varieties of bush snap beans on the number of flower per cluster even applied with different volumes of water. The application of 200 ml of water though produced six flowers per cluster while the rest of the plant produced five.
Salehi et al.,( 2008) stated that excessive abortion of flowers, young pods and seeds occurs in dry bean because of water stress during pre- flowering (10 to 12 days before anthesis) and reproductive periods.
Effect of variety. The number of flower produced per cluster is presented in Table 3. Statistically, results showed no significant varietal differences on the number of flowers produced. Means ranged from five to six flowers per cluster.
Interaction effect. There were no significant interactions between the different volumes of water application on the three varieties of bush snap beans evaluated in the production of flowers per cluster.
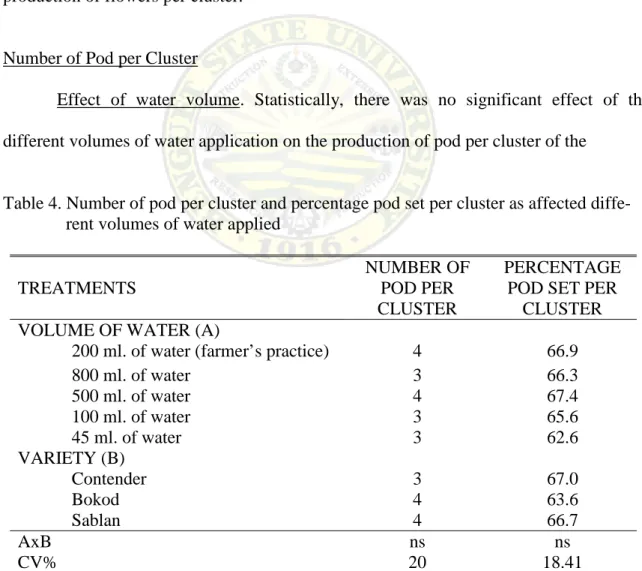
Number of Pod per Cluster
Effect of water volume. Statistically, there was no significant effect of the different volumes of water application on the production of pod per cluster of the
Table 4. Number of pod per cluster and percentage pod set per cluster as affected diffe- rent volumes of water applied
TREATMENTS
NUMBER OF POD PER CLUSTER
PERCENTAGE POD SET PER
CLUSTER VOLUME OF WATER (A)
200 ml. of water (farmer’s practice) 4 66.9
800 ml. of water 3 66.3
500 ml. of water 4 67.4
100 ml. of water 3 65.6
45 ml. of water 3 62.6
VARIETY (B)
Contender 3 67.0
Bokod 4 63.6
Sablan 4 66.7
AxB ns ns
CV% 20 18.41
Means of the same letter are not significantly different at 5% level of significance
different varieties of bush snap beans. The number of pod per cluster produced has a mean of three to four pods (Table 4).
For all crops grown for fruits and seed, Chapman and Carter (1976) stated that moisture stress before, during and immediately after flowering seems to have the greatest effect on reducing yield. In addition, high soil moisture levels during seed formation, pod striping and seed coloring will result in white- mold damage, delayed maturity and quality problems.
Effect of varieties. The different varieties used did not significantly affect the number of pods per cluster produced by the bush snap beans (Table 4). Number of pods ranged from three to four.
Interaction effect. No significant interactions were noted in terms of pod per cluster on the three varieties of bush snap bean as affected by different volumes of water applied.
Percentage Pod Set per Cluster
Effect of water volume. The different volumes of water applied did not significantly influence the percent pod setting of the different varieties. Percentage pod setting ranges from 62.6 to 67.4.
Effect of varieties. The different bush snap bean varieties used did not significantly influence the percent pod setting. Numerically, highest pod setting was recorded in Contender (67 %), followed by Sablan (66.7 %) while 63 % pod setting was observed in Bokod.
Interaction effect. No significant interactions were noted in terms of percentage per cluster on the three varieties of bush snap bean as affected by different volumes of water applied.
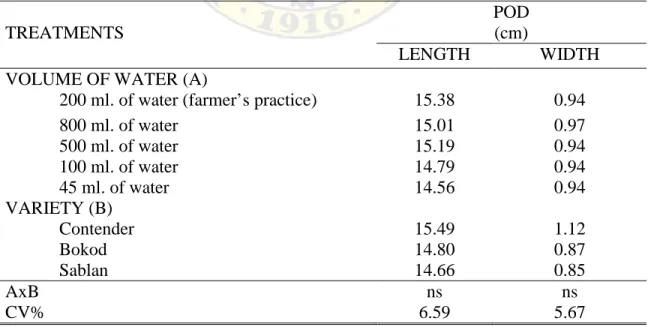
Pod Length and Width
Effect of water volume. No significant differences on the effect of the different volume of water application on the pod length and width on the different varieties of bush snap beans were observed as shown in Table 5. Pod length ranges from 14.56 to15.38 cm while pod width ranges from 0.94 to 0.97 cm.
Effect of varieties. No significant differences were also noted on the different varieties of bush snap beans in terms of length. However, in terms of pod width Contender significantly produced the widest pod of 1.12 cm, and the narrowest pod was observed in Bokod and Sablan with 0.80 and 0.85 cm, respectively.
Table 5. Pod length and width of bush snap bean as affected by volumes of water applied
Means of the same letter are not significantly different at 5% level of significance TREATMENTS
POD (cm)
LENGTH WIDTH
VOLUME OF WATER (A)
200 ml. of water (farmer’s practice) 15.38 0.94
800 ml. of water 15.01 0.97
500 ml. of water 15.19 0.94
100 ml. of water 14.79 0.94
45 ml. of water 14.56 0.94
VARIETY (B)
Contender 15.49 1.12
Bokod 14.80 0.87
Sablan 14.66 0.85
AxB ns ns
CV% 6.59 5.67
Interaction effect. No significant interaction was recorded in terms of pod length and width as affected by the bush snap bean varieties and by the different volumes of water applied.
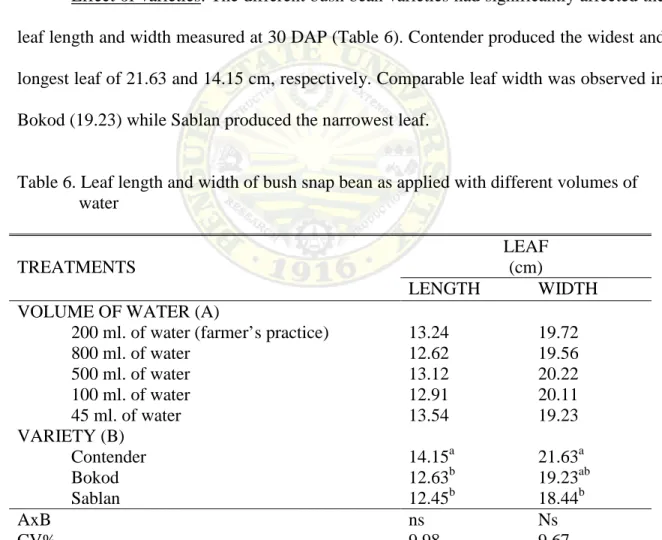
Leaf Length and Width
Effect of water volume. No significant differences were observed on the leaf length and width of the three bush snap bean varieties as affected by different volumes of water application.
Effect of varieties. The different bush bean varieties had significantly affected the leaf length and width measured at 30 DAP (Table 6). Contender produced the widest and longest leaf of 21.63 and 14.15 cm, respectively. Comparable leaf width was observed in Bokod (19.23) while Sablan produced the narrowest leaf.
Table 6. Leaf length and width of bush snap bean as applied with different volumes of water
TREATMENTS
LEAF (cm)
LENGTH WIDTH
VOLUME OF WATER (A)
200 ml. of water (farmer’s practice) 13.24 19.72
800 ml. of water 12.62 19.56
500 ml. of water 13.12 20.22
100 ml. of water 12.91 20.11
45 ml. of water 13.54 19.23
VARIETY (B)
Contender 14.15a 21.63a
Bokod 12.63b 19.23ab
Sablan 12.45b 18.44b
AxB ns Ns
CV% 9.98 9.67
Means of the same letter are not significantly different at 5% level of significance
Figure 2. Leaves of the bush snap beans starting to fold as affected with little volume of water
Crops that have wider leaf area have higher transpiration rate than of leaf that has less area. Since legumes have less leaf area with hairy leaves and have the ability to move their leaves so that only a very small leaf area is exposed to incoming radiation which reduce transpiration (AVRDC, 1990) as shown in Figure 2.
Interaction effect. No significant interaction was noted in terms of leaf length and width on the three bush snap bean varieties as affected by the different volumes of water application.
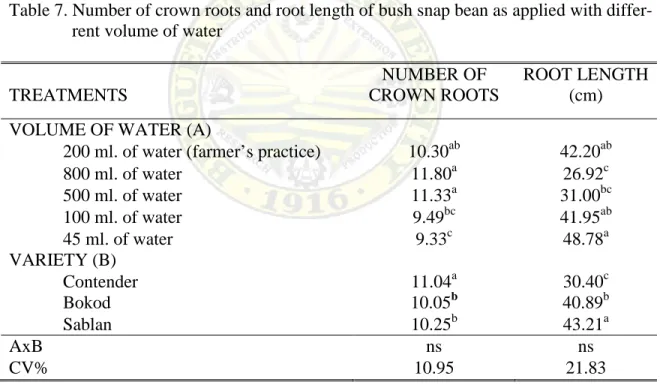
Number of Crown Roots
Effect of water volume. Statistically, result showed that there was a high significant effect of the different volumes of water applied on the number of crown roots (Table 7). The application of 800 ml of water gave the highest number of crown roots with 12, comparable with the application of 500 and 200 ml of water with 11 and 10 number of crown roots, respectively. The least number of crown roots was observed on plants applied with 45 ml of water. With a high moisture soil plant should produce more
roots for survival and well developed aerenchyma (Buchanan, Gruissem and Jones, 2000).
Effect of variety. As shown in Table 7, Contender significantly displayed the highest number of crown roots, while Bokod and Sablan produced ten crown roots. The differences noted could be genetic in nature. Crops that have more roots are more resistant to drought and can tolerate moist soils (AVRDC, 1990).
Interaction effect. No significant interaction was noted in terms of number of crown roots on the three varieties of bush snap bean as affected by the different volume of water application.
Table 7. Number of crown roots and root length of bush snap bean as applied with differ- rent volume of water
TREATMENTS
NUMBER OF CROWN ROOTS
ROOT LENGTH (cm) VOLUME OF WATER (A)
200 ml. of water (farmer’s practice) 10.30ab 42.20ab
800 ml. of water 11.80a 26.92c
500 ml. of water 11.33a 31.00bc
100 ml. of water 9.49bc 41.95ab
45 ml. of water 9.33c 48.78a
VARIETY (B)
Contender 11.04a 30.40c
Bokod 10.05b 40.89b
Sablan 10.25b 43.21a
AxB ns ns
CV% 10.95 21.83
Means of the same letter are not significantly different at 5% level of plants
Root Length
Effect of water volume. Result showed that there was a significant effect of the different volumes of water applied on the root length as shown in Table 7. The application of 45ml water produced the longest root of 48.78 cm followed by the significanceapplication of 200 ml and 100 ml of water. The shortest root was recorded on applied with 800 ml of water. Observation showed that high volumes of water produce shorter roots while low volumes of water has longer root. In area where there is a deficit of water the root of the plant should grow longer to absorb water from the lower depths while, excess water can also reduced root development and development of adventitious roots (AVRDC, 1990)
Effect of variety. Significant differences were obtained on the root length as shown in Table 7 and Figure 3. Sablan was noted to produce the longest roots of 43.21 cm while Contender produced the shortest root length of 30.40 cm. Plant that has longer rooting system can absorb water from the lower depths (AVRDC, 1990).
Interaction effect. No significant interaction effect was noted in terms of root length on the three varieties of bush snap bean as affected by the different volumes of water applied.
Reaction to Bean Rust and Pod Borer
The three varieties applied with different volumes of water showed mild resistance to bean rust which means 1 to 25 % of the total plants are infected. Resistance to bean rust plays an important role in bush snap bean production because infection could affect the photosynthetic activity of the plant. While the reaction of bush snap beans to
CONTENDER
BOKOD
SABLAN
To- 200 ml of water T1- 800 ml of water T2- 500 ml of water T3- 100 ml of water T4- 45 ml of water Figure 3. Roots of different bush snap bean varieties as affected with the different
volumes of water
To- 200 ml of water T1- 800 ml of water T2- 500 ml of water T3- 100 ml of water T4- 45 ml of water
To- 200 ml of water T1- 800 ml of water T2- 500 ml of water T3- 100 ml of water T4- 45 ml of water
pod borer as monitored at 60 DAP showed that the three varieties of bush snap bean were highly resistant to pod borer regardless of the different volumes of water applied.
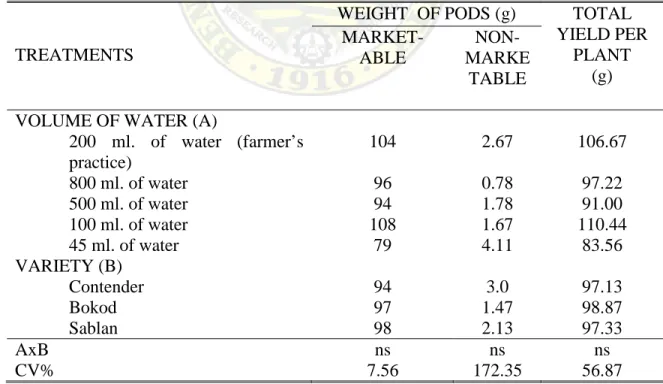
Weight of Marketable Fresh Pods
Effect of water volume. No significant differences were observed on the weight of marketable fresh pods as affected by the different volume of water applied on the three varieties. Numerically, application of 200 ml of water or the farmers practice yield higher pods (104 gram) per plant while the lowest marketable pods were recorded in plants applied with 45 ml of water. Lack and excess soil moisture content can affect the biomass yield of the crops (Buchanan et al., 2000).
Effect of variety. There were also no significant differences among the three varieties as observed in terms of marketable weight of fresh pods. Bokod and Sablan produced more marketable pods in terms of weight while Contender produced the least.
Interaction effect. No significant interaction was noted in terms of marketable weight of fresh pods on the three varieties as affected by different volumes of water applied.
Non- Marketable Weight of Fresh Pods
Effect of water volume. There were no significant differences in the different volumes of water applied in terms of non- marketable weight of fresh pods.
Effect of variety. The production of non-marketable fresh pods was not significant among the varieties of bush snap beans as shown in Table 8.Non- marketable pod weight ranges from 1.67 to 2.67 g. This is due to protected environment where there is least pest infestation.
Interaction effect. No significant interaction was noted in terms of the production of non- marketable weight of fresh pods on the three varieties of bush snap bean as affected by the different volumes of water applied.
Total Yield Per Plant
Effect of water volume. Table 8 showed that numerically the application of 100 ml of water produce the highest total yield per plant of 110.44 g, followed by the application of 200 ml of water (166.67 g). The lowest total yield per plant was noted on plants applied with 45 ml of water with 83.56 of fresh pods produced. As mentioned earlier, the differences could be attributed to their flower cluster as detected by their genetic make up.
Table 8. Weight of marketable pods, non- marketable and total yield per plant of three bush snap bean as applied with different volumes of water.
TREATMENTS
WEIGHT OF PODS (g) TOTAL YIELD PER
PLANT (g) MARKET-
ABLE
NON- MARKE
TABLE VOLUME OF WATER (A)
200 ml. of water (farmer’s practice)
104 2.67 106.67
800 ml. of water 96 0.78 97.22
500 ml. of water 94 1.78 91.00
100 ml. of water 108 1.67 110.44
45 ml. of water 79 4.11 83.56
VARIETY (B)
Contender 94 3.0 97.13
Bokod 97 1.47 98.87
Sablan 98 2.13 97.33
AxB ns ns ns
CV% 7.56 172.35 56.87
Means of the same letter are not significantly different at 5% level of significance
CONTENDER
TO- 200 ml of water T1- 800 ml of water T2- 500 ml of water T3- 100 ml of water T4- 45 ml of water
BOKOD
SABLAN
TO- 200 ml of water T1- 800 ml of water T2- 500 ml of water T3- 100 ml of water T4- 45 ml of water
Figure 4. Pods of the three bush snap bean as affected by different volumes of water applied
TO- 200 ml of water T1- 800 ml of water T2- 500 ml of water T3- 100 ml of water T4- 45 ml of water
Effect of variety. The production of total yield per plant was not significant among the varieties of bush snap beans as shown in Table 8. Total yield ranges from 97.13g to 97.87 g. This is due to protected environment where there is least pest infestation as shown in Figure 4.
Interaction effect. No significant interaction was noted in terms of total yield per plant on the three varieties of bush snap bean as affected by the different volumes of water.
SUMMARY, CONCLUSIONS AND RECOMMENDATIONS
Summary
Evaluation of bush snap bean varieties applied with different volumes of water was conducted at La Trinidad, Benguet in a greenhouse condition from December 2010 to February 2011. The objectives of the study were to determine the growth and yield of the different bush snap bean variety\ies applied with different volumes of water;
determine the best water requirements for bush snap bean production; and determine the interaction effect of variety and the volumes of water on the growth and yield of bush snap bean.
Among the three varieties of bush snap bean, Sablan and Bokod have the tallest plant height at 30 and 60 DAP, produced more flower clusters, more pods per cluster while Contender had the widest leaf area, highest percentage pod set per cluster, widest pod, longest pod, and more crown roots. On the other hand, Sablan had the longest roots and Bokod had the highest total yield per plant.
The different volumes of water significantly affected the number of crown roots and length of the roots of the different bush snap bean varieties.
No significant differences were noted in all the parameters gathered as affected by the bush snap bean varieties and the application of different volume of water.
Conclusions
Sablan variety was the best performing as it produced the tallest plants, longest roots and highest yield. Contender produced the longest and widest leaf but the shortest root.
The application of different volumes of water does not significantly affect the growth and yield of all the bush bean varieties. The volume of water applied by farmers though produced the highest yield. Lowest yield was obtained from bush beans applied with the least amount of water.
The application of different volumes of water did not affect the growth and yield of the different varieties of bush beans
Recommendations
Sablan variety is recommended for production even under different levels of water in a green house. Likewise, application of 200 ml or the farmer’s practice of water is still recommended to irrigate the bush snap bean varieties under protected environment.
Further evaluation is recommended to verify the results of the study under open field.
LITERATURE CITED
ASIAN VEGETABLE RESEARCH DEVELOMPMENT CENTER (AVRDC). 1990.
Vegetable Production Training Manual. Taiwan: AVRDC. Pp.128-130.
BAWANG, F.T. 1990. The Effect of Moisture Stress on the Growth and Yield of White Potato. La Trinidad: Depth News Phillipines. P. 259.
BSU-ISRD (BENGUET STATE UNIVERSITY- INSTITUTE OF SOCIAL RESEARCH and DEVELOPMENT) and FAO.Undated. Climate Change: Vulnerability and Adaptation Capacity Assessment in Benguet (Socio-economic Component). La Trinidad: BSU-ISRD, FAO, SPICACC, MDGF. 2 pages.
BUCHANAN, B. B., GRUISSEM, W. and R. L. JONES. 2000. Biochemistry and Molecular Biology of Plants. American Society of Plant Physiologist. Pp.
301-308.
CATIPON, E.M., B.M. LEGASPI and F.A. JARILL. 1988. Development of Mung Bean Varieties from Avrdc Line for the Phillipines. In: Mung Bean, Shan Magasundara, S. and B.T. MCLEAN (Eds.). Proceeding of the 2nd Int. Symp. Taiwan: AVRDC.
Pp. 88-97.
CHAPMAN, S.R. and L.P. CARTER. 1976. Crop Production: Principles and Practices.
San Francisco: W.H. Freeman and Company. Pp. 128-130.
JOSE, M. C. 2004.Notes in Legume Production. La Trinidad, Benguet. 2 pages.
KRAMER, D. J. 1969. Plant and Soil Water Relationship. A Modern Synthesis. USA:
Tata MC Graw Hill Publishing., Ltd. Pp. 347-390.
KRAMER, D. J. 1993. Water Stress Physiology and Plant Growth in: Agronomy Journal. Pp. 31-35.
MAITI, R.1997. Phaseoulos spp. Bean Science. USA: Science Publisher. P. 15.
MARIANO, P.M. 2007. Bureau of Plant Industry, Baguio National Crop Research and Development Center (BNCRDC) Technoguide, Series no. 03-07, Snap Bean.
Baguio City: BNCRDC. P. 1.
NELSON, W.L. and NIELSEN. 1998. Physiological Performance, Yield, and, Quality of Dry Bean Seeds Under Drougth Stress. Retrieved on December 12, 2010 from http://www.Uaemix.mx/pdf/339/33913147012.pdf Ma.Vandia.
PASSIOURA, J.B., 2002. Soil Conditions and Plant Growth. Retrieved on November 06, 2010 from http://www.Online library.wiley.com./doio/10.1046/j.0016- 8025.2001.x/full.
PENDLETON, J. W. and T. L. LAWSON. 1987. Climate and Food Security: Papers Presented at the International Symposium on Climate Variability and Food Security in Developing Countries 5- 9. Retrieved on November 06, 2010 from http://www.books .O2bPK22GYC&pg=PA68&lpg=PA68&dq=pendleton,+j .+w.+ lawson&source=bl&ots=zgMljuPVCr&sig=i7Cz3N8pVA2V5MRJ -ljrq H Q&hl=en&ei=94VTTbWjGcmPcYax5aQG&sa=X&oi=book_result&ct=result&r esnum=4&ved=0CDcQ6AEwAw#v=onepage&q=pendleton%2C%20j. %20 w. %20and%20t.l.%20la wson&f=false
SALEHI, M., A. HAGHNAZARI and F. SHEKARI, 2006. The Study of Morpho- physiological Traits of Lentil (Lens culinaris Medik) Relation with Grain Yield Under Normal and Drought Stress Conditions. Retrieved on December 04, 2010 from 2010 at http://www.google.com.ph/#hl=en&biw= 1366&bih=
543&q=salehi %2C+m.+a.+haghnazari+and+f+shekari+ 2006&aq
=f&aqi =&aql=&oq=&fp= ba94db5dd3c30688.
SINGHA, S. K. 1973. Yield of Grain Legumes; Problems and Prospects. India: Indian Journal of Genetics. P. 5.
SIGHN, K.B., and M.C. SAXENA, 1990. Studies on Drought Tolerance. Syria:
ICARDA. Pp. 15-17.
TISDALE, S.C. and W.L. NELSON. 1975. Soil Fertility and Fertilizers. New York: Mac Millan Publishing Company Inc. Pp. 29-30.
APPENDICES
Appendix Table 1. Number of days from sowing to emergence
TREATMENT
REPLICATION
TOTAL MEAN
I II III
TOV1 8 8 8 24 8
V2 8 8 8 24 8
V3 8 8 8 24 8
Sub- total 24 24 24 72 8
T1V1 8 8 8 24 8
V2 8 8 8 24 8
V3 8 8 8 24 8
Sub- total 24 24 24 72 8
T2V1 8 8 8 24 8
V2 8 8 8 24 8
V3 8 8 8 24 8
Sub-total 24 24 24 72 8
T3V1 8 8 8 24 8
V2 8 8 8 24 8
V3 8 8 8 24 8
Sub- total 24 24 24 72 8
T4V1 8 8 8 24 8
V2 8 8 8 24 8
V3 8 8 8 24 8
Sub- total 24 24 24 72 8
Appendix Table 2. Initial plant height of bush snap beans at 30 DAP
TREATMENT
REPLICATION
TOTAL MEAN
I II III
TOV1 20.96 24.68 22.92 68.56 22.85
V2 27.87 27.32 28.86 84.05 28.02
V3 24.56 25.24 24.52 74.32 24.77
Sub- total 73.39 77.24 76.3 226.93 24.21
T1V1 21.82 21.42 20.04 63.28 21.09
V2 30.74 27.26 26.44 84.44 28.15
V3 24.78 23.62 24.74 73.14 24.38
Sub- total 77.34 72.3 71.22 220.86 24.54
T2V1 23.56 20.36 23.62 67.54 22.51
V2 26.00 27.36 27.56 80.92 26.97
V3 25.8 23.6 24.12 73.52 24.51
Sub- total 73.63 71.32 75.3 220.25 24.47
T3V1 22.61 19.66 19.38 61.65 20.55
V2 26.5 25.95 27.1 79.55 26.52
V3 24.84 23.42 24.26 72.52 24.17
Sub- total 73.95 69.03 70.74 213.72 23.75
T4V1 21.78 19.34 20.26 61.38 20.26
V2 27.2 23 25.06 75.26 25.09
V3 25.32 23.5 25 73.82 24.61
Sub- total 74.3 65.84 70.32 210.46 23.38
TWO WAY TABLE
DIFFERENT VOLUMES OF WATER
VARIETY
TOTAL MEAN
CONTENDER BOKOD SABLAN
200 ml 68.56 84.05 74.32 226.93 75.64
800 ml 63.28 84.44 73.14 220.86 73.62
500 ml 67.54 80.92 73.52 220.25 73.42
100ml 61.65 79.55 72.52 213.72 71.24
45 ml 61.38 75.26 73.82 210.46 70.15
TOTAL 322.41 404.22 367.32 1093.95 364.07
MEAN 64.84 80.84 73.46 219.14 72.81
ANALYSIS OF VARIANCE
SOURCE VARIANCE
DEGREE OF FREEDOM
SUM OF SQUARES
MEAN OF SQUARES
COMPUTED F
TABULAR F 0.05 0.01
Treatment 14 26.589 13.295 7.04** 2.04 2.74
Factor A 4 42.594 10.648 2.51ns 2.69 4.02
Factor B 2 280.723 140.362 33.13** 3.32 5.39
A x B 8 30.430 3.804 0.90ns 2.27 3.17
Error 30 127.080 4.236
TOTAL 44 480.827
**- Highly significant Coefficient of variation=8.54%
ns- not significant
Appendix Table 3. Final plant height of bush snap beans at 60 DAP
TREATMENT
REPLICATION
TOTAL MEAN
I II III
TOV1 35.38 36.76 35.2 107.34 35.78
V2 41.68 42.04 50.42 134.14 44.71
V3 40.88 46.32 42.26 129.46 43.15
Sub- total 117.94 125.12 127.88 370.94 41.22
T1V1 36.3 35.16 34.6 106.06 35.35
V2 44.3 43.32 33.2 120.82 40.27
V3 36.88 34.6 39.44 110.95 36.97
Sub- total 117.48 113.08 107.24 337.8 37.53
T2V1 36.9 32.08 32.66 101.64 33.88
V2 37.82 40.84 40.2 118.86 39.62
V3 42.9 37.82 37.6 118.32 39.44
Sub- total 117.62 110.74 110.46 338.82 37.65
T3V1 32.34 36.58 32.5 101.42 33.81
V2 41.5 44 42.76 128.26 42.75
V3 38.56 35.44 40.46 114.46 38.15
Sub- total 112.4 116.02 115.72 344.14 38.24
T4V1 30.1 32.54 32.74 95.38 31.79
V2 38.34 37.72 39.74 115.8 38.6
V3 46.3 35.8 40 122.1 40.7
Sub- total 114.74 106.06 112.48 333.28 37.03
TWO WAY TABLE
DIFFERENT VOLUMES OF WATER
VARIETY
TOTAL MEAN
CONTENDER BOKOD SABLAN
200 ml 107.34 134.14 129.46 370.94 123.65
800 ml 106.06 120.82 110.95 337.8 112.6
500 ml 101.64 118.86 118.32 338.82 112.94
100ml 101.42 128.26 114.46 344.14 114.71
45 ml 95.38 115.8 122.1 333.28 111.09
TOTAL 511.84 617.88 595.29 1724.98 574.99
MEAN 102.37 123.58 118.01 343.96 114.10
ANALYSIS OF VARIANCE
SOURCE VARIANCE
DEGREE OF FREEDOM
SUM OF SQUARES
MEAN OF SQUARES
COMPUTED F
TABULAR F 0.05 0.01
Treatment 14 588.497 42.035 5.0** 2.04 2.74
Factor A 4 100.113 25.028 2.66ns 2.69 4.02
Factor B 2 415.890 207.945 2.13** 3.32 5.39
A x B 8 72.494 9.062 0.96ns 2.27 3.17
Error 30 281.861 9.395
TOTAL 44 870.358
**- Highly significant Coefficient of variation=8.00%
ns- not significant
Appendix Table 4. Plant vigor of bush snap beans at 30 DAP
TREATMENT
REPLICATION
TOTAL MEAN
I II III
TOV1 5 5 5 15 5
V2 5 5 5 15 5
V3 5 5 5 15 5
Sub- total 15 15 15 45 5
T1V1 5 5 5 15 5
V2 5 5 5 15 5
V3 5 5 5 15 5
Sub- total 5 5 5 45 5
T2V1 5 5 5 15 5
V2 5 5 5 15 5
V3 5 5 5 15 5
Sub- total 15 15 15 45 5
T3V1 5 5 5 15 5
V2 5 5 5 15 5
V3 5 5 5 15 5
Sub- total 15 15 15 45 5
T4V1 5 5 5 15 5
V2 5 5 5 15 5
V3 5 5 5 15 5
Sub- total 15 15 15 45 5
Appendix Table 5. Plant vigor of bush snap beans at 60 DAP
TREATMENT
REPLICATION
TOTAL MEAN
I II III
TOV1 5 5 5 15 5
V2 4.8 5 5 14.8 4.93
V3 5 5 5 15 5
Sub- total 14.8 15 15 44.8 4.98
T1V1 4.8 5 4.6 14.4 4.8
V2 5 4.6 5 14.6 4.86
V3 4.8 4.6 5 14.4 4.8
Sub- total 14.6 14.2 14.6 43.4 4.82
T2V1 5 5 4.8 14.8 4.93
V2 5 5 5 15 5
V3 5 5 5 15 5
Sub- total 15 15 14.8 44.8 4.98
T3V1 4.8 4.6 5 14.4 4.8
V2 4.8 5 5 14.8 4.93
V3 5 5 5 5 5
Sub- total 14.6 14.6 15 44.2 4.91
T4V1 5 4.6 4.8 14.4 4.8
V2 4.8 5 5 14.8 4.93
V3 5 5 4.8 14.8 4.93
Sub- total 14.8 14.6 14.6 44 4.89
TWO WAY TABLE
DIFFERENT VOLUMES OF WATER
VARIETY
TOTAL MEAN
CONTENDER BOKOD SABLAN
200 ml 15 14.8 15 44.8 14.93
800 ml 14.4 14.6 14.4 43.4 14.47
500 ml 14.8 15 15 44.8 14.93
100ml 14.4 14.8 15 44.2 14.73
45 ml 14.4 14.8 14.8 44 14.67
TOTAL 73 74 74.2 221.2 73.73
MEAN 24.33 24.67 24.73 73.73 14.75
ANALYSIS OF VARIANCE
SOURCE VARIANCE
DEGREE OF FREEDOM
SUM OF SQUARES
MEAN OF SQUARES
COMPUTED F
TABULAR F 0.05 0.01
Treatment 14 0.50 0.004 1.0ns 2.04 2.74
Factor A 4 0.014 0.004 1.0ns 2.69 4.02
Factor B 2 0.007 0.004 1.0ns 3.32 5.39
A x B 8 0.028 0.004 1.0ns 2.27 3.17
Error 30 0.107 0.004
TOTAL 44 0.156
ns- not significant Coefficient of variation=8.00%
Appendix Table 6. Days from emergence to flowering
TREATMENT
REPLICATION
TOTAL MEAN
I II III
TOV1 32 32 32 96 32
V2 32 32 32 96 32
V3 32 32 32 96 32
Sub- total 96 96 96 288 32
T1V1 32 32 32 96 32
V2 32 32 32 96 32
V3 32 32 32 96 32
Sub- total 96 96 96 288 32
T2V1 32 32 32 96 32
V2 32 32 32 96 32
V3 32 32 32 96 32
Sub- total 96 96 96 288 32
T3V1 32 32 32 96 32
V2 32 32 32 96 32
V3 32 32 32 96 32
Sub- total 96 96 96 288 32
T4V1 32 32 32 96 32
V2 32 32 32 96 32
V3 32 32 32 96 32
Sub- total 96 96 96 288 32
Appendix Table 7. Days from flowering to pod setting
TREATMENT
REPLICATION
TOTAL MEAN
I II III
TOV1 7 7 7 21 7
V2 7 7 7 21 7
V3 7 7 7 21 7
Sub- total 21 21 21 63 7
T1V1 7 7 7 21 7
V2 7 7 7 21 7
V3 7 7 7 21 7
Sub- total 21 21 21 63 7
T2V1 7 7 7 21 7
V2 7 7 7 21 7
V3 7 7 7 21 7
Sub- total 21 21 21 63 7
T3V1 7 7 7 21 7
V2 7 7 7 21 7
V3 7 7 7 21 7
Sub- total 21 21 21 63 7
T4V1 7 7 7 21 7
V2 7 7 7 21 7
V3 7 7 7 21 7
Sub- total 21 21 21 63 7
Appendix Table 8. Days from emergence to first harvest
TREATMENT
REPLICATION
TOTAL MEAN
I II III
TOV1 56 56 56 168 56
V2 56 56 56 168 56
V3 56 56 56 168 56
Sub- total 168 168 168 504 56
T1V1 56 56 56 168 56
V2 56 56 56 168 56
V3 56 56 56 168 56
Sub- total 168 168 168 504 56
T2V1 56 56 56 168 56
V2 56 56 56 168 56
V3 56 56 56 168 56
Sub- total 168 168 168 504 56
T3V1 56 56 56 168 56
V2 56 56 56 168 56
V3 56 56 56 168 56
Sub- total 168 168 168 504 56
T4V1 56 56 56 168 56
V2 56 56 56 168 56
V3 56 56 56 168 56
Sub- total 168 168 168 504 56
Appendix Table 9. Days from emergence to last harvest
TREATMENT
REPLICATION
TOTAL MEAN
I II III
TOV1 66 66 66 198 66
V2 66 66 66 198 66
V3 66 66 66 198 66
Sub- total 198 198 198 594 66
T1V1 66 66 66 198 66
V2 66 66 66 198 66
V3 66 66 66 198 66
Sub- total 198 198 198 594 66
T2V1 66 66 66 198 66
V2 66 66 66 198 66
V3 66 66 66 198 66
Sub- total 198 198 198 594 66
T3V1 66 66 66 198 66
V2 66 66 66 198 66
V3 66 66 66 198 66
Sub- total 198 198 198 594 66
T4V1 66 66 66 198 66
V2 66 66 66 198 66
V3 66 66 66 198 66
Sub- total 198 198 198 594 66
Appendix Table 10. Number of flower cluster per plant
TREATMENT
REPLICATION
TOTAL MEAN
I II III
TOV1 5 4 5 14 4.67
V2 6 6 6 18 6.00
V3 6 6 6 18 6.00
Sub- total 17 16 17 50 5.56
T1V1 4 5 5 14 4.67
V2 5 6 5 16 5.33
V3 5 5 6 16 5.33
Sub- total 14 16 16 46 5.11
T2V1 5 5 5 15 5.00
V2 6 5 6 17 5.67
V3 5 6 5 16 5.33
Sub- total 16 16 16 48 5.33
T3V1 5 4 5 14 4.67
V2 6 5 6 17 5.67
V3 5 6 5 16 5.33
Sub- total 16 15 16 47 5.22
T4V1 5 5 5 15 5.00
V2 6 6 5 17 5.67
V3 5 5 6 16 5.33
Sub- total 16 16 16 48 5.33
TWO WAY TABLE
DIFFERENT VOLUMES OF WATER
VARIETY
TOTAL MEAN
CONTENDER BOKOD SABLAN
200 ml 14 18 18 50 16.67
800 ml 14 16 16 46 15.33
500 ml 15 17 16 48 16.00
100ml 14 17 16 47 15.67
45 ml 15 17 16 48 16.00
TOTAL 72 85 82 239 79.67
MEAN 24 28.33 27.33 79.66 15.93
ANALYSIS OF VARIANCE
SOURCE VARIANCE
DEGREE OF FREEDOM
SUM OF SQUARES
MEAN OF SQUARES
COMPUTED F
TABULAR F 0.05 0.01
Treatment 14 8.311 0.594 2.32* 2.04 2.74
Factor A 4 0.978 0.244 1.0ns 2.69 4.02
Factor B 2 6.178 3.089 12.64** 3.32 5.39
A x B 8 1.156 0.144 0.59ns 2.27 3.17
Error 30 7.333 0.244
TOTAL 44 15.644
*- significant Coefficient of variation=9.31%
ns- not significant
**-Highly significant
Appendix Table 11. Number of flower per clusters
TREATMENT
REPLICATION
TOTAL MEAN
I II III
TOV1 5 5 5 15 5
V2 5 7 6 18 6
V3 5 6 7 18 6
Sub- total 15 18 18 51 5.67
T1V1 6 5 4 15 3
V2 5 6 5 16 5.33
V3 5 5 6 16 5.33
Sub- total 16 16 15 47 5.22
T2V1 5 5 5 15 5
V2 6 5 6 17 5.67
V3 5 6 5 16 5.33
Sub- total 16 16 16 48 5.33
T3V1 4 5 5 14 4.67
V2 6 5 6 17 5.67
V3 5 6 5 16 5.33
Sub- total 15 16 16 47 5.22
T4V1 5 5 4 14 4.67
V2 5 6 5 16 5.33
V3 6 5 6 17 5.67
Sub- total 16 16 15 47 5.22
TWO WAY TABLE
DIFFERENT VOLUMES OF WATER
VARIETY
TOTAL MEAN
CONTENDER BOKOD SABLAN
200 ml 15 18 18 51 17.00
800 ml 15 16 16 47 15.67
500 ml 15 17 16 48 16.00
100ml 14 17 16 47 15.67
45 ml 14 16 17 47 15.67
TOTAL 73 84 83 240 80.01
MEAN 24.33 28 26.67 79 16.12
ANALYSIS OF VARIANCE
SOURCE VARIANCE
DEGREE OF FREEDOM
SUM OF SQUARES
MEAN OF SQUARES
COMPUTED F
TABULAR F 0.05 0.01
Treatment 14 7.333 0.540 1.21ns 2.04 2.74
Factor A 4 1.333 0.333 0.79ns 2.04 2.74
Factor B 2 4.933 2.467 5.84** 2.69 4.02
A x B 8 1.067 0.133 0.32ns 3.32 3.17
Error 30 12.667 0.422
TOTAL 44 20.000
** Highly significant Coefficient of variation=12.18%
ns- not significant
Appendix Table 12. Number of pod per cluster
TREATMENT
REPLICATION
TOTAL MEAN
I II III
TOV1 4 3 4 11 3.67
V2 4 4 3 11 3.67
V3 4 3 4 11 3.67
Sub- total 12 10 11 33 3.67
T1V1 4 4 2 10 3.33
V2 3 4 4 11 3.67
V3 3 4 3 10 3.33
Sub- total 10 12 10 32 3.56
T2V1 3 4 3 10 3.33
V2 4 3 4 11 3.67
V3 3 4 4 11 3.67
Sub- total 10 11 11 32 3.56
T3V1 3 2 4 9 3.00
V2 4 3 4 11 3.67
V3 4 4 3 11 3.67
Sub- total 11 9 11 31 3.44
T4V1 4 3 2 9 3.00
V2 4 3 3 10 3.33
V3 4 3 4 11 3.67
Sub- total 12 9 9 30 3.33
TWO WAY TABLE
DIFFERENT VOLUMES OF WATER
VARIETY
TOTAL MEAN
CONTENDER BOKOD SABLAN
200 ml 11 11 11 33 11.00
800 ml 10 11 10 32 10.67
500 ml 10 11 11 32 10.67
100ml 9 11 11 31 10.33
45 ml 9 10 11 30 10.00
TOTAL 49 54 54 158 52.67
MEAN 16.33 18 18 52.33 10.53
ANALYSIS OF VARIANCE
SOURCE VARIANCE
DEGREE OF FREEDOM
SUM OF SQUARES
MEAN OF SQUARES
COMPUTED F
TABULAR F 0.05 0.01
Treatment 14 2.578 0.184 0.37ns 2.04 2.74
Factor A 4 0.578 0.144 0.30ns 2.69 4.02
Factor B 2 1.111 0.556 1.13ns 3.32 5.39
A x B 8 0.889 0.111 0.22ns 2.27 3.17
Error 30 14.667 0.489
TOTAL 44 17.244
ns- not significant Coefficient of variation=9.31%
Appendix Table 13. Percentage pod set per clusters
TREATMENT
REPLICATION
TOTAL MEAN
I II III
TOV1 80 75 80 235 78.33
V2 66.67 66.67 50 183.34 61.11
V3 66.67 50 66.67 183.34 61.11
Sub- total 213.34 191.67 196.67 601.68 66.85
T1V1 80 80 40 200 66.67
V2 60 66.67 80 206.67 68.89
V3 60 80 50 190 63.33
Sub- total 200 226.67 170 596.67 66.30
T2V1 60 80 60 200 66.67
V2 66.67 60 66067 193.34 64.45
V3 66.67 66.67 80 213.34 71.11
Sub- total 193.34 206.67 206.67 606.68 67.41
T3V1 60 50 80 190 63.33
V2 66.67 60 66.67 193.34 64.45
V3 80 66.67 60 206.67 68.89
Sub- total 206.67 176.67 206.67 590.01 65.56
T4V1 80 60 40 180 60
V2 66.67 50 60 176.67 58.89
V3 80 60 66.67 206.67 68.89
Sub- total 226.67 170 166.67 563.34 62.59
TWO WAY TABLE
DIFFERENT VOLUMES OF WATER
VARIETY
TOTAL MEAN
CONTENDER BOKOD SABLAN
200 ml 235 183.34 183.34 601.68 200.56
800 ml 200 206.67 190 596.67 198.89
500 ml 200 193.34 213.34 606.68 202.23
100ml 190 193.34 206.67 590.01 196.67
45 ml 180 176.67 206.67 563.34 187.78
TOTAL 1005 953.36 1000.02 2958.38 986.13
MEAN 201 190.6 200 590.6 197.226
ANALYSIS OF VARIANCE
SOURCE VARIANCE
DEGREE OF FREEDOM
SUM OF SQUARES
MEAN OF SQUARES
COMPUTED F
TABULAR F 0.05 0.01
Treatment 14 1069.684 76.406 0.52ns 2.04 2.74
Factor A 4 128.427 32.107 0.22ns 2.69 4.02
Factor B 2 108.192 54.096 0.37ns 3.32 5.39
A x B 8 833.065 104.133 0.71ns 2.27 3.17
Error 30 4394.600 146.487
TOTAL 44 5464.284
ns- not significant Coefficient of variation=18.41%
Appendix Table 14. Pod length
TREATMENT
REPLICATION
TOTAL MEAN
I II III
TOV1 16.8 15.42 15.56 47.78 15.93
V2 16.36 14.1 15.4 45.86 15.23
V3 14.88 14.58 15.34 44.8 14.93
Sub- total 48.04 44.1 46.3 138.44 15.38
T1V1 15.72 14.7 16.18 46.6 15.53
V2 14.02 16.98 13.82 44.82 14.94
V3 15.82 13.7 14.14 43.66 14.55
Sub- total 45.56 45.38 44.14 135.08 15.01
T2V1 16.42 15.68 15.04 47.14 15.71
V2 14.82 14.08 15.82 44.72 14.91
V3 14.98 15.96 13.94 44.88 14.96
Sub- total 46.22 45.72 44.6 136.54 15.17
T3V1 15.06 15.12 15.7 45.88 15.29
V2 15.64 13.72 14.02 43.38 14.46
V3 16.34 13.28 14.22 43.84 14.61
Sub- total 47.04 42.12 43.94 133.1 14.79
T4V1 14.96 14.76 15.3 45.02 15.01
V2 14.96 13.4 14.86 43.22 14.41
V3 13.98 15.32 13.46 42.76 14.25
Sub- total 43.9 43.48 43.62 131 14.56