BIBLIOGRAPHY
URBANO, RONILLO R. APRIL 2008. Evaluation of High Yielding Varieties of Rice Under Bugayong, Binalonan Pnagasinan Condition. Benguet State University, La Trinidad, Benguet.
Adviser: Danilo P. Padua, Ph. D.
ABSTRACT
Seven different varieties of rice namely: PSB Rc 14 (Rio grande), PSB Rc 18 (Ala), PSB Rc 82 (Peñaronda), NSIC Rc 130 (Tubigan 3), NSIC Rc 138 (Tubigan 5) and PSB Rc 28 ( check variety) were evaluated to test the performance of high yielding rice varieties in terms of its growth, grain yield and resistance to pests and diseases and which variety is best suited under Bugayong, Binalonan Pangasinan from October 2007 to February 2008.
Among the different varieties evaluated, NSIC Rc 138 and NSIC Rc 130 recorded the highest number of productive tillers, number of grains per panicle, total plant weight, highest grain yield (2066.66 kg) and (1960.42 kg), respectively and resistance to pests and diseases. Both varieties exhibited the highest return on cash expenses (ROCE) with 69.5% and 60.83% respectively.
Other varieties evaluated are not well adapted and accepted due to their short statue, low grain yield and having characteristics of shattering.
NSIC Rc 138 and NSIC Rc 130, therefore, are highly recommended under Bugayong, Binalonan Pangasinan.
Page
Bibliography……… i
Abstract ………………… i
Table of Contents ……… ii
INTRODUCTION ……… 1
REVIEW OF LITERATURE ………... 3
MATERIALS AND METHODS ……… 8
RESULTS AND DISCUSSION ………. 14
Height of Seedling Before Transplanting ………... ………. 14
Number of Days from Transplanting to Tillering ……… 14
Number of Tillers at Maximum Tillering Stage ……….. 15
Number of Productive Tillers Per Hill ………. 16
Number of Days from Transplanting to Booting ………. 17
Number of Days from Booting to Heading ………. 17
Number of Days from Transplanting to Heading ………...……… 18
Number of Days from Heading t o Ripening ……….……... 19
Final Height at Harvest ……… 19
Length of Panicle at Harvest ……… 20
Number of Grains per Panicle ……….. 20
Reaction to Insect Pests ……… 21
Blast (Neck rot) ……… 22
Total Plant Weight ……… 23
Harvest Index ……… 23
Yield per Plot ……… 24
Yield per Hectare ……….. 24
Cost and Return Analysis ……….. ……….. 25
SUMMARY, CONCLUSION AND RECOMMENDATION ……….. 31
Summary ……….. 31
Conclusion ……… 32
Recommendation ………. 32
LITERATURE CITED ………. 33
APPENDICES ……….. 35
Rice is the staple food of the Filipinos and the lifeblood of the nation. A semi- aquatic plant scientifically known as Oryza sativa Linn, it is one of the oryzoid groups of the grass family Graminae. It grows readily in areas of considerable warmth and moisture (PhilRice, 1993).
The rice plant usually takes 3-6 months from germination to maturity, depending on the variety and the environment under which is grown. During this period, rice completes basically two distinct sequential growth stages: vegetative and reproductive.
The reproductive stage is subdivided into preheading and postheading periods. The latter is better known as the ripening period. Yield capacity, or the potential size of crop yield, is primarily determined during preheading (Yoshida, 1981).
In the Philippines, rice production is a main source of income for many farmers.
Rice production is common in places like Isabela, Cagayan, Nueva Ecija, Nueva Viscaya, Pangasinan and others. Low yield of rice is however observed in these areas due to factors such as poor choice of variety, soil degradation, improper cultural management practices, and others. Continuos selection of rice varieties suited to a particular location is therefore important.
Based on the National statistic office, Philippine population in the year 2000 was already 73 m, and it was estimated that by the year 2020, the country’s population shall pass the 100 m mark. The country’s current rice consumption as food is 22,000 tons per day. Aside from this, some goes to waste, seed requirement, industries and other purposes (PhilRice, 2001).
2 Because of increasing population and the land intended for cropping is becoming smaller due to demand for other uses such as residential and commercial purposes, there is a need to use high yielding varieties and to adopt new techniques of production like the improvement of traditional agricultural practices, proper time of planting and mechanization.
The use of improved varieties of rice may permit two or three successive croppings per year. Varietal evaluation studies in other places revealed that improved varieties could produce more yields than the traditional ones. However, rice yield varies depending on the place of planting, kind of soil, temperature, fertilizer application, water and necessary care.
Variety evaluation is necessary due to the decreasing yield of existing varieties in localities, which have been used for a long time by the farmers. This is necessary to find outstanding on high yielding varieties to replace degenerated cultivars. The necessity of evaluating varieties to suit prevailing local conditions is made more important by the fact that expansion of land cultivated by farmers is not possible.
This study was conducted to test the performance of high yielding rice varieties in terms of its growth, grain yield and resistance to pests and diseases, and to determine which variety is best suited under Bugayong, Binalonan, Pangasinan condition.
This study was conducted at a farmer’s field in Bugayong, Binalonan, Pangasinan from October 2007 to February 2008.
Varietal Evaluation
Improved rice varieties would vary according to the ecological conditions in which these are grown. Agronomic characters generally associated with high yield potential and nitrogen responsiveness in irrigated lowland varieties possess short or semi- dwarf stature, lodging resistance, high tillering ability, non-spreading culms, and relatively short erect leaves, strong seedling vigor, insensitivity to photoperiod, medium threshing ability and moderate grain dormancy and other available traits (UPLB, 1983).
Modern varieties have greater yield potential than traditional varieties even under the best conditions. Use of fertilizer and improved farming practices will increase grain yield more in modern varieties than in traditional ones. The use of improved varieties is the cheapest single innovation that has the built-in capability for increasing yield substantially (Vergara, 1992).
PCARRD (1981) stated that planting the right varieties that are suited to the specific locations would result to increase yield by 20 %.
Varieties maybe location- specific in accordance to prevailing environmental conditions. This is exemplified by the release of three rice varieties in specific parts of the country. Two of these varieties, Matatag 3 and Matatag 6, were recommended for comercial planting in tungro hot spot areas in the Visayas and in Mindanao. The third variety, Angelica, was recommended specially for the irrigated lowlands in Agusan del Norte where it has been identified to perform well even under unfavorable conditions such as nutrient deficient soils and low solar radiation (PhilRice, 2004).
4 Belino (1999) stated that since exports contribute much in the country’s economy, the government through Agricultural Universities and Colleges like Benguet State University, and others, encourage rice varietal testing and experimentation to determine what variety will give more yields and thus be recommended to farmers.
Evaluating six different varieties of rice at Cadtay, Kapangan, Benguet, Holano (2001) found PSB Rc 56 and PSB Rc 34 registering the highest yield.
PhilRice news (2001) stated that two enterprising farmers took the challenge to try hybrid rice in rice production to earn more income and contribute to rice self- sufficiency program of the government. With hybrid rice, they earned more than what they usually get from inbred rice production.
According to Kush and Masajo (1983) agronomic and morphological traits needed in improved rice varieties would vary according to the ecological condition and in which these are grown. Characters generally associated with high yielding potential and nitrogen responsiveness in irrigated lowland varietis are short and semi dwarf feature, lodging resistant, high tillering ability, non-spreading culms, and relatively short and erect leaves.
Kush (1990) enumerated some strategies in increasing the yield potential of irrigated rice including modification of its plant type, since the short statured plant type with high tillering and dark green leaves developed in the 1960’s has reached a yield Plateau, exploiting heterosis and increasing yield stability by incorporation of multiple resistance to disease and insect pests and tolerance to abiotic factors. For developing rice varieties for unfavorable environment there is a need to define and characterize the major
unfavorable rice ecologies and identify the varietal characteristics suitable for each ecology.
Soil and Water Requirement
A productive soil is the first essential for profitable farming. Soil vary in their capacity to produced crops. Continued and successful production of crops requires maintenance of high fertility level of the soil. The depth of topsoil may vary from 18 to 22 cm and the pH may range from 4.5 to 7.5, which is slightly acidic to neutral (Worthen, 1984).
Water requirement varies from the stage of plant. During seedling period, only thin layer of water to cover the seed is needed. During the vegetative period, water is increase 3-5 cm as the productive stage begins. The depth of water is from 10 to 15 cm because reproductive stage of the rice is sensitive to drought. During the ripening stage, the water should be gradually removed from the field until two weeks before harvesting UPLB (1983).
While rice plant is still growing, water stress must be avoided to prevent retards on the growth and reduced tillers. Large amount of unfilled grains is due to lack of water.
Insufficient water results in wilting, thus reducing the capacity of the plant to produced and transport its food (PhilRice, 2001).
Fertilizer Requirement
IRRI (1986) noted that basal application of fertilizer combined with P and K helps early seedling vigor, stand establishment and rapid coverage of the field by rice foliage with consequent reduction in weed population. With availability of high yielding, early
6 maturing varieties and prospects of adopting timely weed control, a level of 30 to 40 kg N and 15 to 20 kg of each of P2O5, and K2O help early seedling vigor and consequent reduction of weed population.
Effect of Temperature
Temperature is the most important factor to consider in rice production. Rice can grow successfully in regions that have mean of 21oC or above. Higher yield is obtained in warmer places, which may experience a low summer rainfall compared to the humid places (Martin and Leonard, 1970).
Within the critical low and high temperatures, temperature affects grain yield by affecting tillering, spikelet formation, and ripening. There is usually an optimum temperature for different physiological processes and these vary to some degree with variety. Therefore, the results of an experiment depend on the variety used and on whether the range of temperatures studied is above or below the optimum. Within a temperature range of 22°-31°C, the growth rate increases almost linearly with increasing temperatures (Yoshida, 1981).
Effect of Pest and Diseases
The major insect pests of rice in the Philippines are rice stem borer, leaf hopper, plant hopper, army worm and whorl maggots. Which cause 50 to 100 % reduction yield (UPLB, 1983).
Losses of rice yield due to pests and diseases are estimated at 10 % to 12 % respectively. Although the loss on any single field can be catastrophic, most disease control measures include planting resistant varieties and using remedial cultural practices.
However, new technique include the use of foliar fungicides are extremely effective (Encyclopedia Americana, 1980).
Ingram (1995) as cited by Agungan (2000) noted that diseases and insect problems are common in rainfed lowland rice. However, for successful production of both rice crops, rice cultivars which are planted should be resistant to insect and diseases like brown plant hoppers, stem borers and rice bugs which are the most common insect pests. Blast, bacterial blight and brown spot are the common diseases
Harvesting and Threshing
When 80 to 85 % of the grains at the upper portion of the panicle are yellow or straw colored, and those at the base are in the hard dough stage, it is time to harvest PhilRice (1993).
According to PCARRD (1993), ripened grains may drop from the panicle most specially under low temperature when harvesting is delayed. Delayed harvesting may also result to cracking and low milling recovery.
After harvesting, the crop is then ready for threshing (process of separating the grains from the rest of the plant). The farmers may thresh the grains by beating the panicles against a slatted bamboo screen, letting the grains fall between the slats. Some farmers put the bundles of rice through a gasoline-powered thresher. In some areas, farm animals walk over the bundles to thresh the grain (Teason, 1994).
PhilRice (1993) stated that sun drying is the most common post harvest practice of Filipino farmers. In solar drying, the cleaned palay is spread in a layer 2.4 cm thick on various surfaces such as straw mat, fish net, canvass, threshing floor or on the road. The palay is stirred to allow uniform drying.
MATERIALS AND METHODS
This experiment used seven different high rice yielding varieties which was assigned to individual treatments as follows:
CODE VARIETIES SOURCE
V1 PSB Rc 14 (Rio grande) BPI-NSQCS
V2 PSB Rc 18 (Ala) BPI-NSQCS
V3 PSB Rc 82 (Peñaronda) BPI-NSQCS
V4 NSIC Rc 130 (Tubigan 3) BPI-NSQCS
V5 NSIC Rc 138 (Tubigan 5) BPI-NSQCS
V6 IR 64 BPI-NSQCS
V7 PSB Rc 28 (Agno, check) Bugayong
Seedbed and Land Preparation
Seven seedbeds, measuring 50cm x 100cm each was prepared for the seven different varieties. One variety was sown in each seedbed to avoid mixture. Necessary label was placed on each seedbed for proper identification.
An experimental area of 336 m2 was prepared, and divided into 21 plots with a dimension of 1.6m x 10m each. Before transplanting, the land was prepared thoroughly.
The soil was puddled and leveled for easy transplanting.
The land was irrigated after it has been prepared to hasten the decomposition of weeds. During the leveling and final harrowing, the required N-P-K fertilizer at the rate of 60-30-30 kg/ha was incorporated. Five days before panicle initiation urea was top- dressed at the rate of 30-0-0 kg NPK per hectare.
Lay-outing and Transplanting
After land preparation, the experimental plots were laid out and labeled accordingly. Seedlings were transplanted on the designated plot for each following the Randomized Complete Block Design (RCBD) in three replication. Each of the seven varieties was planted with two seedlings per hill on a straight row at a distance of 20cm x 20cm.
Weeds, Insect Pests and Disease Control
Hand weeding was done when necessary after transplanting. Insect pests and diseases was controlled and monitored to reduce economic losses. Other recommended cultural management practices was followed to ensure better yield.
The data to be gathered are the following:
1. Height of seedling before transplanting (cm). The height of rice seedlings was measured from the base to the longest leaf before transplanting using 10 sample hills per plot.
2. Number of days from transplanting to tillering. This was recorded when at least 50 % of the total plants started producing tillers.
3. Number of tillers at maximum tillering stage. The numbers of tillers when the flag leaf would have emerged were counted using 10 hills per plot.
4. Number of productive tillers per hill. The number of productive tillers were counted using 10 sample hills per plot selected at random. Only rice plants which produced panicles was counted and considered.
5. Number of days from transplanting to booting. This was taken when at least 50 % of the total plants in a plot have booted.
10 6. Number of days from booting to heading. This was taken when at least 50
% of the total plants have produced heads.
7. Number of days from transplanting to heading. This was recorded when at least 50 % of the grain in the panicle have ripened or turned yellow.
8. Number of days from heading to ripening. This was taken when at least 80 % of the grains in the panicle have ripened.
9. Final height at harvest (cm). This was measured from the soil surface to the tip of the longest panicle of rice plant taken at ripening stage.
10. Length of panicle at harvest (cm). This was measured from panicle base to panicle tip of the rice plants taken at harvest using 10 panicles per plot.
11. Number of grains per panicle. This was taken using 10 plants per plot selected at random.
12. Stemborer. Field rating for rice was based on actual percentage of
dead hearts and white heads using the three middle rows of the plot as sampling area. Ten sample hills were selected at random where dead hearts were counted 35 and 45 days after transplanting, respectively, while white heads were counted, also using ten sample hills taken at random. The following standard scales used (PhilRice, 1996).
Stemborer
RATING INDEX DESCRIPTION %DEAD HEARTS %WHITE HEADS
1 R 1-10 1-5
3 MR 11-20 6-10
5 I 21-30 11-15
7 MS 31-60 16-25
9 S 60 and above 25 and above
13. Blast (Neckrot). Evaluation on the severity of rice blast was taken from the plant at the center rows. Ten hills taken at random were used. The following standard was used (PhilRice, 1996).
INDEX % BLAST Rating
1 0-5 % Resistant
2 6-25 % Intermediate
3 25 and above Susceptible
14. Total plant weight (kg). This was taken by weighing the whole plant including the grains after drying using 10 samples taken at random per treatment.
15. Harvest Index. This was taken by using the formula.
Economic yield Harvest Index = ---
Botanical yield
16. Yield per plot. After the harvest, the grains were dried to approximately 14
% moisture content. The filled grains were separated from the unfilled grains by winnowing. Only the filled grains were used to obtain the grain weight or yield per plot.
17. Yield per hectare. This was taken by converting the grains per plot
12 into hectare using ratio and proportion; where:
Yield x Yield per hectare = --- x ---
1.6m x 10 m 10,000 m2
18. Cost and Return Analysis. All production cost were recorded and net profit Was obtained. Return on cash expenses were computed using the formula.
Net Income
Return On Cash Expense (ROCE) = --- X
100
Total Cost of Production Data Analysis
All the quantitative data were analyzed using the analysis of variance (ANOVA) for Randomized Complete Block Design (RCBD). The significance of difference among the treatment means was tested using Duncan’s Multiple Range Test (DMRT).
Figure 1. Overview of the area after cleaning and seed germination.
RESULTS AND DISCUSSION
Height of Seedling Before Transplanting
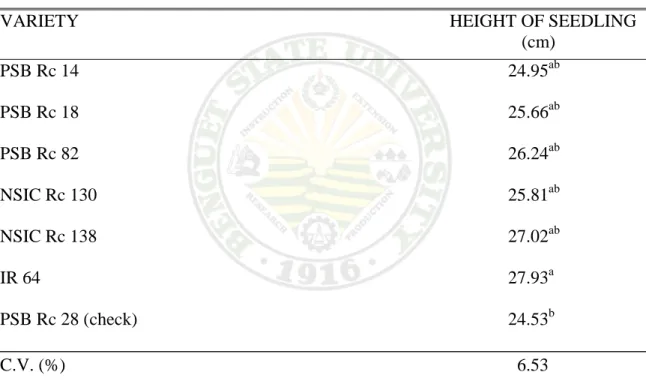
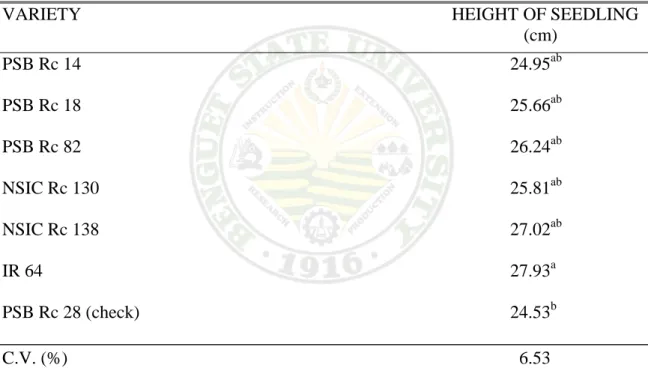
Comparative seedling height of seven varieties of rice before transplanting is shown in Table 1. It was observed that IR 64 was significantly taller than the check variety but not with the rest of the test varieties. The significant differences among
treatments could be attributed to their varietal characteristics.
Table 1. Height of seedling before transplanting of seven rice varieties
VARIETY HEIGHT OF SEEDLING
(cm)
PSB Rc 14 24.95ab
PSB Rc 18 25.66ab
PSB Rc 82 26.24ab
NSIC Rc 130 25.81ab
NSIC Rc 138 27.02ab
IR 64 27.93a
PSB Rc 28 (check) 24.53b
C.V. (%) 6.53
*Means with the same letters are not significantly different at 0.05 level by DMRT Number of Days from Transplanting to Tillering
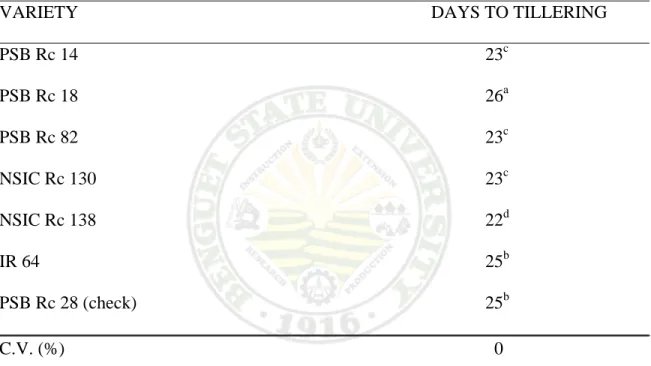
Table 2 shows the number of days from transplanting to tillering. It was observed that NSIC Rc 138 produced tillers in 22 days which was 1-4 days earlier than the other varieties. It was followed by PSB Rc 14, PSB Rc 82 and NSIC Rc 130 in 23 days. Such
significant result could be attributed to the adaptability of the four varieties to Bugayong, Binalonan Pangasinan condition.
The vegetative stage is characterized by active tillering, gradual increase in plant height, and leaf emergence at regular intervals. Active tillering refers to a stage when tillering rate – the increase in tiller number per unit of time – is high (Yoshida, 1981).
Table 2. Number of days from transplanting to tillering of seven rice varieties
VARIETY DAYS TO TILLERING
PSB Rc 14 23c
PSB Rc 18 26a
PSB Rc 82 23c
NSIC Rc 130 23c
NSIC Rc 138 22d
IR 64 25b
PSB Rc 28 (check) 25b
C.V. (%) 0
*Means with the same letters are not significantly different at 0.05 level by DMRT Number of Tillers at Maximum
Tillering Stage
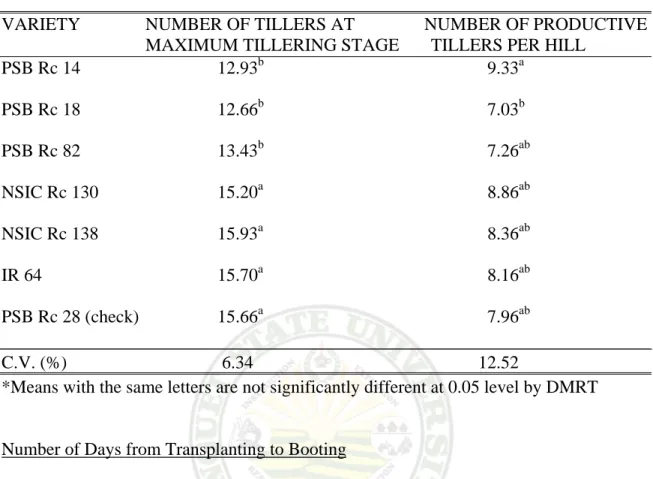
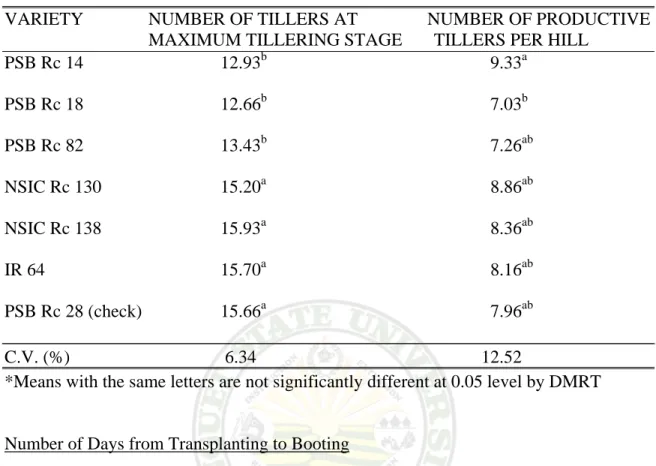
NSIC Rc 138 produced the highest number of tillers with a mean of 15.93 (Table 3). It was followed by IR 64 (15.70), PSB Rc 28 (check variety) (15.66) and NSIC Rc 130 (15.20). PSB Rc 14 and PSB Rc 18 recorded the lowest number of tillers with a mean of 12.93 and 12.66, respectively. These significant differences among treatments could be attributed to their varietal differences. IRRI (1992) stated that modern varieties
16 have more tillers than old variety and varieties differ in tillering ability Spacing the plants far apart gives maximum tillering.
The higher tillering capacity of NSIC Rc 138, NSIC Rc 130, and IR 64 could be indicative of their higher yield potential compared to the other varieties.
Number of Productive Tillers per Hill
The number of productive tillers per hill show some significant differences among the varieties (Table 3). PSB Rc 14 produced greater number of productive tillers (9.33) than PSB Rc 18 which had the least number of productive tillers (7.03). No other marked differences among varieties were noted.
According to UPLB (1992), not all the tillers produce heads; some tillers die, others remain at the vegetative stage since there is competition among the tillers for nutrient and light. Thus, the production of tillers may not be a good gauge of the yield potential of rice.
Table 3. Number of tillers at maximum tillering stage and number of productive tillers per hill of seven rice varieties
VARIETY NUMBER OF TILLERS AT NUMBER OF PRODUCTIVE MAXIMUM TILLERING STAGE TILLERS PER HILL
PSB Rc 14 12.93b 9.33a
PSB Rc 18 12.66b 7.03b
PSB Rc 82 13.43b 7.26ab
NSIC Rc 130 15.20a 8.86ab
NSIC Rc 138 15.93a 8.36ab
IR 64 15.70a 8.16ab
PSB Rc 28 (check) 15.66a 7.96ab
C.V. (%) 6.34 12.52
*Means with the same letters are not significantly different at 0.05 level by DMRT
Number of Days from Transplanting to Booting
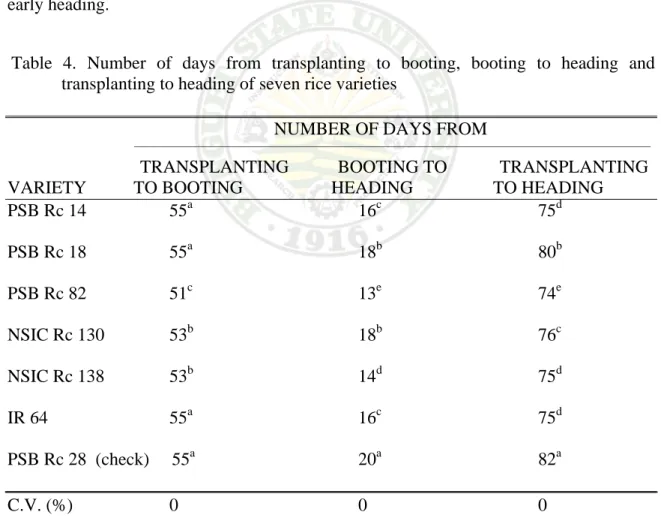
The average number of days from transplanting to booting is shown in Table 4.
PSB Rc 82 was the earliest to boot in 51 days, which was 1-4 days earlier than the other varieties. It appears that PSB Rc 14, PSB Rc 18, IR 64 and PSB Rc 28 (check variety) are later maturing compared to the 3 other varieties. This is due to varietal characteristics.
Numbers of Days from Booting to Heading
Table 4 also shows the number of days from booting to heading. PSB Rc 82 was the earliest to produce head with a mean of 13 days from booting. It was followed closely by NSIC Rc 138 in 14 days, while PSB Rc 28 (check variety) was the latest to produce heads. The reaction of varieties from booting to heading may not always be due to genetic factors but also temperature – influenced. For example low temperature have
18 been known to delay booting. Also, spikelet sterility appears to be affected by both night and day temperatures (Yoshida, 1981).
Number of Days from Transplanting to Heading
Table 4 shows the number of days from transplanting to heading. PSB Rc 82 was the earliest to produce heads with a mean of 74 days, which was 1-8 days earlier than the other varieties. Check variety PSB Rc 28 was the last to produce heads in 82 days after transplanting. Significant differences could be attributed to their varietal characteristics. It seems that variety PSB Rc 82 belonged to early maturing varieties which resulted to its early heading.
Table 4. Number of days from transplanting to booting, booting to heading and transplanting to heading of seven rice varieties
NUMBER OF DAYS FROM
__________________________________________________________________________________________________________
TRANSPLANTING BOOTING TO TRANSPLANTING
VARIETY TO BOOTING HEADING TO HEADING
PSB Rc 14 55a 16c 75d
PSB Rc 18 55a 18b 80b
PSB Rc 82 51c 13e 74e
NSIC Rc 130 53b 18b 76c NSIC Rc 138 53b 14d 75d
IR 64 55a 16c 75d
PSB Rc 28 (check) 55a 20a 82a C.V. (%) 0 0 0
*Means with the same letters are not significantly different at 0.05 level by DMRT
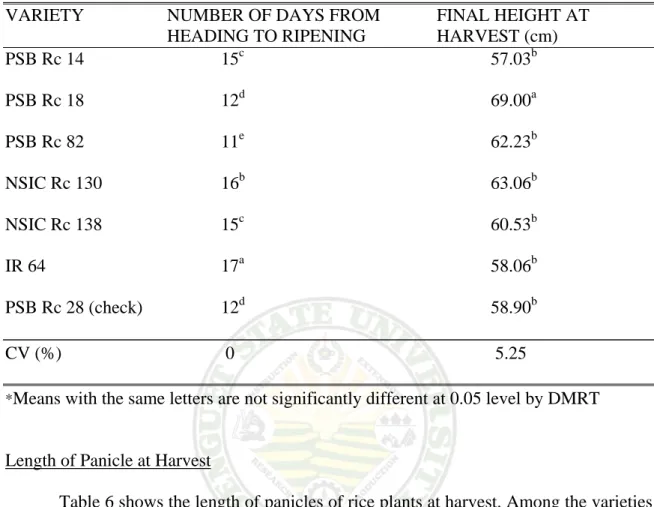
Number of Days from Heading to Ripening
The number of days from heading to ripening is shown in Table 5. Highly significant differences were observed among the varieties in which PSB Rc 82 significantly ripened earlier in 11 days which was 1-6 days earlier than the rest. It was followed by variety PSB Rc 18 and PSB Rc 28 (check variety) with means of 12 days.
Variety IR 64 was the latest to ripen in 17 days. Significant differences could be attributed to their varietal characteristic. This shows that different varieties differ in their performance and adaptability to the locality.
Final Height at Harvest
Plant height at harvest is shown in Table 5. It was observed that PSB Rc 18 was significantly taller than the other varieties with a mean of 69 cm followed by variety NSIC Rc 130 (63.06 cm), PSB Rc 82 (62.23 cm) and NSIC Rc 138 with a mean of 60.
53. The shortest among the varieties evaluated was PSB Rc 14 with a mean of 57.o3 cm.
The difference is about 11.97 cm. Taller plant may have an increased ability to compete with weeds but it may also cause spacing problems. Yield reductions due to weeds decrease with increasing plant height (Yoshida, 1981).
20 Table 5. Number of days from heading to ripening and final height at harvest of seven
rice varieties
VARIETY NUMBER OF DAYS FROM FINAL HEIGHT AT
HEADING TO RIPENING HARVEST (cm)
PSB Rc 14 15c 57.03b
PSB Rc 18 12d 69.00a
PSB Rc 82 11e 62.23b
NSIC Rc 130 16b 63.06b
NSIC Rc 138 15c 60.53b
IR 64 17a 58.06b
PSB Rc 28 (check) 12d 58.90b
CV (%) 0 5.25
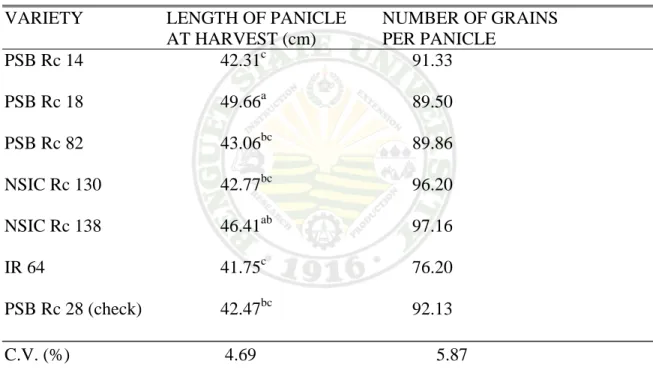
*Means with the same letters are not significantly different at 0.05 level by DMRT Length of Panicle at Harvest
Table 6 shows the length of panicles of rice plants at harvest. Among the varieties evaluated, it was noted that PSB Rc 18 had the longest panicle (49.66 cm). It was followed by NSIC Rc 138 (46.41 cm). IR 64 had the shortest panicle with a mean of 41.75 cm. The difference between the highest and lowest panicle length at harvest is about 7.91 cm, a substantial length which could translate into more grains per panicle.
The significant differences could be due to their genetic make up.
Number of Grains per Panicle
The number of grains per panicle is shown in Table 6. It was observed that NSIC Rc 138 gained the highest number of grains per panicle with a mean of 97.17. It was
of 92.13 and PSB Rc 14 (91.33). IR 64 had the lowest number of grains per panicle with a mean of 76.20. The difference between the number of grains per panicle is about 20.97.
Such, significant differences are due to the compactness of grains in the panicle.
According to Yoshida (1981) the number of panicles per square meter is largely dependent on tillering performance, which is largely determined 10 days after the number of tillers at maximum tillering stage.
Table 6. Length of panicle at harvest and number of grains per panicle of seven rice varieties
VARIETY LENGTH OF PANICLE NUMBER OF GRAINS
AT HARVEST (cm) PER PANICLE
PSB Rc 14 42.31c 91.33
PSB Rc 18 49.66a 89.50
PSB Rc 82 43.06bc 89.86
NSIC Rc 130 42.77bc 96.20 NSIC Rc 138 46.41ab 97.16
IR 64 41.75c 76.20
PSB Rc 28 (check) 42.47bc 92.13
C.V. (%) 4.69 5.87
*Means with the same letters are not significantly different at 0.05 level by DMRT Reaction to Insect Pest
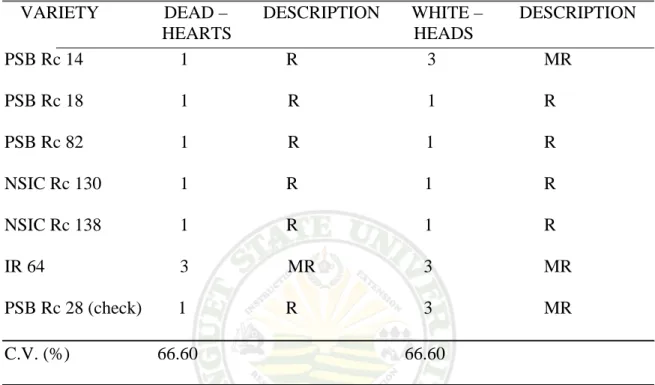
Evaluation of stemborer expressed as dead hearts and white heads was done before booting and heading, respectively. IR 64 was moderately field-resistant to dead heart. The rest of the variety treatment was found to be resistant. On white heads
22 evaluation, PSB Rc 14, PSB Rc 28 (check variety) and IR 64 was rated moderately resistant. Other entries had high yielding potential resistance to insect pests.
Table 7. Reaction to insect pests of seven rice varieties
VARIETY DEAD – DESCRIPTION WHITE – DESCRIPTION HEARTS HEADS
PSB Rc 14 1 R 3 MR PSB Rc 18 1
R 1 R
PSB Rc 82 1 R 1 R NSIC Rc 130 1
R 1 R NSIC Rc 138 1 R 1 R IR 64 3
MR 3 MR PSB Rc 28 (check) 1 R 3 MR
C.V. (%) 66.60 66.60
R – Resistant; MR – Moderately Resistant; I – Intermediate; MS – Moderately Susceptible; S – Susceptible
Rice Blast (Neck Rot)
Rice blast disease evaluation was taken at harvest. It was observed that IR 64 was the only rated with intermediate resistance to rice blast. The rest of the entries were found to be resistant (Table 8).
Table 8. Rice Blast (neck rot) of seven rice varieties
VARIETY BLAST (NECK ROT) DESCRIPTION
PSB Rc 14 1 RESISTANT
PSB Rc 18 1 RESISTANT
PSB Rc 82 1 RESISTANT
NSIC Rc 130 1 RESISTANT
NSIC Rc 138 1 RESISTANT
IR 64 2 INTERMEDIATE
PSB Rc 28 (check) 1 RESISTANT
C.V. (%) 43.28
*Means with the same letters are not significantly different at 0.05 level by DMR Total Plant Weight
Table 9 shows that among the varieties evaluated NSIC Rc 138 had the highest total plant weight with a mean of 1.16 kg followed by NSIC Rc 130 with a mean of 1.06 kg and PSB Rc 28 (check variety) had the lowest total plant weight with a mean of 0.95 kg. Significant differences are due to the structure of each variety which include plant height, number of tillers, length of panicles, number of grains per panicle and leaf characteristics.
Harvest Index
Table 9 shows the harvest index of rice plant. PSB Rc 28, NSIC Rc 130, and IR 64 show the highest harvest index (0.46), followed by PSB Rc 14 and NSIC Rc 138 with a mean of 0.44 and the lowest were PSB Rc 82 and PSB Rc 18 with a mean of 0.43. Such numerical differences among the varieties are due to their varietal differences.
24 Table 9. Total plant weight and harvest index of seven rice varieties
VARIETY TOTAL PLANT WEIGHT HARVEST INDEX (cm)
PSB Rc 14 0.95 0.44
PSB Rc 18 0.99 0.43
PSB Rc 82 0.99 0.43
NSIC Rc 130 1.06 0.46
NSIC Rc 138 1.15 0.44
R 64 0.96 0.46
PSB Rc 28 (check) 0.95 0.46
C.V. (%) 10.36 20.80
*Means with the same letters are not significantly different at 0.05 level by DMRT Yield per Plot and per Hectare
Grain yield per plot and per hectare is shown in Table 10 and Figure 2-5. No marked differences were observed although NSIC Rc 138, numerically had the highest mean yield of 3.31 kg/plot or 2.06 t/ha which is 0.460 kg higher than the check PSB Rc 28. It is interesting to note that NSIC Rc 138 are preferred by the farmers because it will also generate more income.
Table 10. Yield per plot and per hectare of seven rice varieties
VARIETY YIELD PER PLOT YIELD PER HECTARE (kg/16m2) (ton/ha)
PSB Rc 14 2.94 1.84
PSB Rc 18 2.92 1.83
PSB Rc 82 2.60 1.63
NSIC Rc 130 3.14 1.96
NSIC Rc 138 3.31 2.06
IR 64 2.96 1.85
PSB Rc 28 (check) 2.56
1.60 C.V. (%) 22.23 22.23
*Means with the same letters are not significantly different at 0.05 level by DMRT Cost and Return Analysis
The return on cash expenses (ROCE) of rice varieties is shown in Table 11. NSIC Rc 138 had the highest (69.53 %) ROCE while PSB Rc 28 (check variety) had the lowest ROCE (30.09%). All the varieties had a positive ROCE. These results indicate that the variety is used could be profitably grown in locations like Bugayong, Binalonan Pangasinan. It appears though that NSIC Rc 138 and NSIC Rc 130 are the best since both had a ROCE which was more than double that of the check variety.
26 Table 11. Cost and return analysis of rice production ROCE using seven varieties (16m2) VARIETIES GRAIN YIELD GROSS COST OF NET ROCE
PER PLOT INCOME PRODUCTION INCOME (kg/16m2) (Php) (Php) (Php)
PSB Rc 14 2.95 73.75 48.81 24.94 51.09 PSB Rc 18 2.92 73.00 48.81 24.19 49.56 PSB Rc 82 2.60 65.00 48.81 16.19 33.17 NSIC Rc 130 3.14 78.50 48.81 29.69 60.83 NSIC Rc 138 3.31 82.75 48.81 33.94 69.53 IR 64 2.96 74.00 48.81 25.19 51.61 PSB Rc 28 (check) 2.54 63.50 48.81 14.69 30.09 Note: The selling price of rice grains is based on P 25.00/kilo.
Figure 2. Overview of PSB Rc 14 and PSB Rc 18.
28
Figure 3. Overview of PSB Rc 82 and NSIC Rc 130.
Figure 4. Overview of NSIC Rc 138 and IR 64.
30
Figure 5. Overview of PSB Rc 28 (check variety).
Summary
Seven varieties of rice were planted and evaluated in Bugayong, Binalonan Pangasinan from October 2007 to February 2008. The different varieties were: PSB Rc 14, PSB Rc 18, PSB Rc 82, NSIC Rc 130, NSIC Rc 138, IR 64 and PSB Rc 28 (check variety).
The study was conducted to test the performance of high yielding rice varieties in terms of its growth, grain yield and resistance to pests and diseases which among the varieties are best adapted in Bugayong, Binalonan Pangasinan.
Highly significant differences were observed among the varieties. NSIC Rc 138 produced tillers in 22 days, recorded the greatest number of productive tillers and gained the highest number of grains per panicle.
PSB Rc 82 was the earliest to mature, the earliest to reach booting period, the earliest to form heads and also the earliest to ripen at about 85 days after transplanting.
PSB Rc 28 (check variety) was the latest to reach the booting and heading.
Significant differences in height were observed among the varieties. PSB Rc 18 was the tallest followed by NSIC Rc 130, PSB Rc 82 and PSB Rc 14 are the shortest.
PSB Rc 18 had the longest length of panicle followed by NSIC Rc 138, while IR 64 was the shortest length of panicle.
NSIC Rc 138 obtained the highest grain yield for both per plot and per hectare (3.31 kg to 2.06 ton). While NSIC Rc 130 was the second (3.14 kg to 1.96 ton).
On the dead hearts evaluation, all varieties were resistant except IR 64 which was rated moderately resistant and on white heads evaluation, PSB Rc 14, PSB Rc 28 and IR
32 64 was rated moderately resistant. On blast evaluation, all varieties were resistant except IR 64 which was rated intermediate.
Conclusion
Result showed that initially, all the varieties performed well which indicate that they were adapted in the locality. Although PSB Rc 82 had greater number of productive tillers and earlier maturity it had relatively lower yield and return on cash expenses compared to the other test varieties. NSIC Rc 138 and NSIC Rc 130 showed good potential as they outyielded the check variety and were found resistant to insect pests and diseases. Both varieties exhibited the highest return on cash expenses (ROCE) with 69.5% and 60.83% respectively.
Recommendation
Based on the results of the study, NSIC Rc 138 and NSIC Rc 130 are recommended due to their relatively higher yield and return on cash expenses. They were also found to be resistant to stemborer and rice blast.
AGUNGAN, D. A. 2000. Evaluation of high yielding varieties of rice in Bitnong, Dupax del Norte, Nueva Viscaya. BS Thesis. Benguet State University, La Trinidad, Benguet. P. 16
BELINO, M. S. 1999. Evaluation of High Yielding Varieties of Rice under Poblacion, Kibungan Benguet Condition. BS Thesis. Benguet State University, La Trinidad, Benguet. P. 4.
ENCYCLOPEDIA AMERICANA. 1980. The rice plant. New York, Grolier Incorporated 23: 499.
HOLANO, E. A. 2001. Evaluation of high yielding varieties of rice under Cadtay, Kapangam Benguet condition. BS Thesis. Benguet State University, La Trinidad, Benguet. P. 4.
IRRI. 1986. Annual Report. Los Banos, Laguna, Philippines. Pp. 234-235.
KUSH, G. S. 1990. Strategies for rice varietal improvement for the 21st century. Crop science of the Philippines. Pp. 26-30.
KUSH, G.S. and T. M. MASAJO. 1983. Rice production manual. Rice varietal development. University of the Philippines, Los, Banos. Pp. 43-45, 59.
MARTIN, J.H. and W.H. LEONARD. 1970. Principles of field crop production. 2nd ed.
New York. McMillan Company. P. 498.
PCARRD. 1993. The Philippine recommends for grain legumes post production. Los Banos, Laguna. Pp. 6-8.
PCARRD. 1981. Cagayan Technoguide for rice. Los Banos, Laguna, Philippines. P. 88.
PHILRICE. 2001 Newsletter. October 2001. Munoz, Nueva Ecija
PHILRICE. 1995. PhilRice Newsletter. Philippine Rice Research Institute. Munos, Nueva Ecija. P. 30.
PHILRICE. 1993. Rice production technoguide. Los Banos, Laguna, Philippines.
Pp. 19-120.
PHILRICE. 2004. Rice Production Technoguide. Los Banos, Laguna, Philippines.
TEAZON, J. 1994. World Book. From Information Founder. Inc. 525 W. Monroes Chicago, IL 60661. All rights reserved.
34
UPLB. 1983. Rice production manual for NFAC- UPLB Countryside Action Program.
UPLB, Laguna, Philippines. Pp. 7-8, 67, 146-148.
VERGARA, B.S. 1992. A farmer’s primer on growing rice. International Rice Research Institute. Los Banos, Laguna. P. 164. Philippines. Pp. 3-4.
YOSHIDA, S. 1981. Fundamentals of rice crop science. International Rice Research Institute. Los Banos, Laguna, Philippines. P. 1, 73.
WORTHEN, E. L. 1984. Farm soils their management and fertilization. John Willey and Sons, Inc. London. Pp. 1-2.
APPENDIX TABLE 1. Height of seedling before transplanting (cm) REPLICATION
__________________________
VARIETIES I II III TOTAL MEAN PSB Rc 14 23.81 25.29 25.76 74.86 24.95 PSB Rc 18 25.33 26.63 25.04 77.0 25.66 PSB Rc 82 26.87 26.36 25.49 78.72 26.24 NSIC Rc 130 23.38 28.31 25.74 77.43 25.81 NSIC Rc 138 26.23 27.04 27.79 81.06 27.02 IR 64 29.26 27.44 27.09 83.79 27.93 PSB Rc 28 (check) 20.69 25.58 27.34 73.61 24.54 TOTAL 175.57 186.65 184.25 546.47 26.021
ANALYSIS OF VARIANCE
SOURCE DEGREES SUM MEAN OBSERVED TABULAR F OF OF OF OF F ____________
VARIATION FREEDOM SQUARE SQUARE 5% 1%
Treatment 6 24.6104 4.1017 1.42ns 3.00 4.82 Block 2 9.7080 4.8540
Error 12 34.6070 2.8839
TOTAL 20 68.9254
CV = 6.53 %, ns – not significant
Standard Error = 0.9805
35 APENDIX TABLE 2. Number of days from transplanting to tillering
REPLICATION
________________________
VARIETIES I II III TOTAL MEAN
PSB Rc 14 23 23 23 69 23 PSB Rc 18 26 26 26 78 26
PSB Rc 82 23 23 23 69 23 NSIC Rc 130 23 23 23 69 23 NSIC Rc 138 22 22 22 66 22 IR 64 25 25 25 75 25 PSB Rc 28 (check) 25 25 25 75 25 TOTAL 167 167 167 501 23.86
ANALYSIS OF VARIANCE
SOURCE DEGREES SUM MEAN OBSERVED TABULAR F OF OF OF OF F _____________
VARIATION FREEDOM SQUARE SQUARE 0.05% 0.01%
Treatment 6 38.5714 6.4286 α** 3.00 4.82 Block 2 0
Error 12 0
TOTAL 20 38.5714 CV = 0%, ** - highly significant
Standard Error = 0
APPENDIX TABLE 3. Number of tillers at maximum tillering stage REPLICATION
_______________________
VARIETIES I II III TOTAL MEAN PSB Rc 14 12.6 13.2 13.0 38.8 12.93 PSB Rc 18 13.0 12.9 12.1 38.0 12.67 PSB Rc 82 12.9 13.2 14.2 40.3 13.43 NSIC Rc 130 13.4 15.4 16.8 46.0 15.2 NSIC Rc 138 16.4 15.9 15.5 47.8 15.93 IR 64 15.0 14.9 17.2 47.1 15.7 PSB Rc 28 (check) 14.5 15.3 17.2 47.0 15.67 TOTAL 97.8 100.8 106 305 14.50
ANALYSIS OF VARIANCE
SOURCE DEGREES SUM MEAN OBSERVED TABULAR F OF OF OF OF F ____________
VARIATION FREEDOM SQUARE SQUARE 5% 1%
Treatment 6 36.8962 6.1494 7.27** 3.00 4.82 Block 2 4.9181 2.4590
Error 12 10.1552 1.0389 TOTAL 20 51.9695
CV = 6.34%, ** – highly significant
Standard Error = 0.5311
37 APPENDIX TABLE 4. Number of productive tillers per hill
REPLICATION ________________________
VARIETIES I II III TOTAL MEAN PSB Rc 14 8.1 10.3 9.6 28.0 9.3 PSB Rc 18 6.8 6.0 8.3 21.1 7.0 PSB Rc 82 6.9 7.1 7.8 21.8 7.27 NSIC Rc 130 7.0 8.8 10.8 26.6 8.87 NSIC Rc 138 8.7 6.7 9.7 25.1 8.37
IR 64 8.0 8.0 8.5 24.5 8.17
PSB Rc 28 (check) 6.8 9.1 8.0 23.9 7.97 TOTAL 52.3 56.0 62.7 171.0 8.136
ANALYSIS OF VARIANCE
SOURCE DEGREES SUM MEAN OBSERVED TABULAR F OF OF OF OF F ____________
VARIATION FREEDOM SQUARE SQUARE 5% 1%
Treatment 6 12.0648 2.0108 1.94ns 3.00 4.82 Block 2 7.9400 3.9700
Error 12 12.4667 1.0389 TOTAL 20 32.4714
CV = 12.52 %, ns – not significant
Standard Error = 0.5885
APPENDIX TABLE 5. Number of days from transplanting to booting REPLICATION
________________________
VARIETIES I II III TOTAL MEAN PSB Rc 14 55 55 55 165 55 PSB Rc 18 55 55 55 165 55 PSB Rc 82 51 51 51 153 51 NSIC Rc 130 53 53 53 159 53 NSIC Rc 138 53 53 53 159 53 IR 64 55 55 55 165 55 PSB Rc 28 (check) 55 55 55 165 55 TOTAL 377 377 377 1131 53.86
ANALYSIS OF VARIANCE
SOURCE DEGREES SUM MEAN OBSERVED TABULAR F OF OF OF OF F ____________
VARIATION FREEDOM SQUARE SQUARE 5% 1%
Treatment 6 44.5714 7.4286 α** 3.00 4.82 Block 2 0 0
Error 12 0 0 TOTAL 20 44.5714
CV = 0%, ** - highly significant
Standard Error = 0
39 APPENDIX TABLE 6. Number of days from booting to heading
REPLICATION _______________________
VARIETIES I II III TOTAL MEAN PSB Rc 14 16 16 16 48 16 PSB Rc 18 18 18 18 54 18 PSB Rc 82 13 13 13 39 13 NSIC Rc 130 18 18 18 54 18 NSIC Rc 138 14 14 14 42 14 IR 64 16 16 16 48 16 PSB Rc 28 (check) 20 20 20 60 20 TOTAL 115 115 115 345 16.43
ANALYSIS OF VARIANCE
SOURCE DEGREES SUM MEAN OBSERVED TABULAR F OF OF OF OF F ____________
VARIATION FREEDOM SQUARE SQUARE 5% 1%
Treatment 6 107.1429 17.8572 α** 3.00 4.82 Block 2 0 0
Error 12 0 0 TOTAL 20 107.1429 CV = 0%, ** - highly significant
Standard Error = 0
APPENDIX TABLE 7. Number of days from transplanting to heading REPLICATION
________________________
VARIETIES I II III TOTAL MEAN PSB Rc 14 75 75 75 225 75 PSB Rc 18 80 80 80 240 80 PSB Rc 82 74 74 74 222 74 NSIC Rc 130 76 76 76 228 76 NSIC Rc 138 75 75 75 225 75 IR 64 75 75 75 225 75 PSB Rc 28 (check) 82 82 82 246 82 TOTAL 537 537 537 1611 76.71
ANALYSIS OF VARIANCE
SOURCE DEGREES SUM MEAN OBSERVED TABULAR F OF OF OF OF F ____________
VARIATION FREEDOM SQUARE SQUARE 5% 1%
Treatment 6 166.2857 27.7143 α** 3.00 4.82 Block 2 0 0
Error 12 0 0
TOTAL 20 166.2857
CV = 0%, ** - highly significant
Standard Error = 0
41 APPENDIX TABLE 8. Number of days from heading to ripening
REPLICATION
________________________
VARIETIES I II III TOTAL MEAN PSB Rc 14 15 15 15 45 15 PSB Rc 18 12 12 12 36 12 PSB Rc 82 11 11 11 33 11 NSIC Rc 130 16 16 16 48 16 NSIC Rc 138 15 15 15 45 15 IR 64 17 17 17 51 17 PSB Rc 28 (check) 12 12 12 36 12 TOTAL 98 98 98 339 14
ANALYSIS OF VARIANCE
SOURCE DEGREES SUM MEAN OBSERVED TABULAR F OF OF OF OF F ____________
VARIATION FREEDOM SQUARE SQUARE 5% 1%
Treatment 6 96.00 16.00 α** 3.00 4.82 Block 2 0 0
Error 12 0 0
TOTAL 20 96.00
CV = 0%, ** - highly significant
Standard Error = 0
APPENDIX TABLE 9. Final height at harvest (cm) REPLICATION
_________________________
VARIETIES I II III TOTAL MEAN PSB Rc 14 57.5 56.2 57.4 171.1 57.03 PSB Rc 18 71.2 64.3 71.5 207.0 69.0 PSB Rc 82 69.0 62.0 55.7 186.7 62.23 NSIC Rc 130 62.0 63.0 64.2 189.2 63.1 NSIC Rc 138 62.0 60.1 59.5 181.6 60.53 IR 64 56.2 57.0 61.0 174.2 58.1 PSB Rc 28 (check) 59.0 58.3 59.4 176.7 58.9 TOTAL 436.9 420.9 428.7 1286.5 61.27
ANALYSIS OF VARIANCE
SOURCE DEGREES SUM MEAN OBSERVED TABULAR F OF OF OF OF F ____________
VARIATION FREEDOM SQUARE SQUARE 5% 1%
Treatment 6 294.8362 49.1394 4.75* 3.00 4.82 Block 2 18.2895 9.1448
Error 12 124.1438 10.3453
TOTAL 20 437.2695
CV= 5.25%, * - significant
Standard Error = 1.8570
43 APPENDIX TABLE 10. Length of panicle at harvest (cm)
REPLICATION
________________________
VARIETIES I II III TOTAL MEAN PSB Rc 14 45.29 38.98 42.67 126.94 42.31 PSB Rc 18 51.18 48.12 49.7 149.0 49.67 PSB Rc 82 40.81 43.47 44.91 129.19 43.1 NSIC Rc 130 41.78 44.16 42.37 128.31 42.77 NSIC Rc 138 46.56 44.55 48.11 139.22 46.41 IR 64 44.73 39.85 40.69 125.27 41.76 PSB Rc 28 (check) 42.0 43.62 41.81 127.48 42.49 TOTAL 312.35 302.75 310.26 925.41 44.1
ANALYSIS OF VARIANCE
SOURCE DEGREES SUM MEAN OBSERVED TABULAR F OF OF OF OF F ____________
VARIATION FREEDOM SQUARE SQUARE 5% 1%
Treatment 6 151.3859 25.2310 5.91** 3.00 4.82 Block 2 7.2823 3.6411
Error 12 51.1901 4.2658 TOTAL 20 209.8583
CV = 4.69, * - significant
Standard Error = 1.1925
APPENDIX TABLE 11. Number of grains per panicle
REPLICATION _______________________
VARIETIES I II III TOTAL MEAN PSB Rc 14 95.9 93.2 84.9 273.9 91.3 PSB Rc 18 87.7 94.7 86.1 268.5 89.5 PSB Rc 82 94.3 88.9 86.4 269.6 89.87 NSIC Rc 130 102.1 95.9 90.6 288.6 96.2 NSIC Rc 138 90.6 100.5 100.4 291.5 97.2 IR 64 81.4 67.8 79.4 228.6 76.2 PSB Rc 28 (check) 92.7 94.7 89.0 276.4 92.13 TOTAL 644.7 635.8 616.8 1897.1 90.343
ANALYSIS OF VARIANCE
SOURCE DEGREES SUM MEAN OBSERVED TABULAR F OF OF OF OF F ____________
VARIATION FREEDOM SQUARE SQUARE 5% 1%
Treatment 6 858.0448 143.0075 5.08** 3.00 4.82 Block 2 57.9343 28.9671
Error 12 337.7524 28.1460 TOTAL 20 1253.7314
CV = 5.87%, ** - highly significant
Standard Error = 3.0630
45 APPENDIX TABLE 12a. Pest evaluation. Stemborer (Dead hearts)
REPLICATION
________________________
VARIETIES I II III TOTAL MEAN PSB Rc 14 1 2 1 4 1.33
PSB Rc 18 1 1 2 4 1.33
PSB Rc 82 1 3 1 5 1.66
NSIC Rc 130 2 1 1 4 1.33
NSIC Rc 138 1 1 1 3 1.0
IR 64 5 2 1 8 2.66
PSB Rc 28 (check) 1 2 2 5 1.66 TOTAL 12 12 9 33 1.57
ANALYSIS OF VARIANCE
SOURCE DEGREES SUM MEAN OBSERVED TABULAR F OF OF OF OF F ____________
VARIATION FREEDOM SQUARE SQUARE 5% 1%
Block 6 5.1429 0.8571 0.78ns 3.00 4.82 Treatment 2 0.8571 0.4286
Error 12 13.1429 1.0952 TOTAL 20 19.1429
CV = 66.60%, ns = not significant
Standard Error = 0.6042
APPENDIX TABLE 12b Stemborer. (White heads) REPLICATION
__________________________
VARIETIES I II III TOTAL MEAN PSB Rc 14 2 3 3 8 2.66
PSB Rc 18 2 1 1 4 1.33
PSB Rc 82 2 2 1 5 1.66
NSIC Rc 130 1 2 1 4 1.33
NSIC Rc 138 1 1 2 4 1.33
IR 64 1 2 3 6 2.0 PSB Rc 28 (check) 2 2 2 6 2.0 TOTAL 11 13 13 37 1.76
ANALYSIS OF VARIANCE
SOURCE DEGREES SUM MEAN OBSERVED TABULAR F OF OF OF OF F ____________
VARIATION FREEDOM SQUARE SQUARE 5% 1%
Treatment 6 4.4762 0.7460 1.81ns 3.00 4.82 Block 2 0.3810 0.1905
Error 12 4.9524 0.4127 TOTAL 20 9.8095
CV = 36.46%, ns – not significant
Standard Error = 0.3709
47 APPENDIX TABLE 13. Disease evaluation. Blast (Neckrot)
REPLICATION
________________________
VARIETIES I II III TOTAL MEAN
PSB Rc 14 2 1 1 4 1.33
PSB Rc 18 1 1 2 4 1.33
PSB Rc 82 1 2 1 4 1.33 NSIC Rc 130 1 1 1 3 1.0 NSIC Rc 138 1 1 1 3 1.0 IR 64 3 1 2 6 2.0 PSB Rc 28 (check) 2 2 1 5 1.66 TOTAL 11 9 9 29 1.38
ANALYSIS OF VARIANCE
SOURCE DEGREES SUM MEAN OBSERVED TABULAR F OF OF OF OF F ____________
VARIATION FREEDOM SQUARE SQUARE 5% 1%
Treatment 6 2.2857 0.3810 1.07ns 3.00 4.82 Block 2 0.3810 0.1905
Error 12 4.2857 0.3571 TOTAL 20 6.9524
CV = 43.28%, ns – not significant
Standard Error = 0.3450
APPENDIX TABLE 14. Total plant weight (kg)
REPLICATION
__________________________
VARIETIES I II III TOTAL MEAN PSB Rc 14 0.84 1.05 0.98 2.87 0.96 PSB Rc 18 0.85 1.03 1.09 2.97 0.99 PSB Rc 82 1.01 1.01 0.95 2.97 0.99 NSIC Rc 130 1.03 1.03 1.14 3.2 1.10 NSIC Rc 138 1.23 1.12 1.12 3.47 1.17 IR 64 1.11 0.85 0.93 2.89 0.96 PSB Rc 28 (check) 0.92 0.84 1.10 2.86 0.95 TOTAL 6.99 6.93 7.31 21.23 1.02
ANALYSIS OF VARIANCE
SOURCE DEGREES SUM MEAN OBSERVED TABULAR F OF OF OF OF F ____________
VARIATION FREEDOM SQUARE SQUARE 5% 1%
Treatment 6 0.1012 0.0169 1.54ns 3.00 4.82 Block 2 0.0119 0.0060
Error 12 0.1316 0.0110 TOTAL 20 0.2448
CV = 10.36%, ns – not significant
Standard Error = 0.0605
49 APPENDIX TABLE 15. Harvest Index
REPLICATION
__________________________
VARIETIES I II III TOTAL MEAN PSB Rc 14 0.51 0.34 0.49 1.34 0.45 PSB Rc 18 0.60 0.41 0.30 1.31 0.44 PSB Rc 82 0.39 0.60 0.32 1.31 0.44 NSIC Rc 130 0.45 0.51 0.44 1.40 0.47 NSIC Rc 138 0.41 0.49 0.42 1.32 0.44 IR 64 0.490. 0.48 0.41 1.38 0.46 PSB Rc 28 (check) 0.40 0.51 0.49 1.40 0.47 TOTAL 3.25 3.34 2.87 9.16 0.453
ANALYSIS OF VARIANCE
SOURCE DEGREES SUM MEAN OBSERVED TABULAR F OF OF OF OF F ____________
VARIATION FREEDOM SQUARE SQUARE 5% 1%
Treatment 6 0.0034 0.0006 0.06ns 3.00 4.82 Block 2 0.0178 0.0089
Error 12 0.1054 0.0088 TOTAL 20 0.1265
CV = 20.80%, ns = not significant
Standard Error = 0.0541
APPENDIX TABLE 16. Yield per plot (kg)
REPLICATION
_________________________
VARIETIES I II III TOTAL MEAN PSB Rc 14 3.14 2.6 3.1 8.84 2.95 PSB Rc 18 3.7 2.9 2.17 8.77 2.92 PSB Rc 82 2.10 3.7 2.0 7.8 2.6 NSIC Rc 130 3.14 3.15 3.12 9.41 3.14 NSIC Rc 138 3.3 3.5 3.12 9.92 3.31 IR 64 3.8 2.6 2.5 8.9 2.96 PSB Rc 28 (check) 2.17 2.13 3.4 7.7 2.56 TOTAL 21.35 20.58 16.29 61.34 2.92
ANALYSIS OF VARIANCE
SOURCE DEGREES SUM MEAN OBSERVED TABULAR F OF OF OF OF F ____________
VARIATION FREEDOM SQUARE SQUARE 5% 1%
Treatment 6 1.2798 0.2133 0.51ns 3.00 4.82 Block 2 0.2726 0.1363
Error 12 5.0616 0.4218 TOTAL 20 6.6140
CV = 22.23%, ns - not significant
Standard Error = 0.3750
51 APPENDIX TABLE 17. Yield per hectare (ton)
REPLICATION
_________________________
VARIETIES I II III TOTAL MEAN PSB Rc 14 1.96 1.63 1.94 5.53 1.84 PSB Rc 18 2.31 1.81 1.36 5.48 1.83 PSB Rc 82 1.31 2.31 1.25 4.88 1.63 NSIC Rc 130 1.96 1.97 1.95 5.88 1.96 NSIC Rc 138 2.06 2.19 1.95 6.20 2.06 IR 64 2.38 1.63 1.56 5.56 1.85 PSB Rc 28 (check) 1.36 1.33 2.13 4.81 1.60 TOTAL 13.34 12.86 12.13 38.34 18.25
ANALYSIS OF VARIANCE
SOURCE DEGREES SUM MEAN OBSERVED TABULAR F OF OF OF OF F ____________
VARIATION FREEDOM SQUARE SQUARE 5% 1%
Treatment 6 0.3705 0.0618 0.38ns 3.00 4.82 Block 2 0.0272 0.0136
Error 12 1.9650 0.1637 TOTAL 20 2.9650
CV = 21.83%, ns – not significant
Standard Error = 0.2336