BIBLIOGRAPHY
KILILIT, DELMAR C. October 2007. Performance of Meyer Lemon (Citrus limon L.) Under Different Irrigation and Fertilizer Schedules in Pine-based Agroforestry System in Mankayan, Benguet. Benguet State University, La Trinidad, Benguet.
Adviser: Christopher P. Deponio
ABSTRACT
This study was conducted to determine the performance of Meyer lemon (Citrus limon L.) under different irrigation schedules (farmers’ practice-rain fed, and weekly, fortnightly and monthly irrigation) and fertilizer application schedules (farmers practice- no fertilizer applied, monthly fertilization, quarterly fertilization, semi-annual fertilization at recommended rates (Triple 14 at 500 g per tree/year and chicken manure at three shovelfuls per tree/year) under pine-based agroforestry system; and the interaction between fertilization and irrigation was also determined.
There were significant differences in the growth performance of Meyer lemon as affected by the rates of fertilizer and irrigation schedules. Plants treated with semi-annual fertilization recorded the longest period (days) from treatment application to first harvest;
duration of flower development and duration of fruit development. Semi-annual fertilization also resulted to the highest average number of flowers; percent fruit set;
number of fruit developed; average length of shoots; rind thickness; polar diameter;
equatorial diameter; average weight per fruit, and average yield per tree but had the lowest percent of flower drop.
of flowers and fruits developed, high percent fruit set, albeit longer duration of flower and fruit development. It also recorded comparatively high average weight per fruit, equatorial diameter, polar diameter and rind thickness. Percent flower drop was the lowest on plants subjected to weekly irrigation. The yield of intercrop was also highest under weekly irrigation.
The interaction between fertilization and irrigation schedule is significant on the days from treatment application to first harvest, duration of flower development, duration of fruit development, average number of flower, percent of fruit set, number of fruit development, percent of flower drop, average length of shoots, rind thickness, polar diameter, equatorial diameter, average weight per fruit, average yield per tree, yield of inter crop.
Farmers’ practice of fertilizer application and irrigation (no fertilizer application and rain fed irrigation, respectively) whether independently or combined, resulted to the shortest period from treatment application to harvest and the fastest flower and fruit development. However, the percent fruit set was significantly low and the fruit quality was inferior.
TABLE OF CONTENTS
Page
Bibliography………...………...…….…………...……….…………... i
Abstract ………… ……….……….…...………...…………... i
Table of Contents ……….…………...……...….. iii
INTRODUCTION ………..……...……….………. 1
REVIEW OF LITERATURE………..………..…...……… 4
MATERIALS AND METHODS ……….…………...…….……… 8
RESULTS AND DISCUSSIONS ………...………….…….. 12
Soil analysis ……….……...…… …….. 12
Days from treatment application to first harvest as affected by fertilization and irrigation ………...……….……….…… … 12
Duration of flower development as affected by fertilization and irrigation ………..…...….…. 14
Duration of fruit development as affected by fertilization and irrigation ………..…………...….……. 17
Average number of flower as affected by fertilization and irrigation ………...………...……. 19
Percent fruit set as affected by fertilization and irrigation ………...….…….… 21
Number of fruit developed as affected by fertilization and irrigation ………..…….… 24
Percent of flower drop as affected by fertilization and irrigation ……….………. 25
Average length of shoots as affected by fertilization and irrigation ………...……….. 28
Polar diameter (cm) as affected
by fertilization and irrigation ……….……… 32
Equatorial diameter (cm) as affected by fertilization and irrigation ……….…...…………. 34
Average weight per fruit (g) as affected by fertilization and irrigation ………...……….…...……….. 35
Average yield per tree (kg) as affected by fertilization and irrigation ………....……. 38
Yield of intercrop as affected by fertilization and irrigation ………..………...….…… 40
SUMMARY, CONCLUSION AND RECOMMENDATION ……….………. 43
LITERATURE CITED ……….…..………...……… 46
APPENDICES ………..……….……...…. 48
INTRODUCTION
Agroforestry can be defined as combinations of plants, either trees or shrubs, on the same land management unit with agricultural crops, grass, and/or animals, in some form of spatial or temporal arrangement or in sequence. Thus, there are four main components of these systems: trees, crops, grass, and animals. Usually the key criterion in a classification of agroforestry systems is the type of components involved in the system. Based on that, it is possible to define three broad subdivisions: agrisilvicultural, silvopastoral, and agrosilvopastoral (Combe and Budowski, 1979).
Farmers have practiced agroforestry for years. Agroforestry focuses on the wide range of working trees grown on farms and in rural landscapes. Among these are fertilizer trees for land regeneration, soil health and food security; fruit trees for nutrition;
fodder trees that improve smallholder livestock production; timber and fuel wood trees for shelter and energy; medicinal trees to combat disease; and trees that produce gums, resins or latex products. Many of these trees are multipurpose, providing a range of benefits (Nair, 1985).
According to PCARRD (1999), citrus is one of the most important fruit trees in the Philippines. It contributes about Php 80M as income to many farmers dependent on this industry for their livelihood. Although its commercial production is an important source of income for growers, the yield of citrus in the country is relatively low due to the prevailing stiff competition with luxury fruits imported from other countries, lack of water during dry season, inefficient harvesting, poor post-harvest-handling, and unsystematic market strategies.
production like lemon has become important despite the limited area devoted to its production compared to the other regions in the country. Lemon could be one alternative product to vegetable industry. Nowadays, the prices of vegetables are declining because some vegetable products are being imported. According to Ricardo et al., (2004), records of the Bureau of Agricultural Statistics in 1995 showed that the Cordillera Region ranks first in lemon Production with 680,000 kilograms.
Lemon tree yields vary considerably with the cultivar, the location and weather conditions. A yield of 3 boxes per tree is commercially satisfactory. A six-year-old tree bore 966 fruits and, at 9 years of age, had produced a total of 3,173 fruits (Morton, 1987).
The lemon (Citrus limon L.) is one good source of income for gardeners, who want a steady supply of fruits all year round. Lemons, limes and lemonades can be used to make lemon bread, lemon meringue pie, fresh lemonade and juices. The fruit are cultivated primarily for their juice, though the pulp and rind (zest) are also used, primarily in cooking or mixing. Lemon juice is about 5% citric acid, which gives lemons a sour taste and a pH of 2 to 3. This acidity makes lemon juice a cheap, readily available acid for use in a lot of educational chemistry experiments. Citrus trees are becoming more and more popular as landscaping plants, offering not only fruit but an attractive form of year-round, glossy, deep green foliage, and fragrant flowers (Morton, 1987).
Irrigation is one of the most important needs of lemon to produce good quality of fruits. It has been demonstrated that pest control, pruning, and fertilization improvement do not lead to high yield if irrigation practice is inferior (PCARRD, 1987).
3 Galves (1955) as cited by Wardouski and Grierson (1986), reported that the pH, calcium and magnesium content of the soil receiving heavy application of ammonium sulfate in five to six years dropped appreciably while the amount of manganese increased by as much as ten times. It was predicted that as a consequence of these changes in the soil, problems will likely to appear in the orchard if this fertilization practice is continued.
Notable in these studies was a complete fertilizer application which resulted in good growth and increased yield of the trees (Bachelor and Webber, 1968).
The formulation of a sound and economical fertilization program, are not enough, even more important is the information on the effect of fertilizer on the crop itself. Until now, there has not been any published data to show the extent of influence upon the growth and yield of the grown citrus varieties (PCARRD, 1987).
The results of the study may used by the farmers as guide in producing lemon fruits, especially where major water stress is encountered. In addition, the information gathered could be used by students and researchers.
This study aimed to determine the effects of irrigation and fertilization on the performance of Meyer lemon. Specifically, this study aimed to determine the: effect of time of irrigation on the growth, yield and fruit quality of Meyer lemon; effect of time of fertilizer on the growth, yield and fruit quality of Meyer lemon and, combined effect of time of irrigating and fertilizing on the growth, yield and fruit quality of Meyer lemon.
The study was conducted from October, 2006 to April, 2007 at Patpat, Tabio, Mankayan, Benguet.
The origin of the name "lemon" is through Persian, akin to the Sanskrit nimbuka.
They were cultivated in Genoa in the mid-fifteenth century, and appeared in the Azores in 1494. More recent research has identified lemons in the ruins of Pompeii. Lemons were once used by the British Royal navy to combat scurvy, as they provided a large amount of vitamin C (Morton, 1987).
Meyer lemon (Citrus Limon L.) responds to irrigation and fertilization to induce flowering and to advance maturation of fruits. Through proper timing of the application of fertilizer and irrigation, lemon fruits can be produced off-season to hit a better price when some of lemon plantations are non-bearing (Coronel, 1983).
Meyer is a hybrid, possibly lemon X mandarin orange, introduced into the United States as S.P.I. #23028 by the agricultural explorer Frank N. Meyer, who found it growing as an ornamental pot-plant near Peking, China in 1908. Its fruit is obovate, elliptical or oblong, round at the base, occasionally faintly necked and furrowed or lobed;
apex rounded or with short nipple; of medium size, 2 1/4 to 3 in (5.7-7.5 cm) wide and 2 1/2 to 3 1/2 in (6.25-9 cm) high; the peel light-orange with numerous small oil glands, 1/8 to 1/4 in (3-6 mm) thick; the pulp pale orange-yellow, usually in 10 segments with tender walls, melting, juicy, moderately acid with medium lemon flavor; seeds small, 8 to 12.
The tree tends to be ever bearing but fruits mostly from December to April. It is small, with few thorns, prolific, cold-resistant; produces few water sprouts, and is only moderately subject to greasy spot and oil spotting. It is easily and commonly grown from
5 cuttings. Does well on sweet orange and rough lemon rootstocks; is not grafted onto sour orange because it is a carrier of a virulent strain of tristeza (Morton, 1987).
Citrus can be harvested four to nine months from flowering depending on the variety, environment and cultural management practices employed (RP-German Fruit Tree Project, 1995).
Richter (1916) stated that without question (but also without showing data) all the blooms of the lemon could be protected from insect visitation without the slightest reduction in set of mature fruit. Webber (1930) also concluded that pollination by bees was probably a negligible factor in the production of citrus fruits, at least for the 'Eureka' and 'Lisbon' lemons, the 'Valencia' and 'Washington Navel' oranges, and the 'Marsh' grapefruit. However, Webber et al. (1943) stated that although self-pollination occurs rather commonly without insects, seedlessness sometimes results, and seedlessness is rather generally a handicap to setting of fruit. Lemon is an early maturing, and cold- hardly species that sets fruits parthenocarpically (Morton, 1987).
However, where numerous tests have been conducted on caged citrus trees, Glukhov (1955) stated that lemon trees isolated from bees produced only one-fourth as much fruit as trees exposed to cross- pollination by bees. Burnaeva (1956) reported that lemons receiving supplemental pollen from other cultivars or citrus species, produced more than trees not exposed to cross-pollination. Zavrashvili (1964) reported that lemon trees caged without bees produced 42.5 percent less than open-pollinated trees, whereas the trees caged with bees produced only 10 percent less, indicating that bees contribute by distributing the self- pollen on the tree. Randhama et al., (1961) obtained four mature 'Malta' lemon fruit from 25 cross-pollinated flowers but none from 50 selfed flowers.
Citrus, and Durian. It was observed to flower when a day spell of 7-21 days is followed by even the lightest shower or rain. Rain in excess of 3 mm can insure blossoming adequate supply of water, however, is needed for the flower to develop. It also appears that a period of water stress even for a short period of time is necessary for coffee and Lanzones trees before irrigation to induce heavy flowering (Bautista et al., 1983).
Reuther (1973) as cited by Tipayno (1989) pointed out that under arid and semi arid conditions, water is regarded as the life-blood of citrus production. Without water in sufficient quantity and acceptable quality, there would be no citrus production. This is quite a discouraging statement to those who can not afford the benefit of mechanized irrigation. To them, any effort to venture in citrus production would be fruitless.
Coronel (1983) concluded that irrigation on different fruit production induces flowering and was shown to increase fruit size during fruit development.
In some observations, farmers fail to produce lemon fruits especially on dry areas where water is very expensive that they only depend on rain for irrigation. This may be one reason why the Philippines is one of the lowest producers of lemon in the world (Talbert, 1973).
MATERIALS AND METHOD
Three-year-old marcotted lemon trees planted in a private citrus orchard in Patpat, Tabio, Mankayan, Benguet were used in this study. Soybean and papaya were planted as intercrop. The area has an elevation of approximately 1000 meters above sea level with a slope of 75% or 33.75 º, but the area that was planted with citrus has less than 15% or 6.75 º slopes. The soil type is clay loam. The site has an average temperature of 25 º C, annual rainfall of 2,664 mm, and Type I climate classification with two distinct seasons:
the Dry and Wet seasons. The average sunshine hours in the area is 10 ½ hours (6:30 am – 5:00 pm).The surroundings are planted with oranges (Citrus sinensis L), pummelo (C.
grandis L.), and trees such as mahogany (Swietenia sp.), and alnus (Alnus sp.). The upper slope is naturally regenerated with Benguet Pine that had been declared a watershed and is the source of irrigation in the area.
Description of the Lemon Trees
The trees are neither fertilized nor irrigated. They are slightly normal, some of the leaves are yellowish in color, and fruits are small and few during dry the season. The flowers are few sometimes more flowers produce but they fall down. The yield is very low, they only produce good yield during rainy season.
Land Preparation
Cleaning the area was done before cultivating the base of the trees. Fertilizer was applied within the radius of the root zone. Complete fertilizer (14-14-14) and decomposed chicken manure was used in the treatments at the rate of 500 grams and 2-3
shovelfuls per tree/year, respectively as mentioned by Tipayno (1989) applied as described in the treatments. Soybean was planted as alley crop where farmer’s practice was applied.
Care and Maintenance
The plant was irrigated directly around the base of the trees by flooding. The fertilizers were applied before irrigating. Weeding was also done. “Rono” or “bel-lang”
(Miscanthus sinensis) leaves were used as mulch to minimize water evaporation from the soil and prevent weed growth around the base of the lemon trees. Weeds removed from alleys were used as mulch. Appropriate pest management measures were observed.
Treatments
Sixteen lemon trees were randomly selected, and each tree was designated as the treatment replication. They were tagged to serve as permanent base of observations up to harvesting. The experiment used the Randomized Complete Block Factorial Design (RCB-Factorial). The treatments were as follows.
Factor A (fertilizer application schedule)
F0= No fertilizer applied (farmers practice)
F1= monthly fertilization with Triple 14 (500 g per tree/year) and chicken manure (2-3 shovelfuls per tree/year)
F2= quarterly fertilization with Triple 14 (500 g per tree/year) and chicken manure (2-3 shovelfuls per tree/year)
F3= semi-annual fertilization with Triple 14 (500 g per tree/year) and chicken manure (2-3 shovelfuls per tree/year)
10
Factor B (Irrigation schedule)
I0= rain fed irrigation (farmers practice)
I1= weekly irrigation (irrigated until soil is saturated).
I2= fortnightly irrigation (irrigated until soil is saturated).
I3= monthly irrigation (irrigated until soil is saturated).
Data Gathered
Data gathered are as follows:
Vegetative Parameters
1. Soil analysis. The pH of the soil in the area was obtained through soil sampling.
2. Days from treatment application to first harvest. The number of days from treatment application to the first harvest was counted and recorded.
3. Duration of flower development. The number of days from flower bud emergence to 50% fruit set was counted and recorded.
4. Duration of fruit development. The number of days from fruit set to 50% maturity was counted and recorded.
5. Average number of flowers. The number of flowers developed was recorded from sample trees per treatment replication.
6. Percent fruit set. The number of fruits developed was counted then divided by the total number of flowers produced and then multiplied by 100
7. Percent of flower drop. This was obtained using the formula:
= Number of flowers formed - number of fruits X 100 Total number of flowers formed
8. Average number of new shoots. The number of new shoots/branches developed after treatment application was counted and recorded.
9. Average length of shoots (cm). The average shoot length was measured using a foot rule.
Yield
10. Fruit quality. The polar and equatorial peel/rind and diameter of the fruit were measured using a caliper from 10 sample fruits per treatment.
A. Rind thickness (mm). The thickness of the rind was measured using caliper from 10 sample fruits.
B. Average size of fruit (cm). The size of the fruit in terms of polar and equatorial diameters was measured using a caliper from 10 sample fruits.
11. Fruit yield (kg). The yield per tree was recorded.
A. Average weight per fruit. The average weight per fruit was recorded.
B. Average yield per tree. The average yield per tree was recorded.
12. Yield of intercrop. The total yield of soybean intercrop was recorded; areas of intercrop were taken from 3 square meters per tree.
RESULTS AND DISCUSSION
Soil Analysis
Soil pH was obtained after the experiment from aggregate soil samples through the use of portable pH meter. The pH of the soil in the area was 5.5 (slightly acidic), which is a normal pH for growing of lemon. The pH was taken after the experiment.
Days from Treatment Application to First Harvest
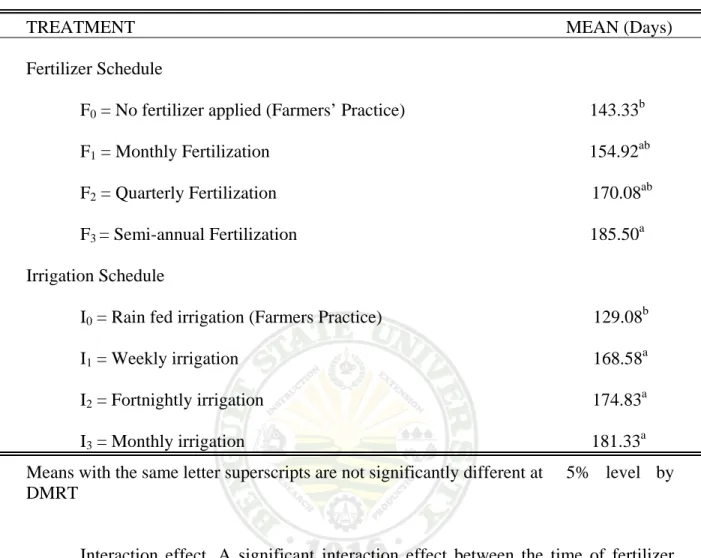
Effect of fertilizer. The number of days from treatment application to first harvest is shown in Table 1. Farmers’ practice, (F0 = no fertilizer application) resulted to significantly earlier harvesting with a mean of 143.33 days as against the semi-annual fertilization (F3), which produced harvestable fruits in a 185.50 days. Monthly (F1) and Quarterly fertilization (F2) with means of 154.92 and 170.08 days, respectively, were comparable to either the farmers’ practice (F0) or semi-annual fertilization (F3).
Effect of irrigation. The rain fed lemon trees (I0 = Farmers’ practice) resulted to the least number of days to first harvest with a mean of 129.08 days, followed by fortnightly (I2) and monthly irrigation (I3) with a mean of 168.58 and 174.83 days, respectively. The weekly irrigation (I1) had the longest number of days to first harvest with a mean of 181.33 days.
Table 1. Days from treatment application to first harvest as affected by fertilization and irrigation
TREATMENT MEAN (Days)
Fertilizer Schedule
F0 = No fertilizer applied (Farmers’ Practice) 143.33b F1 = Monthly Fertilization 154.92ab F2 = Quarterly Fertilization 170.08ab F3 = Semi-annual Fertilization 185.50a Irrigation Schedule
I0 = Rain fed irrigation (Farmers Practice) 129.08b
I1 = Weekly irrigation 168.58a
I2 = Fortnightly irrigation 174.83a I3 = Monthly irrigation 181.33a Means with the same letter superscripts are not significantly different at 5% level by DMRT
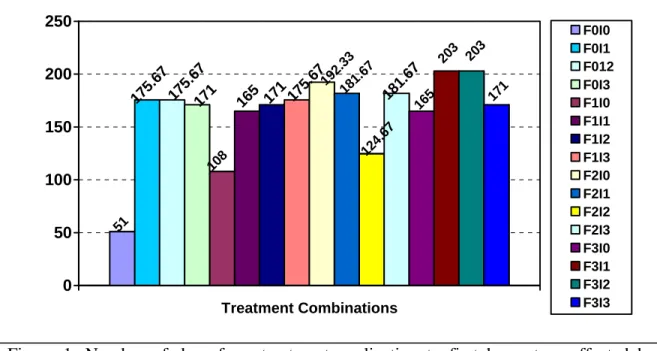
Interaction effect. A significant interaction effect between the time of fertilizer application and irrigation on the number of days to produce lemon fruits (Appendix Table 1) was revealed by statistical analysis. Figure 1 shows the graphical illustration of the combined effect of time of fertilizer application and irrigation schedule on the number of days to first harvest. The combination of farmers’ practice (no fertilizer application + rain fed irrigation) or F0I0 resulted to the lowest number of days to first harvest with a mean of 51.00 days. Semi-annual fertilization + weekly irrigation (F3I1) and semi-annual fertilization + fortnightly irrigation (F3I2) took the longest to produce harvestable fruits,
14
51 175
.67 175
.67 171
108 165
171 175 .67
192 .33
181.67
124.67 181
.67
165
203 203 171
0 50 100 150 200 250
Treatment Combinations
F0I0 F0I1 F012 F0I3 F1I0 F1I1 F1I2 F1I3 F2I0 F2I1 F2I2 F2I3 F3I0 F3I1 F3I2 F3I3
Figure 1. Number of days from treatment application to first harvest as affected by fertilization and irrigation
both with a mean of 203.00 days. All other treatment combinations were comparable to farmers’ practice (F0I0) or semi-annual fertilization + weekly irrigation (F3I1).
The result indicates that fertilizer and irrigation schedules influence the earliness of harvesting of fruits. Lemon trees need greater amount of water especially during dry months of the year to improve their root environment and have better crop yield, corroborating the study of Coronel (1983).
Duration of Flower Development
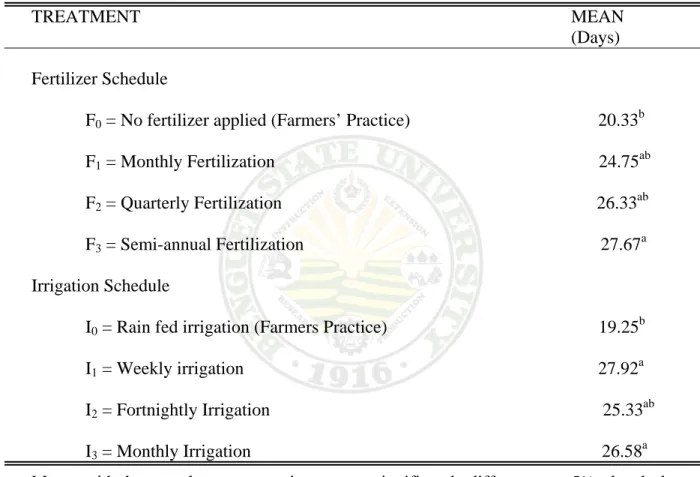
Effect of fertilizer. Table 2 shows the effect of time of fertilizer application on the duration of flower development. Shorter duration of flower development was effected by Farmers’ practice (F0 = no fertilizer application) with a mean of 20.33 days, which is significantly lower than semi-annual fertilization (F3) with a mean of 27.67 days.
Meanwhile, monthly fertilization (F1) and quarterly fertilization (F2) had means of 24.75 and 26.33, respectively, which are comparable to either F0 or F3.
Effect of irrigation. Farmers’ practice (I0 = rain fed irrigation) effected the fastest flower development with a mean of 19.25 days, which is significantly lower than weekly irrigation (I1) and monthly irrigation (I3) which had means of 27.92 and 26.58 days, respectively. Fortnightly irrigation (I2) was comparable to all treatments.
Table 2. Duration of flower development as affected by fertilization and irrigation TREATMENT MEAN (Days) Fertilizer Schedule
F0 = No fertilizer applied (Farmers’ Practice) 20.33b F1 = Monthly Fertilization 24.75ab F2 = Quarterly Fertilization 26.33ab F3 = Semi-annual Fertilization 27.67a Irrigation Schedule
I0 = Rain fed irrigation (Farmers Practice) 19.25b I1 = Weekly irrigation 27.92a I2 = Fortnightly Irrigation 25.33ab I3 = Monthly Irrigation 26.58a Means with the same letter superscripts are not significantly different at 5% level by DMRT
16
9.33
26.671833 27
18
27 27.33 26.67
24 28
27.67 25.67
25.67 30
28 27
0 10 20 30
F0I0 F0I1 F0I2 F0I3 F1I0 F1I1 F1I2 F1I3 F2I0 F2I1 F2I2 F2I3 F3I0 F3I1 F3I2 F3I3
Figure 2. Duration of flower development as affected by fertilization and irrigation
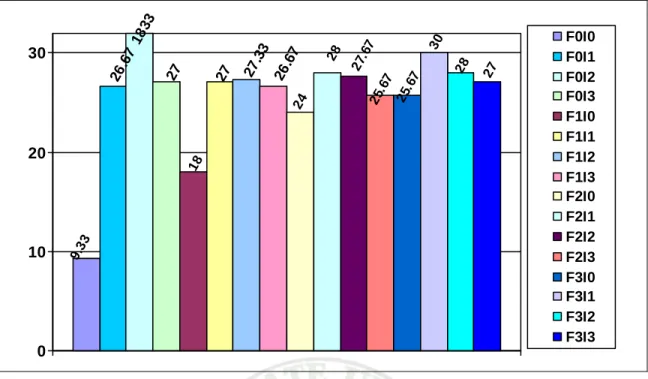
Interaction effect. Figure 2 shows the graphical illustration of the interaction effect of time of fertilizer application and irrigation on the duration of flower development. Statistical analysis showed no significant differences resulting from the interaction between the time of fertilizer application and irrigation on the duration of flower development (Appendix Table 2). However, semi-annual fertilization + weekly irrigation (F3I1) resulted to the longest duration of flower development with a mean of 30.00 days. Nevertheless, most of the flowers developed to produce harvestable fruits as shown in Figure 6. The shortest duration of flower development was observed in plants treated farmers’ practice (F0I0 = no fertilization + rain fed irrigation) with a mean of 9.33 days, which produced the least number of harvestable fruits as shown in Figure 6.
Duration of Fruit Development
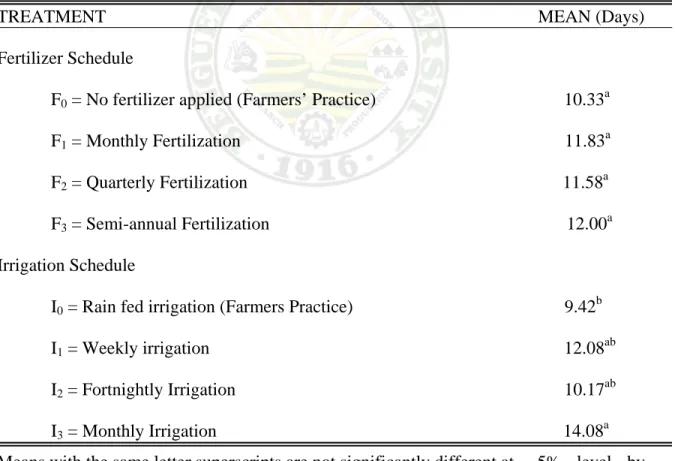
Effect of fertilizer. The effect of time of fertilizer application on duration of fruit development is presented in Table 3. Statistical analysis revealed that there was no significant effect. However, semi-annual fertilization (F3) resulted to the longest duration of fruit development with a mean of 12.0 days, compared to farmers’ practice (F0 = no fertilizer applied) which had the lowest mean of 10.33 days. Quarterly fertilization (F2) and monthly fertilization (F1) had means of 11.583 and 11.83 days, respectively.
Nevertheless, semi-annual fertilization resulted to the most fruits developed (Table 6), and bigger size of fruits (Tables 10 and 11).
Table 3. Duration of fruit development as affected by fertilization and irrigation
TREATMENT MEAN (Days) Fertilizer Schedule
F0 = No fertilizer applied (Farmers’ Practice) 10.33a F1 = Monthly Fertilization 11.83a F2 = Quarterly Fertilization 11.58a F3 = Semi-annual Fertilization 12.00a Irrigation Schedule
I0 = Rain fed irrigation (Farmers Practice) 9.42b
I1 = Weekly irrigation 12.08ab
I2 = Fortnightly Irrigation 10.17ab I3 = Monthly Irrigation 14.08a Means with the same letter superscripts are not significantly different at 5% level by DMRT
18
Effect of irrigation. In terms of effect of irrigation, plants that were rain fed (I0=Farmers’ practice) had the developed fruits within the shortest duration with a mean of 9.42 days, as against the monthly irrigation (I3) with a mean of 14.08, followed by weekly irrigation (I1) and fortnightly irrigation (I2) with means of 12.08 and 10.17 days, respectively. Statistical analysis revealed significant differences on the duration of fruit development.
Even though fruits developed longer in weekly irrigation, weekly irrigation (I1) and fortnightly irrigation (I2) produced comparatively bigger fruits (Tables 10 and 11), which confirms Coronel’s findings (1983) that more water will increase fruit size during fruit development.
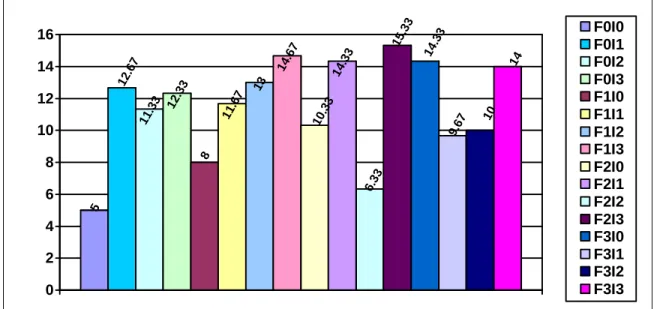
Interaction effect. Figure 3 shows the graphical illustration of the interaction effect of fertilizer and irrigation on the duration of fruit development which means that the semi-annual fertilization + weekly irrigation (F3I1) combination took fruits longer to develop with a mean of 15.33 days, but with less fruits drop. On the other hand, the shortest duration of fruit development (8.0 days) was observed in farmers’ practice (F0I0
= no fertilizer applied + rain fed irrigation) although fruit set was only 0.53% as shown in Figure 5.
Shorter duration of fruit development and the occurrence of small fruit were probably caused by low water availability during dry months.
Statistical analysis shows significant interaction between fertilization and irrigation on duration of fruit development.
5 12.67
11.33 12.33 8
11.67 13 14.67
10.33 14.33
6.33 15.33
14.33
9.67 10 14
0 2 4 6 8 10 12 14
16 F0I0
F0I1 F0I2 F0I3 F1I0 F1I1 F1I2 F1I3 F2I0 F2I1 F2I2 F2I3 F3I0 F3I1 F3I2 F3I3
Figure 3. Duration of fruit development as affected by fertilization and irrigation
Average Number of Flower
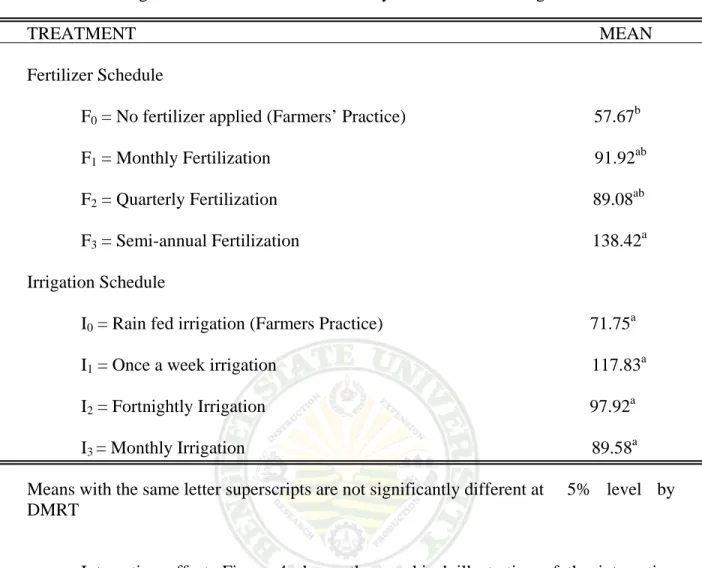
Effect of fertilizer. The farmers practice (F0 = no fertilizers applied) were significantly lower in the average number of flower produce with a mean of 57.67, as against the semi-annual fertilization (F3), which produce more flowers with a mean of 138.42 (table 4), followed by monthly fertilization (F1) and quarterly fertilization (F2) with a mean of 91.92 and 89.08 respectively as shown in Table 4.
Effect of irrigation. Table 4 showed no significant effect on the average number of flower, the farmers practice (I0 = rain fed irrigation) had the lowest with a mean of 71.75 compare with weekly irrigation (I1) with a mean of 117.83 average numbers of flowers.
20
Table 4. Average number of flower as affected by fertilization and irrigation
TREATMENT MEAN Fertilizer Schedule
F0 = No fertilizer applied (Farmers’ Practice) 57.67b F1 = Monthly Fertilization 91.92ab F2 = Quarterly Fertilization 89.08ab F3 = Semi-annual Fertilization 138.42a Irrigation Schedule
I0 = Rain fed irrigation (Farmers Practice) 71.75a I1 = Once a week irrigation 117.83a I2 = Fortnightly Irrigation 97.92a I3 = Monthly Irrigation 89.58a Means with the same letter superscripts are not significantly different at 5% level by DMRT
Interaction effect. Figure 4 shows the graphical illustration of the interaction effect of fertilizer and irrigation on the average number of flowers. Combination of semi- annual fertilization + weekly irrigation (F3I1) result a higher average number of flowers produce with a mean of 178. While (F0I0 = no fertilizers applied + rain fed irrigation) was the lowest average flowers produce with a mean of 18.33, respectively; this result was due to lack of water and fertilizer on trees.
This clearly indicates that application of irrigation and of fertilization during dry months helps in the initiation of more flowers as noted by Wardowski and Grierson (1986) in their study of citrus flowering.
18.33 69.33
68.67 74.33
58.67 116.67
73.67 118.67
79.67 107.33
73.67 95.67
130.33 178
175.67
69.67
0 20 40 60 80 100 120 140 160
180 F0I0
F0I1 F0I2 F0I3 F1I0 F1I1 F1I2 F1I3 F2I0 F2I1 F2I2 F2I3 F3I0 F3I1 F3I2 F3I3
Figure 4. Average number of flower as affected by fertilization and irrigation
Statistical analysis shows the significant interaction effect between fertilization and irrigation on the average number of flowers.
Percent Fruit Set
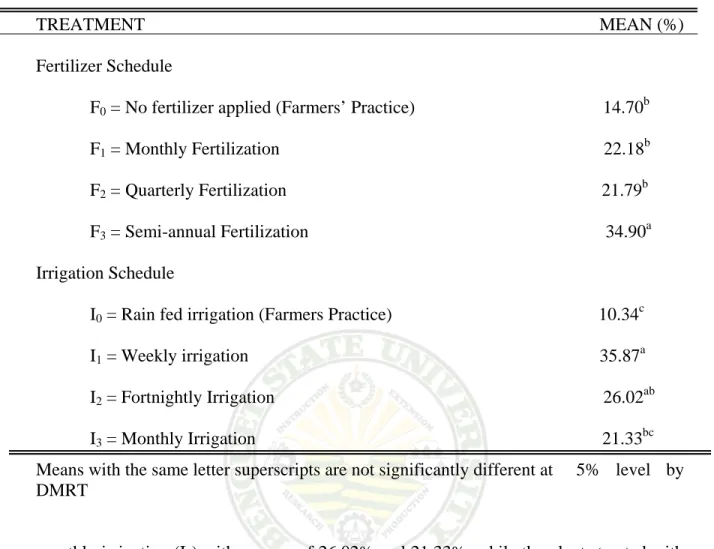
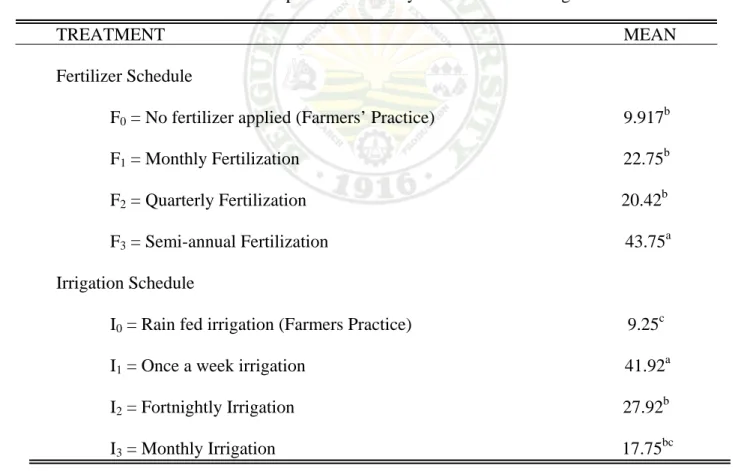
Effect of fertilizer. Statistical analysis shows the significant effect of fertilization on percent fruit set as shown in Table 5. Semi-annual fertilization (F3) had the highest percentage of fruit set with mean of 34.90%, followed by monthly fertilization (F1) and quarterly fertilization (F2) with a mean of 22.18% and 21.79 %, while the Farmers practice (F0 = no fertilizer applied) was the lowest percentage of fruit set with a mean of 14.70%.
Effect of irrigation. The percentage of fruit set produced by the plants is shown in Table 5. The plant treated with weekly irrigation (I1) produce significantly higher
22
Table 5. Percent fruit set as affected by fertilization and irrigation
TREATMENT MEAN (%) Fertilizer Schedule
F0 = No fertilizer applied (Farmers’ Practice) 14.70b F1 = Monthly Fertilization 22.18b F2 = Quarterly Fertilization 21.79b F3 = Semi-annual Fertilization 34.90a Irrigation Schedule
I0 = Rain fed irrigation (Farmers Practice) 10.34c I1 = Weekly irrigation 35.87a I2 = Fortnightly Irrigation 26.02ab I3 = Monthly Irrigation 21.33bc Means with the same letter superscripts are not significantly different at 5% level by DMRT
monthly irrigation (I3) with a mean of 26.02% and 21.33%, while the plants treated with farmers practice of rain fed irrigation (I0) produce the lowest percentage of fruit set with a mean of 10.34% percent.
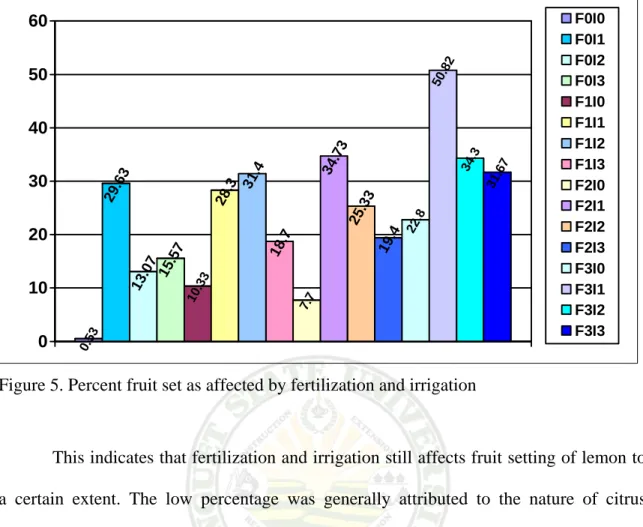
Interaction effect. Statistical analysis shows that the interaction between fertilization and irrigation on percent fruit set is not significant (Figure 5). However, semi-annual fertilization + weekly irrigation (F3I1) had the highest percentage on fruit setting with a mean of 50.82, as against the no fertilizer applied + rain fed irrigation (F0I0) with 0.53% of mean. All other treatments combination were comparable to either the semi-annual fertilization + weekly irrigation (F3I1) or the farmers’ practice (F0I0 = no fertilizer applied + rain fed irrigation).
0.53 29.63
13.07 15.57
10.33
28.3 31.4
18.7
7.7 34.73
25.33 19.4 22
.8 50.82
34.3 31.67
0 10 20 30 40 50
60 F0I0
F0I1 F0I2 F0I3 F1I0 F1I1 F1I2 F1I3 F2I0 F2I1 F2I2 F2I3 F3I0 F3I1 F3I2 F3I3
Figure 5. Percent fruit set as affected by fertilization and irrigation
This indicates that fertilization and irrigation still affects fruit setting of lemon to a certain extent. The low percentage was generally attributed to the nature of citrus species having high flowering ability but tends to be less successful in fruit setting as indicated in this study. According to Batchelor and Webber (1968), although citrus trees usually bloom heavily, a comparative small percentage of flowers and flower buds drop before fruit is set.
Statistical analysis revealed that the interaction effect did not significantly affect the fertilization and irrigation on the percentage of fruit setting. Figure 5 shows the graphical illustration of the interaction effect of fertilizer and irrigation on the percent fruit set.
24
Number of Fruit Developed
Effect of fertilizer. Semi-annual fertilization (F3) is significant higher in the number of fruits developed with a mean of 43.75, compare from monthly fertilization (F1) with a mean of 22.75, followed by quarterly fertilization (F2) and farmers practice (F0 = no fertilizer applied) with a mean of 20.42 and 9.92.
Effect of irrigation. The final number of fruit developed is shown in Table 6. The effect of irrigation on the number of fruit developed is significant. The treatments with irrigation are significantly different from rain fed irrigation. The weekly irrigation (I1) had the highest number of fruit developed with a mean of 41.92, followed by fortnightly
Table 6. Number of fruit developed as affected by fertilization and irrigation
TREATMENT MEAN Fertilizer Schedule
F0 = No fertilizer applied (Farmers’ Practice) 9.917b F1 = Monthly Fertilization 22.75b F2 = Quarterly Fertilization 20.42b F3 = Semi-annual Fertilization 43.75a Irrigation Schedule
I0 = Rain fed irrigation (Farmers Practice) 9.25c I1 = Once a week irrigation 41.92a I2 = Fortnightly Irrigation 27.92b I3 = Monthly Irrigation 17.75bc Means with the same letter superscripts are not significantly different at 5% level by DMRT
irrigation (I2) and monthly irrigation (I3) with a mean of 27.92 and 17.75 respectively.
The rain fed irrigation (farmers’ practice) (I0) had the lowest number of fruit developed with a mean of 9.25.
Interaction effect. Figure 6 shows the graphical illustration of the interaction effect of fertilizer and irrigation on the number of fruit developed. Application of fertilizer two times a year with the weekly irrigation (F3I1) produce more fruits developed that is harvestable with a mean of 86.33, as against the farmers’ practice (F0I0 = no fertilizer applied + rain fed irrigation) produce less fruits with a mean of 1.67.
Statistical analysis shows the significant affect of interaction between fertilization and irrigation on number of fruit developed.
1.67 19.33
10 8.67
9.67 34.67
24.33 22.33
9 27.33
24.33 21
16.67 86.33
53
19
0 10 20 30 40 50 60 70 80
90 F0I0
F0I1 F0I2 F0I3 F1I0 F1I1 F1I2 F1I3 F2I0 F2I1 F2I2 F2I3 F3I0 F3I1 F3I2 F3I3
Figure 6. Interaction effect of fertilization and irrigation on the number of fruit developed
Percent of Flower Drop
Effect of fertilizer. The percent of flower drop by the plants on fertilization is shown in Table 7. The plant treated with semi-annual fertilization (F3) produce
26
significantly lower percentage of flower drop with a mean of 65.02 percent, the farmers practice (F0 = no fertilization applied) has the higher percentage of flower drop with a mean of 80.80 %, followed by quarterly fertilization (F2) and monthly fertilization (F1) with a mean of 78.16 and 76.29 percent.
Effect of irrigation. Irrigation has a significant effect on the percentage of flower drop (Table 7). Weekly irrigation (I1) had the lowest percentage of flower drop with a mean of 64.50%, followed by fortnightly irrigation (I2) with a mean of 71.51%. Farmers practice (rain fed irrigation) (I0) had the highest percentage of flower drop followed by monthly irrigation (I3) with a mean of 85.95% and 78.78%.
Table 7. Percent of flower drop as affected by fertilization and irrigation
TREATMENT MEAN Fertilizer Schedule
F0 = No fertilizer applied (Farmers’ Practice) 80.80a F1 = Monthly Fertilization 76.29a F2 = Quarterly Fertilization 78.17a F3 = Semi-annual Fertilization 65.02b Irrigation Schedule
I0 = Rain fed irrigation (Farmers Practice) 85.95a I1 = Once a week irrigation 64.50c I2 = Fortnightly Irrigation 71.51bc I3 = Monthly Irrigation 78.78ab Means with the same letter superscripts are not significantly different at 5% level by DMRT
91.69
70.31
80.33 84.36 83.91
73.32 68.56
81.91 92.26
65.22
74.61 80.57 77.17
49.14
65.5 68.27
40 50 60 70 80 90
100 F0I0
F0I1 F0I2 F0I3 F1I0 F1I1 F1I2 F1I3 F2II0 F2I1 F2I2 F2I3 F3I0 F3I1 F3I2 F3I3
Figure 7. Percent of flower drop as affected by fertilization and irrigation
Interaction effect. Figure 7 shows the graphical illustration on the effect of fertilizer and irrigation on the percent of flower drop. Statistical analysis showed that the quarterly fertilization + farmers’ practice irrigation (F2I0) were the highest percentage of flower drop with a mean of 92.26 % followed by (F0I0 = no fertilizer applied + rain fed irrigation) with a mean of 91.69%. Finally, the semi-annual fertilization + weekly irrigation (F3I1) gave the lowest of percentage on flower drop with a mean of 49.14%, respectively.
Statistical analysis showed no significant interaction between fertilization and irrigation on percent of flower drop.
28
Average Length of Shoots (cm)
Effect of fertilizer. Statistical analysis shows that fertilization has significant effect on average length of shoots (table 8). Semi-annual fertilization (F3) had the highest mean of 166 cm followed by quarterly fertilization (F2) with a mean of 134 cm, respectively. Farmer’s practice (F0 = no fertilizer applied) had the lowest average length of shoots with a mean of 82.50 cm followed by monthly fertilization (F1) with a mean of 95.73 cm, respectively.
Effect of irrigation. The effect of irrigation on the average length of shoots is significant as revealed by statistical analysis. Weekly irrigation (I1) had the highest mean
Table 8. Average length of shoots as affected by fertilization and irrigation
TREATMENT MEAN Fertilizer Schedule
F0 = No fertilizer applied (Farmers’ Practice) 82.50b F1 = Monthly Fertilization 95.73b F2 = Quarterly Fertilization 134.00a F3 = Semi-annual Fertilization 166.00a Irrigation Schedule
I0 = Rain fed irrigation (Farmers Practice) 85.08b I1 = Once a week irrigation 143.00a I2 = Fortnightly Irrigation 133.58a I3 = Monthly Irrigation 116.57ab Means with the same letter superscripts are not significantly different at 5% level by DMRT
average of 143 cm, as against the rain fed irrigation (I0) with a mean of 85.08 cm;
Fortnightly irrigation (I2) and monthly irrigation (I3) had a mean of 133 cm and 116.57 cm, respectively.
Interaction effect. Figure 8 shows the graphical illustration effect of fertilizer and irrigation on average length of shoots. Maintaining of water present and available of nutrients from fertilizer on the root zone of lemon especially during dry months helps the growth of lemon. In this study, treated with semi-annual fertilization + weekly irrigation (I1F3) were the highest average length of shoots with a mean of 203.67 cm, as against the farmers’ practice (I0F0 = no fertilizer applied + rain fed irrigation) with mean of 58.67 cm.
Statistical analysis showed a significant interaction between the fertilization and irrigation on average length of shoots, which means that using both fertilization and irrigation effect significant on growth performance of lemon.
51.67
58.67 86.33 126.33
64 132.67
106
80.27 99.67 177
151
108.33 118
203.67 191
151.33
0 50 100 150 200
250 F0I0
F0I1 F0I2 F0I3 F1I0 F1I1 F1I2 F1I3 F2I0 F2I1 F2I2 F2I3 F3I0 F3I1 F3I2 F3I3
Figure 8. Average length of shoots as affected by fertilization and irrigation
30
Rind Thickness (mm)
Effect of fertilizer. The effect of fertilization on rind thickness is significant as revealed by statistical analysis. Semi-annual fertilization (F3) of lemon trees had the highest mean rind thickness with 0.42, followed by the monthly fertilization (F1) and quarterly fertilization (F2) with 0.36 and 0.34 mm. The farmer’s practice (F0 = no fertilizer applied) had the lowest mean of 0.33 mm.
Effect of irrigation. Table 9 shows significant effect of irrigation on rind thickness. The rain fed irrigation (I0) was significantly lower in the rind thickness of fruits with a mean of 0.26 mm, as against the monthly irrigation (I3) which has thicker
Table 9. Rind thickness (mm) as affected by fertilization and irrigation
TREATMENT MEAN Fertilizer Schedule
F0 = No fertilizer applied (Farmers’ Practice) 0.33a F1 = Monthly Fertilization 0.36a F2 = Quarterly Fertilization 0.34a F3 = Semi-annual Fertilization 0.42a Irrigation Schedule
I0 = Rain fed irrigation (Farmers Practice) 0.26b I1 = Once a week irrigation 0.42a I2 = Fortnightly Irrigation 0.33ab I3 = Monthly Irrigation 0.43a Means with the same letter superscripts are not significantly different at 5% level by DMRT
rind with a mean of 0.42750 mm. Weekly irrigation (I1) and fortnightly irrigation (I2) of lemon trees gave a mean of 0.42 mm and 0.33 mm. however, this did not differ significantly from either the monthly irrigation (I3) or farmer practice irrigation (I0).
Interaction effect. Statistical analysis shows the significant interaction effect of fertilization and irrigation on rind thickness of the fruit (Appendix Table 9). Figure 9 shows the graphical illustration on the effect of fertilizer and irrigation on rind thickness.
The highest mean number of 0.48 mm was obtained from no fertilizer applied + monthly irrigation (F0I3) while the lowest was noted from the plants using farmers’ practice (F0I0
= no fertilizer applied + rain fed irrigation) with a mean of 0.15 mm.
0.15 0.4
0.28 0.48
0.23 0.44
0.4 0.37
0.26 0.43
0.23 0.44
0.41 0.43
0.4 0.43
0 0.05 0.1 0.15 0.2 0.25 0.3 0.35 0.4 0.45
0.5 F0I0
F0I1 F0I2 F0I3 F1I0 F1I1 F1I2 F1I3 F2I0 F2I1 F2I2 F2I3 F3I0 F3I1 F3I2 F3I3
Figure 9. Rind thickness (mm) as affected by fertilization and irrigation
32
Polar Diameter (cm)
Effect of fertilizer. Statistical analysis shows the not significant effect of fertilization on polar diameter (Table 10). Semi-annual fertilization (F3) had the highest with 6.32 cm, followed by monthly (F1) and quarterly (F2) irrigation with a mean of 5.35 cm and 5.09 cm polar diameter. (F0 = no fertilizer applied) had the lowest with 4.59 cm polar diameter.
Effect of irrigation. Polar diameter as affected by irrigation is shown in Table 10.
The results revealed that irrigation significantly affected the polar diameter. The plants treated with monthly irrigation (I3) obtained the highest number of polarity diameter with
Table 10. Polar diameter (cm) as affected by fertilization and irrigation
TREATMENT MEAN Fertilizer Schedule
F0 = No fertilizer applied (Farmers’ Practice) 4.59a F1 = Monthly Fertilization 5.36a F2 = Quarterly Fertilization 5.09a F3 = Semi-annual Fertilization 6.32a Irrigation Schedule
I0 = Rain fed irrigation (Farmers Practice) 3.95b I1 = Once a week irrigation 6.11a I2 = Fortnightly Irrigation 4.99ab I3 = Monthly Irrigation 6.31a Means with the same letter superscripts are not significantly different at 5% level by DMRT
a mean of 6.31 cm followed by weekly irrigation (I1) and fortnightly irrigation (I2) had a mean of 6.11 and 4.99 respectively, while the lowest mean number of 3.95 cm was obtained from plants treated with rain fed irrigation (I0).
Interaction effect. Interaction effects between the fertilization and irrigation schedule had no significant affect on the polar diameter. Figure 10 shows the graphical illustration effect of fertilizer and irrigation on polar diameter. Plants treated with farmers’ practice, no fertilizer applied + monthly irrigation (F0I3) combination obtain the highest with a mean of 6.80 cm. the lowest mean with 2.09 cm was noted from the plants treated with (F0I0 = no fertilizer applied + rain fed irrigation).
2.093 5.533
3.947 6.803
3.833 6.137
5.81 5.643
3.863 6.233
3.897 6.38
6.013 6.52 6.33
6.433
0 1 2 3 4 5 6
7 F0I0
F0I1 F0I2 F0I3 F1I0 F1I1 F1I2 F1I3 F2I0 F2I1 F2I2 F2I3 F3I0 F3I1 F3I2 F3I3
Figure 10. Polar diameter (cm) as affected by fertilization and irrigation
34
Equatorial Diameter (cm)
Effect of fertilizer. The effect of fertilization on equatorial diameter is not significant with the semi-annual fertilization (F3) having 5.43 cm, monthly fertilization (F1) with 4.59 cm, quarterly fertilization (F2) and farmer’s practice (F0 = no fertilizer applied) with 4.34 and 4.04 cm, respectively (Table 11).
Effect of irrigation. The equatorial diameter in irrigation schedule is showed in Table 11. The effect of irrigation on equatorial diameter is significant with monthly irrigation (I3), weekly irrigation (I1) and fortnightly irrigation (I2) with a mean of 5.37 cm, 5.27 cm and 4.32 cm, respectively. Rain fed irrigation (I0) had the lowest mean with 3.4442 cm.
Table 11. Equatorial diameter (cm) as affected by fertilization and irrigation
TREATMENT MEAN Fertilizer Schedule
F0 = No fertilizer applied (Farmers’ Practice) 4.04a F1 = Monthly Fertilization 4.59a F2 = Quarterly Fertilization 4.34a F3 = Semi-annual Fertilization 5.43a Irrigation Schedule
I0 = Rain fed irrigation (Farmers Practice) 3.44b I1 = Once a week irrigation 5.27a I2 = Fortnightly Irrigation 4.32ab I3 = Monthly Irrigation 5.37a Means with the same letter superscripts are not significantly different at 5% level by DMRT