Entries Applied with Organic Fertilizers under Kapangan, Benguet Condition. Benguet State University, La Trinidad, Benguet.
Adviser: Belinda A. Tad-awan, PhD.
ABSTRACT
The study was conducted to: determine the growth and yield of peanut entries applied with different organic fertilizers; determine the best organic fertilizer that will produce significant yield on the peanut entries; and determine the interaction effect of peanut entry and organic fertilizer on the different parameters.
Bisaw and Putaw significantly produced the highest number of seeds per pod. Bisaw produced the highest marketable and total yield though no significant differences were observed among the peanut entries. Plants applied with BSU- organic fertilizers produced the highest marketable and total yield but not significantly different with the plants applied with the other organic fertilizers and the control.
The best combination based on yield was Bisaw entry and application of BSU- organic fertilizer.
Bibliography………...
Page i
Abstract……….. i
Table of Contents………... ii
INTRODUCTION………... 1
REVIEW OF LITERATURE……… 4
Effect of Organic Fertilizer on Growth and Yield of Crops………... 4
Effect of Organic Fertilizers on Growth and Yield of Peanut………... 5 Yield and Quality of Peanut……….. 6
Varietal Evaluation………... 7
MATERIALS AND METHODS……….. 9
Data Gathered………... 10
Data Analysis………... 13
RESULTS AND DISCUSSION……… 14
Meteorological Data……….. 14
Plant Survival ………... 14
Plant Vigor ……… 15
Plant Height at 30 DAP………... 15
Height at 110 DAP……… 18
Number of Seeds per Pod……….. 18
Number of Non-marketable Pods per Plot ………... 21
Weight of Non-marketable Pods per Plot………... 22
Total Plot Yield………... 23
Computed Yield per Hectare (t/ha)………... 23
Reaction to Leaf Spot at 60 DAP………... 24
Reaction to Leaf Miner Incidence………... 25
SUMMARY, CONCLUSION AND RECOMMENDATION……….. 26
Summary………... 26
Conclusion………... 26
Recommendation………... 27
LITERATURE CITED……….. 28
APPENDICES………... 30
INTRODUCTION
Peanut (Arachis hypogaea L.) or groundnut locally known as “mani” is one of the most important legumes in the Philippines. It is a year round crop of Filipinos as finger
food, prepared in many ways. It is the most common, available and largest selling snack in the country, aside from a major source for food, it is used as shortening, confectionery, and various industrial products. It is a marketed as fresh vegetable, canned, frozen, roasted in the shell, toasted and salted. In the manufacture of butter margarines, and other products, peanut is highly in demand (BAR, 1995).
In terms of nutritional content, peanut is an important source of protein, calories and minerals. It has approximately 25 to 30% protein (dry weight) and 46 to 50% oil. It has a rich source of thiamine and hyacinth provided it is not overheated during roasting.
It is limiting in amino acids, methiomine, cystine, and lysine (PCARRD, 2002).
It is said that in many instances, the mere use of an improve variety has resulted in tremendous increase in yields. In areas where peanut is widely grown, the choice of variety is usually not considered. Most are planting the native variety, thus, yield is low.
Knowing the right variety to plant is very important if a bigger produce of good quality peanut is desired. Thus, variety evaluation is done to find out the varieties that are adapted to the locality, high yielding, resistant to pests and diseases, and which command a higher price (PCARRD, 2002).
Peanut quality is such an important factor that influences consumers’ and processors’ acceptability. Traditionally, quality has been related to yield, pod characteristics, appearance and safeness from hazardous farm chemicals, good eating quality, processing quality and most of all its nutritional value (Villanueva, 2005).
Nowadays, problems on soil fertility and occurrence of plant diseases lead to low production as experienced by most farmers. Thus, application of pure inorganic fertilizer is often practiced to attain maximum yield of legume crops. However, the continuous application of inorganic fertilizer will destroy the soil structure and pollute the water source. The application or addition of organic fertilizer may, therefore, be a good alternative since it will not only reduce inputs of farmers but also improve soil tilth, soil structure, aeration, and water holding capacity (Follet, 1981).
Researchers have found that organic fertilizers like azolla, mushroom compost, BSU-Organic fertilizer and alnus compost are good source of soil nutrient. These fertilizers generally provide essential elements for proper plant growth and some improve the physical, chemical, and biological conditions of soil as claimed by some researchers.
Compost fertilizers are economical to use by the farmers than inorganic fertilizers (Marquez, 1988).
In the locality, there is scarce information on the response of peanut varieties to organic fertilizers, thus, this study.
The study was conducted to:
1. determine the growth and yield of peanut entries applied with different organic fertilizers;
2. determine the best organic fertilizer that will produce significant yield on the peanut entries; and
3. determine the interaction effect of peanut entry and organic fertilizer on the different parameters.
The study was conducted at Beleng-belis, Kapangan, Benguet from November 2010 to March 2011.
REVIEW OF LITERATURE
Effect of Organic Fertilizer on Growth and Yield of Crops
Organic matter and their decomposition products can favorably affect the growth and metabolism of plants and have been reported to control the proliferation of parasitic nematodes and reduce the toxic effects of pesticides. his effects of organic matter to the function of bio-regulators which are produced un the process of decomposition of organic matter or soil humic matter (Cooke, 1984).
The BSU-organic fertilizer produced under the porject is a mixture of mushroom compost, chicken dung and sunflower. It contains 32.23% organic matter indicative of high nitrogen content which is one of the most essential nutrients needed by the crop.The use of raw materials such as Trichoderma and some strains of bacteria to called “bio- fertilizers.” Trichoderma is known to protect plant roots against disease caused by fungi (Laurean, 2009). Furthermore, the benefits derived from bio-organic fertilizer are:
improved soil structure; enhance soil balance and nutrient availability; supply of micronutrients essential for crop growth of microorganisms that helps control growth of soil-borne diseases and nematodes; and makes plant healthier and gives higher crop yield.
According to Tan (1985) compost has identified organisms such as: Trichoderma spp. and Pennicillium spp. Related studies indicate that these organism have anti fungal and anti bacterial properties. Alnus compost was also used as soil conditioner in replacement of the farmers’ practice of applying chgicken dung, to determine its effect against clubroot on cabbage under grweenhouse conditons. Results of the study showed that plants without clubroot applied with alnus compost at the rate of 6 tons per hectare
appear to be the tallest. Severe plant growth inhibition and wilting were observed on plants grown in clubroot-infested soil without alnus and chicken manure. The application of chicken dung at 4 tons per hectare and alnus compost at 6 tons per hectare slightly suppressed the activity of clubroot.
Poincelot (1980) stated that decomposition of organic matter by microorganisms release nutrients, including trace elements needed for crop production. While not enough for complete maintenance, it does help to offset fertilizer needs. The organic matter removed after degradation, stabilized form resistant to microbial attack known as humus.
Local studies showed that sweet potato responds to the application of organic fertilizer as shown by increases in yield of storage roots and improvement of vine vigor.
The use of manure and compost is beneficial especially chicken dung applied at one to two tons per hectare have been found to increase root yield (Ladera, 1993).
According to Balaoing and Lagman (2003), the use of vermicompost as fertilizer provides necessary nutrients in growing pechay. Also vermicompost is also a good potting media for onions. Furthermore, Andaya (1999) reported that the pure BSU compost and BSU compost + garden soil (4:1) proved to be the best growing media for cutflowers. The plants produce more number of flowers, have increased stem length, have improved quality of marketable cut flowers and had the biggest bloom of flowers.
Effect of Organic Fertilizers on Growth and Yield of Peanut
Yoshida (1991) reported that the use of organic materials as fertilizers affected the amount of roots throughout the plant growth and increased the percentage of nodal roots
that elongate to the deep soil layers. The effects of root growth were ascribed to the restrained uptake to the nitrogen released from organic materials at early stage.
The use of organic fertilizers is an essential requirement for higher crop yield in most soils, with nitrogen generally being the most important soil nutrient for legume crop production. Though peanut fixes nitrogen through a symbiotic process, application of nitrogen as starter dose at planting is recommended to increase yield in almost reasons (Hoque, 1988).
Yield and Quality of Peanut
Hagan and Foshee (2000) stated that maximum yield and quality depend upon developing and maintaining a strong, healthy plant. Cultural practices such as cultivation, should be done to prevent damage to the cotyledonary branches, where most by the peanuts originate.
The production of high quality peanut seed begins with the selection of both the land and seed. High quality seed is seed that is capable by establishing full stands or vigorous, uniform seedling that will grow into mature, productive plants. “Foundation” or
“Registered” seed must be planted to produce certified seed. To reduce disease and volunteer plant problems, a good rotational program is essential under contact to commercial companies that buy, store, shell, and teat the seed (ACIA, 1992).
PCARRD (1992) reported that yields of peanut plants near the hedge grows are shorter and somewhat poor pod yields are also lower than the yields of plants in the middle rows in each alley. Lower yield of plants near the hedgegrows could probably be due to the shading effect and nutrient competition with the alley crop.
Varietal Evaluation
Varietal evaluation is necessary to observe the growth and development of the crop. The importance of having a variety evaluation is to observe the characters such as yield, earliness to vigor maturity and keeping quality because different varieties have wide range of plant differences, size, and yield performance (Work and Carew, 1995).
Variety evaluation gatheres data and plant character, tield and pod quality. Hence, high yielding and improved cultivars known to play a role in boasting production are obtained (Regmi, 1990).
Varietal evaluation is done to find out those varieties of crops that are adapted to the grower’s need, is very important. But after testing most attention should be paid to test strains and stocks of varieties selected because great differences exist between strains in peanut crops and is only by trial that superior varieties are found (Thompson and Kelly, 1987).
When evaluating and choosing variety, several conditions must be considered.
Good yield and good grade over a wide range of conditions are usually the most important. It determines the gross return for the crop. Consistency of yield is important across locations but environmental, disease, rainfall and irrigation factors can effect how a variety responds (Aban, 1992).
Quilloy (1995) stated that planting the right varieties that are suited to the specific locations will result to increasing yield by 20%. Siloy (1991) reported that variety must be adapted to the area in which it is grown. There is a great variation in the yielding of the different varieties when grown in the same method of culture.
Sunil (1990) said that variety evaluation was a process in crop breeding program which provides comparison of promising lines developed by a breeder sees the yield, quality, adaptability, stress tolerance, and insect pest and diseases resistance.
Kisofen (2001) in her study on varietal evaluation of peanut found thatAccessions 88392 and E.G. Red significantly produced the heaviest weight of 100 pods while UPL- Pn-10 recorded the lightest. All varieties were rated mildly resistant to leaf spot disease.
MATERIALS AND METHODS
An area of 300 m2 was thoroughly prepared. The area was divided into three blocks representing the three replications with 20 plots with a dimension of 1 m x 5 m each. The experiment was laid-out using 4 x 5 factor factorial in Randomized Complete Block Design (RCBD). The five peanut entries served as a Factor A and the application of the three organic fertilizers served as Factor B.
Factor A. Peanut Entries (E)
Entry Local name Color of Seed Coat Source
E1 Bisaw Red Beleng-belis, Kapangan
E2 Putaw White Poblacion, Kibungan
E3 Aknapan Red Poblacion, Kibungan
E4 Naguey Red Atok
E5 Bakun White Bakun
Factor B. Organic Fertilizer (OF)
OF1 – Control (no organic fertilizer) OF2 – Alnus compost (5 kg per 5 sq m)
OF3 – BSU-organic fertilizer (5 kg per 5 sq m) OF4 – Mushroom compost (20 kg per 5 sq m)
Basal application of fully decomposed alnus fertilizer was done one day before planting with a rate of 5 kg per sq m (Parnes, 1986). Mushroom compost was applied one
week before planting with a rate of 20 kg per sq m (Laurean, 2009, BSU organic fertilizer was done just before planting at a rate of 5 kg per 5 sq m (Balaoing, 2010).
Planting was done in double rows with two seeds per hill at a distance of 25 cm between hills and rows and 50 cm apart. All cultural practices needed in the production of peanut were uniformly employed throughout the growing period. Irrigation was done once a week. Weeding was done whenever needed while pest control was done manually by picking the insect pests. There was no chemical spraying with pesticides.
The data gathered were the following:
A. Meteorological data. The average monthly temperature, relative humidity, sunshine duration and rainfall were recorded every weekend during the entire growing season of the crop from November 2010 to March 2011. Rainfall was gathered using a cylindrical half-cut plastic container then transferred to a baker to measure the volume.
B. Plant characters. The data was gathered from ten sample plants randomly selected from each treatment.
1. Days from sowing to emergence. This was recorded by counting the number of days from sowing to emergence of at least 50% of the seed sown had emerged.
2. Days from emergence to flowering. This was recorded starting from emergence with the day when 50% of plants had flowered.
3. Days from flowering to pod setting. This was taken by counting the number of days from flowering to the day when pods are formed.
4. Percent Survival. This was computed using the formula:
PS (%) = Total Number of Plants Survived x 100 Total Number of Seeds Sown
5. Plant vigor. Visual rating was done 30 days after planting using the scale:
Scale Description Remarks 1 Plants are weak with few stem
are very pale
Poor 2 Plants are weak with few thin
stems and leaves pale
Less vigorous 3 Better than less vigorous Vigorous 4 Plants are moderately strong
with robust stem and leaves were light
Moderately like
5 Plants are strong with robust stem and leaves
Highly vigorous
7. Plant height. This was determined by measuring vertically from the ground level to the tip of the main stem taken at maturity. Initial and final height of plants were recorded.
8. Number of seeds per pod. This was recorded by counting number of seeds per pod from ten sample pods per entry.
C. Yield and Yield Parameters
1. Number and weight of marketable pods per plot (kg/5m2). This was gathered by counting and weighing the marketable seeds per plot per entry.
2. Number and weight of non-marketable pods per plot (kg/5m2). This was gathered by counting and weighing the number of damaged, small sized and infested seeds.
3. Total plot yield (kg/plot) and computed yield per hectare (t/ha). The yield per plot was determined by weighing all harvested pods then converted to tons per hectare using the following formula;
Yield (t/ha) = Yield/ plot x 2 D. Reaction to Pest and Diseases
Pest and Disease incidence. This was noted by visual observation and was assessed by rating the degree of pest and disease incidence on the crop at 60 days after sowing.
1. Leaf miner incidence (Villanueva, 2005).
Rating Percent damage Reaction
0 0 No infection Very Resistant (VR)
1 1-20 of the total plant infected Resistant(R)
3 21-40 of the total plant infected Moderate Resistant(MR) 5 41-60 of the total plant infected Susceptible(S)
7 61-80 of the total plant infected Moderate Susceptible(MS) 9 81-100 of the total plant infected Very Susceptible(VS) 2. Leaf spot incidence
Rating Percent damage Reaction
0 0 No infection Very Resistant (VR)
1 1-20 of the total plant infected Resistant (R)
3 21-40 of the total plant infected Moderate Resistant (MR) 5 41-60 of the total plant infected Susceptible(S)
Rating Percent damage Reaction
7 61-80 of the total plant infected Moderate Susceptible (MS) 9 81-100 of the total plant infected Very Susceptible (VS) Data Analysis
All quantitative data were analyzed using analysis of variance (ANOVA) in 4 x 5 factor factorial in Randomized Complete Block Design (RCBD) with three replications.
The significance of difference among treatments means was tested using Duncan’s Multiple Range Test (DMRT) at 5% level of significance.
RESULTS AND DISCUSSION
Meteorological Data
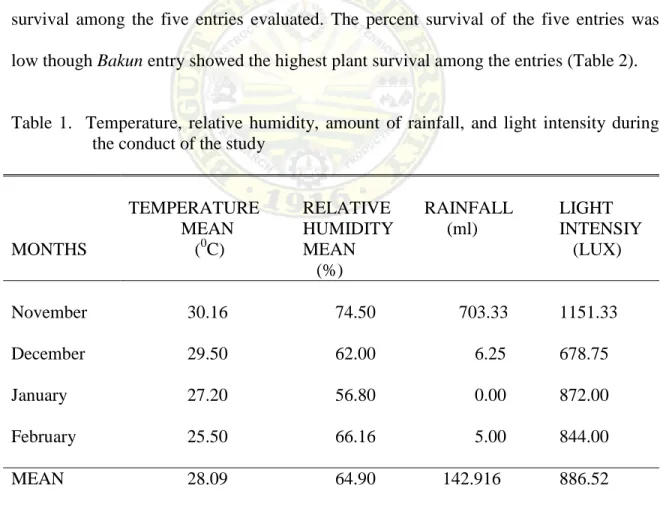
Table 1 shows the temperature, relative humidity, amount of rainfall and light intensity during the conduct of the study. The average temperature was 25.56oC. The average rainfall amount was 142.9 ml. Mean light intensity was 886.52 luces. Relative humidity was 64.9%. Temperature was favorable for peanut production. Peanut grows best in areas with temperature between 20 to 30 0C.
Plant Survival
Effect of entry. No significant differences were obtained on the percentage survival among the five entries evaluated. The percent survival of the five entries was low though Bakun entry showed the highest plant survival among the entries (Table 2).
Table 1. Temperature, relative humidity, amount of rainfall, and light intensity during the conduct of the study
MONTHS
TEMPERATURE MEAN
(0C)
RELATIVE HUMIDITY MEAN (%)
RAINFALL (ml)
LIGHT INTENSIY (LUX)
November 30.16 74.50 703.33 1151.33
December 29.50 62.00 6.25 678.75
January 27.20 56.80 0.00 872.00
February 25.50 66.16 5.00 844.00
MEAN 28.09 64.90 142.916 886.52
Effect of organic fertilizer. The survival of five entries was not significantly influenced by the organic fertilizers applied. Plant survival of 78.93% was observed on plants applied with Alnus compost (Table 2).
Interaction effect. No significant interaction effect on plant survival was observed on the plant survival between entry and organic fertilizers applied (Table 2).
Plant Vigor
Effect of entry. Results show that there were no significant differences among the entries on plant vigor observed at 30 DAP. All plants were rated as moderately vigorous.
Vigorous plants could be due to addition of nutrients from compost (Acosta, 2007).
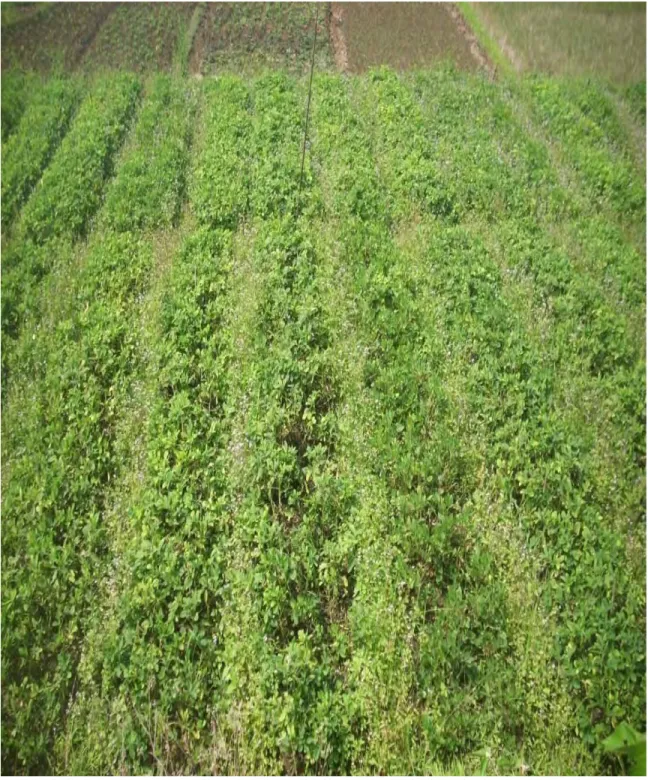
Effect of organic fertilizer. Result shows no significant influence of organic fertilizer on the plant vigor of the peanut entries. At 30 DAP, all plants applied with the different organic fertilizers were rated moderately vigorous (Table 2 and Fig. 1).
Interaction effect of organic fertilizer. There was no significant interaction between the entries and organic fertilizers on the plant vigor (Table 2).
Plant Height at 30 DAP
Effect of entry. There were no significant differences observed among the five entries tested on height at 30 DAP (Table 2). Numerically, Naguey entry had the highest height with 5.5cm while the lowest was the Bakun entry with 5.0 cm.
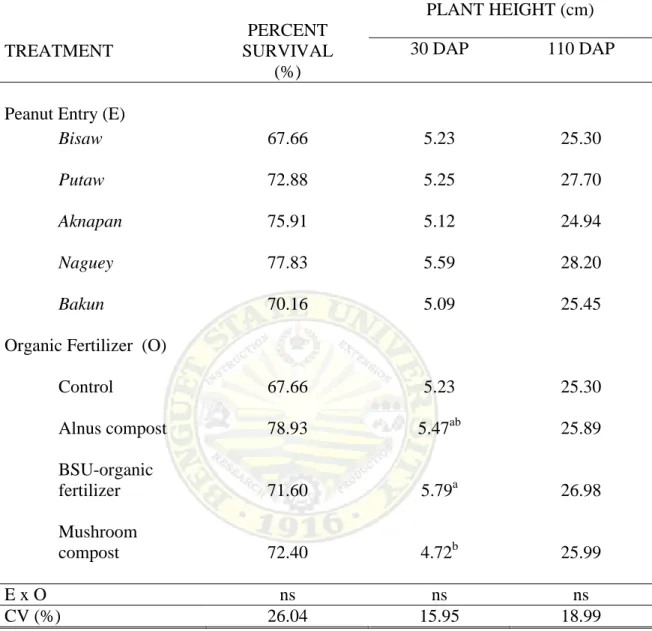
Table 2. Percent survival and plant height at 30 DAP and 110 DAP of five peanut entries as affected by organic fertilizers
Effect of organic fertilizer. The different organic fertilizers did not significantly affect the height of peanut entries at 30 DAP. Plants applied with BSU- organic fertilizer were the tallest with 5.79 cm, followed by the plants applied with Alnus compost with 5.47 cm (Table 2). This could be due to high organic matter present in the BSU-organic fertilizer as indicated by high nitrogen content needed by the crop (Laurean, 2009).
TREATMENT
PERCENT SURVIVAL
(%)
PLANT HEIGHT (cm)
30 DAP 110 DAP
Peanut Entry (E)
Bisaw 67.66 5.23 25.30
Putaw 72.88 5.25 27.70
Aknapan 75.91 5.12 24.94
Naguey 77.83 5.59 28.20
Bakun 70.16 5.09 25.45
Organic Fertilizer (O)
Control 67.66 5.23 25.30
Alnus compost 78.93 5.47ab 25.89
BSU-organic
fertilizer 71.60 5.79a 26.98
Mushroom
compost 72.40 4.72b 25.99
E x O ns ns ns
CV (%) 26.04 15.95 18.99
Figure 1. Overview of the plants at 60 DAP
Interaction effect. The interaction between the entries and organic fertilizer did not significantly affect the height of peanut plants at 30 DAP (Table 2).
Height at 110 DAP
Effect of entry. Results showed no significant differences observed among the entries of peanut (Table 2). Although numerically, Naguey entry was the tallest with 28.20 cm and Aknapan was the lowest with 24.9 cm.
Effect of organic fertilizer. The height of peanut plants applied with the different kinds of organic fertilizers did not differ significantly. Plants applied with BSU-compost were the tallest with 26.98 cm (Table 2).
Interaction effect. Entries and organic fertilizers did not significantly interact to affect height of peanut plants at 110 DAP (Table 2).
Number of Seeds per Pod
Effect of entry. Significant differences on the number of seeds per pod were observed among the different entries of peanut (Table 3). Bisaw and Naguey had the highest number of seeds per pod while Putaw entry had the lowest number of seeds per pod (Table 3).
Effect of organic fertilizer. There were no significant differences observed on the number of seeds produced per pods among the plants applied with different organic fertilizers, though the highest number of seeds produced per pods were obtained from the plants applied with Alnus compost (Table 3).
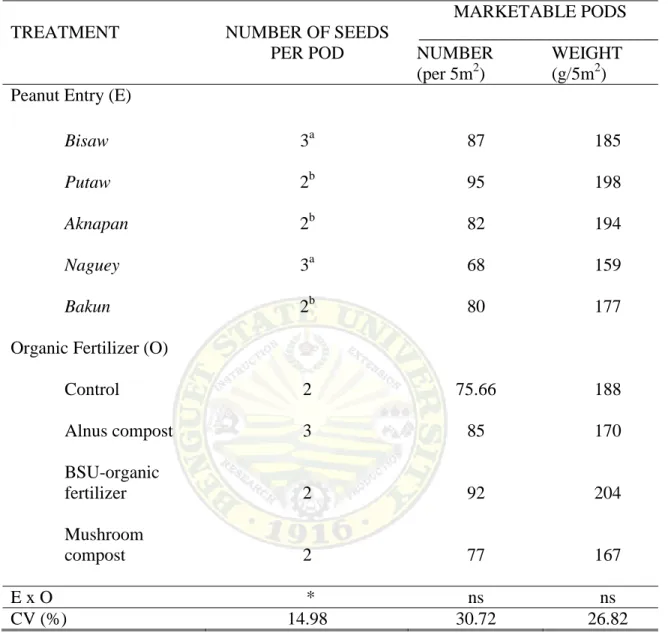
Table 3. Number of seeds per pod and number and weight of marketable pods per plot of five peanut entries applied different kinds of organic fertilizers
TREATMENT NUMBER OF SEEDS
PER POD
MARKETABLE PODS ___________________________
NUMBER (per 5m2)
WEIGHT (g/5m2) Peanut Entry (E)
Bisaw 3a 87 185
Putaw 2b 95 198
Aknapan 2b 82 194
Naguey 3a 68 159
Bakun 2b 80 177
Organic Fertilizer (O)
Control 2 75.66 188
Alnus compost 3 85 170
BSU-organic
fertilizer 2 92 204
Mushroom
compost 2 77 167
E x O * ns ns
CV (%) 14.98 30.72 26.82
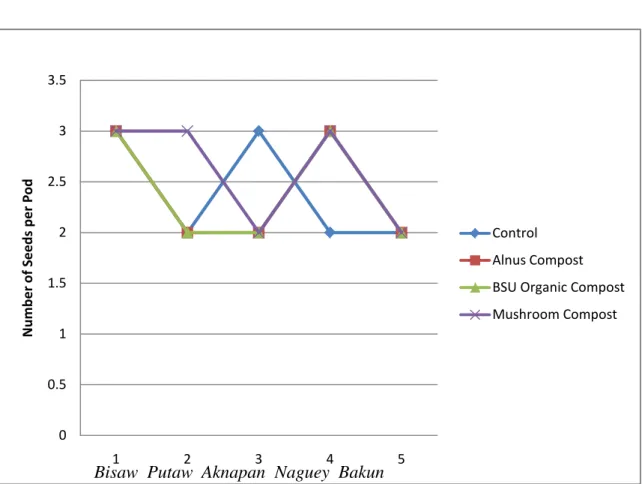
Interaction effect. Significant interaction was noted between peanut entries and organic fertilizers on seeds per pod. Among the combinations of five peanut entries and the different kinds of organic fertilizers used, Bisaw applied with the different kinds of organic fertilizers had the highest number of seeds per pod (Table 3 and Figure 2).
Figure 2. Interaction effect between five peanut entries and the use of different organic fertilizers
0 0.5 1 1.5 2 2.5 3 3.5
1 2 3 4 5
Number of Seeds per Pod
Bisaw Putaw Aknapan Naguey Bakun
Control Alnus Compost BSU Organic Compost Mushroom Compost
Number of Marketable Pods per Plot
Effect of entries. There were no significant differences observed among the five peanut entries on the number of marketable pods per plot. Numerically, Putaw entry showed the highest number of marketable seeds per plot.
Effect of organic fertilizer. No significant result was observed on the effect of the different kinds of organic fertilizers on number of marketable seeds (Table 3). Although, the plants applied with BSU-organic fertilizer had the highest number of marketable seeds per plot.
Interaction effect. Entries and organic fertilizers did not interact to affect the number of marketable pods per plot (Table 3).
Weight of Marketable Pods per Plot
Effect of entries. Among the five entries tested, there were no significant differences observed. Numerically, the entries Putaw, Aknapan and Bisaw had the highest weight of marketable pods per plot (Table 3).
Effect of organic fertilizer. The weight of marketable pods was not significantly different among the different kinds of organic fertilizers used though, plants applied with BSU- organic fertilizer produced the highest weight of marketable pods (Table 3).
Interaction effect. Entries and organic fertilizers did not significantly interact to affect the weight of marketable pods.
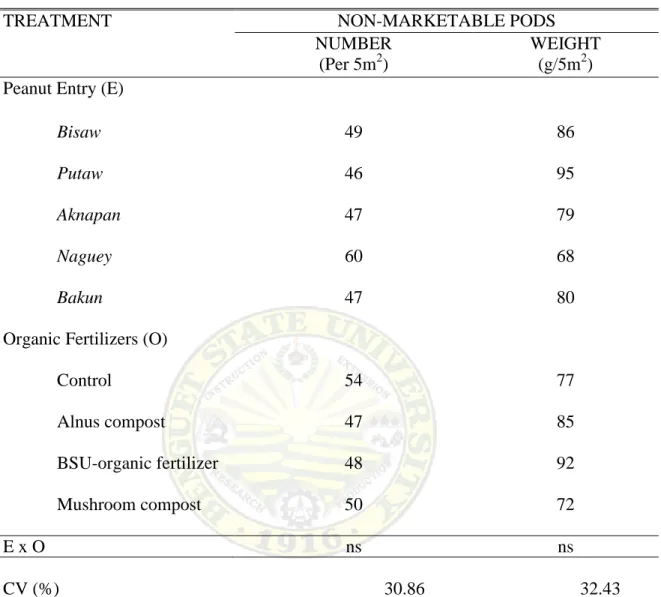
Number of Non-marketable Pods per Plot
Effect of entry. There were no significant differences observed on the number of non-marketable pods among the five entries. Bisaw had the highest number of non- marketable pods (Table 4).
Table 4. Number and weight of non-marketable pods per plot of five peanut entries
applied with different kinds of organic fertilizers
TREATMENT NON-MARKETABLE PODS
NUMBER (Per 5m2)
WEIGHT (g/5m2) Peanut Entry (E)
Bisaw 49 86
Putaw 46 95
Aknapan 47 79
Naguey 60 68
Bakun 47 80
Organic Fertilizers (O)
Control 54 77
Alnus compost 47 85
BSU-organic fertilizer 48 92
Mushroom compost 50 72
E x O ns ns
CV (%) 30.86 32.43
Effect of organic fertilizer. No significant differences were observed among the plants applied with the different organic fertilizers.
Interaction effect. Peanut entries and organic fertilizers did not significantly interact to affect the number of non-marketable pods per plot.
Weight of Non-marketable Pods per Plot
Effect of entry. The five entries had no significant differences observed on the weight of non-marketable pods per plot (Table 4). Putaw and Bisaw had the highest weight of non-marketable pods per plot. Naguey showed the lowest weight of non- marketable pods per plot.
Effect of organic fertilizer. No significant differences were observed among the plants applied with the different organic fertilizers. Numerically, plants applied with BSU-organic fertilizer had the highest weight of non-marketable pods per plot (Table 4).
Interaction effect. There was no significant interaction between the peanut entries and organic fertilizers on the weight of non-marketable pods per plot (Table 4).
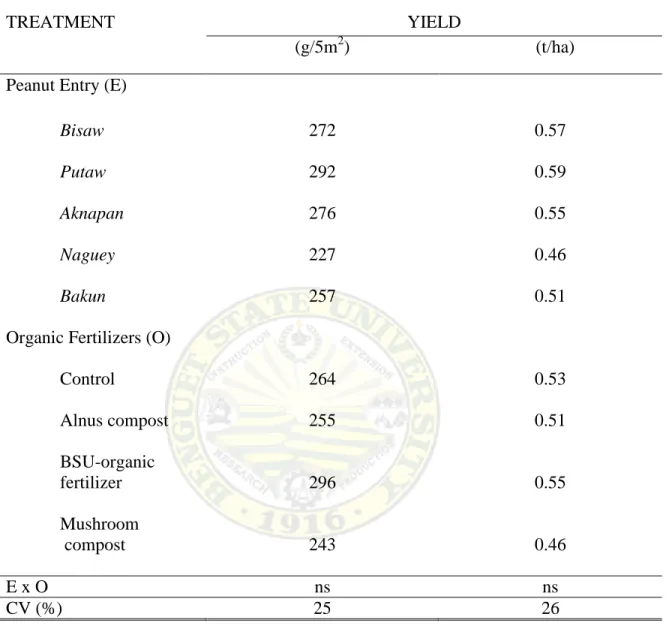
Total Plot Yield
Effect of entry. Results showed that there were no significant effect of entries on the total plot yield. Numerically, Putaw had the highest total plot yield (Table 5).
Generally, low yield was produced by the peanut entries. Low yield may be attributed to immature pods harvested. Plant were harvested as early as 110 DAP.
Effect of organic fertilizer. Total plot yield of plants applied with the different kinds of organic fertilizers did not differ significantly (Table 5). Plants applied with BSU- organic fertilizer produced the highest yield.
Interaction effect. No significant interaction effect was observed on the total yield between entry and organic fertilizers applied.
Computed Yield per Hectare (t/ha)
Effect of entry. Results showed no significant differences among the entries of peanut (Table 5). Naguey entry had the lowest yield with 46t/ha.
Table 5. Total and computed yield of five peanut entries applied with different kinds of organic fertilizers
TREATMENT YIELD
(g/5m2) (t/ha)
Peanut Entry (E)
Bisaw 272 0.57
Putaw 292 0.59
Aknapan 276 0.55
Naguey 227 0.46
Bakun 257 0.51
Organic Fertilizers (O)
Control 264 0.53
Alnus compost 255 0.51
BSU-organic
fertilizer 296 0.55
Mushroom
compost 243 0.46
E x O ns ns
CV (%) 25 26
Effect of organic fertilizer. Yield per hectare was not significantly influenced by the organic fertilizers applied. Computed yield ranged from 0.46 to 0.51 t/ha. Plants applied with BSU- organic compost produced the highest yield (Table 5).
Interaction effect. No significant interaction effect was observed on the yield per hectare between entry and organic fertilizers applied.
Reaction to Leaf Spot
Effect of entry. The response of entries on leaf spot was not significantly different. All the entries were rated as resistant.
Effect of organic fertilizer. The application of different organic fertilizers did not differ significantly on the reaction to leaf spot. All plants applied with organic fertilizers were rated as resistant.
Interaction effect. Entries and organic fertilizers did not significantly interact to affect the reaction to leaf spot.
Reaction to Leaf Miner Incidence
Effect of entries. Results show no significant differences among the peanut entries applied with the different kinds of organic fertilizers. All entries were rated as resistant.
Effect of organic fertilizer. Results show no significant differences on the leaf miner response of plants applied with organic fertilizers. All plants applied with organic fertilizers were rated as resistant.
Interaction effect. Results show that entries and organic fertilizer had no significant interaction to affect the leaf miner response.
SUMMARY, CONCLUSIONS AND RECOMMENDATIONS
Summary
This study was conducted from November 2010 to March 2011 Beleng-belis, Kapangan, Benguet, to: determine the growth and yield of peanut entries applied with different organic fertilizers; determine the best organic fertilizer that will produce significant yield on the peanut entries; and determine the interaction effect of peanut entry and organic fertilizer on the different parameters.
Among the peanut entries, Bisaw and Naguey significantly produced the highest number of seeds per pod. Putaw had the highest weight of marketable pods and yield per plot. Interaction between peanut entry and organic fertilizers was observed on number of seeds per pod. The other parameters however were not affected by the interaction of peanut entry and organic fertilizers applied. Numerically, the best combination based on marketable yield and total yield is entry Putaw entry applied with BSU- organic fertilizer.
Conclusions
Putaw is the highest producer of marketable pods. Plants applied with BSU- organic fertilizer produced the highest marketable and total yield. Bisaw applied with BSU- organic fertilizer is the best combination based on weight of marketable pods and total yield.
Recommendations
Based on the conditions of the study and early harvesting, Putaw entry could be recommended for peanut production under Beleng-belis, Kapangan, Benguet condition.
BSU-organic fertilizer can be applied for peanut production, however, cost should be
considered. Application of BSU-organic fertilizer on Bisaw entry is recommended, considering the cost to be incurred.
LITERATURE CITED
ABAN, B. 1992. Influence of various technique of drying on the storage of quality of peanut seeds. MS thesis. Benguet State University, La Trinidad, Benguet. P. 7.
ACIA. 1992. The seed production of peanut. Retrieved from http://www.seed/pubs/02/ 13 4 67/ chptr2.html.
ANDAYA, M. B. 1999. Cut flower quality of carnation grown at different media using BSU formulated compost. BS Thesis. Benguet State University, La Trinidad, Benguet. P. 21.
BALAOING, J. 2010. Personal conversation. Benguet State University, La Trinidad, Benguet.
BALAOING, J. and LAGMAN. 2003. Performance of selected horticultural crops using formulated vermicompost. BSU Research Journal 38: 28-34.
BUREAU OF AGRICULTURAL RESEARCH (BAR). 1995. Farming update.
Department of agriculture, Diliman, Quezon city, Philippines. (7):15.
COOKE, G. W. 1984. Some priorities for British soil science. Soil science. 30: 187-313.
FOLLET, R, H, 1981. Fertilizer and soil ammendments. USA: McGraw hill Publishing Inc. P.4
HAGAN, A. and W. FOSHEE. 2000. Producing peanut seeds. Retrieved from http://www.aces/edu/pubs/docs/A/ANR-06051.
HOQUE, A. M. 1988. Growth yield and seed quality of two snapbean varieties as effected by irrigation and frequency and fertilizer materials. Ph. D. Dissertation.
Benguet State University, La Trinidad, Benguet. P. 8.
KISOFEN, M. B. 2001. Growth and yield of peanut under La Trinidad condition. BS Thesis. Benguet State University, La Trinidad, Benguet. Pp. 3-4.
LADERA, J. C. and A. C. CLENUAR. 1993. Comparative effects of different organic fertilizers on the yield of root crops. International Rice Research Institute (IRRI), Philippines. Pp. 363-386.
LAUREAN, C. 2009. Benguet State University Biofertilizer Production. Shamag IV (7):6.
MARQUEZ, M.1988.Utilization of azolla as organic fertilizer. MS Thesis. Benguet State University, La Trinidad, Benguet.
PARNES, R. 1986. Organic and Inorganic Fertilizer. Woods and Agricultural Institute. P.
99.
PHILIPPINE COUNCIL FOR AGRICULTURE, FORESTRY AND NATURAL RESOURCES RESEARCH AND DEVELOPMENT (PCARRD). 2002. The Philippine recommend for peanut. Los Banos, Laguna. P. 14.
PHILIPPINE COUNCIL FOR AGRICULTURE, FORESTRY AND NATURAL RESOURCES RESEARCH AND DEVELOPMENT (PCARRD). 1992.
Sustainable through organic agriculture. Los Banos, Laguna. Pp. 8-9.
POINCELOT, R. 1980. Towards a More Sustainable Agriculture. AEI Publishing Company, Inc. Westport, Connecticut. P. 75.
QUILOY, G. I. 1995. Performance of young corn under two densities. BS thesis. Benguet State University, La Trinidad, Benguet. Pp 2-4.
REGMI, S.K. 1990. Varietal evaluation of promising lines and path coefficient in pole snap beans. Benguet State University, La Trinidad, Benguet. Pp. 1-3.
SILOY, J. 1991. The effect of frequency of fertilizer application on the growth and yield of pole snap beans (Phaseolus vulgaris). BS thesis. Benguet State University, La Trinidad, Benguet. Pp. 3-4
SUNIL, K.R. 1990. Varietal evaluation of promising lines and path coefficient of analysis in pole snap beans. Benguet State University, La Trinidad, Benguet. Pp. 4-5.
TAN, A.L.1985. Compost Making; the industrial life. UPCA Los Banos, Laguna. P. 8.
THOMPSON, H. and U. KELLY. 1987. Vegetable crops. New York: Mc GrawHill Books co. inc. Pp. 77-79.
VILLANUEVA, G. 2005. Evaluation of six peanut varieties during dry season and their response to paclobutrazol during wet season. Ph.D. Dissertation. Benguet State University (BSU), La Trinidad Benguet. P. 7.
WORK, I. and CAREW, B. 1995. Vegetable production and marketing. New York:
Willey Book Company. Pp. 103-114.
YOSHIDA, S. 1981. Fundamental of rice crop science. IRRI Los Banos, Laguna. P. 213.
APPENDICES
Appendix Table 1. Percent survival of five peanut entries as affected by organic fertile- zers at 110 DAP
TREATMENT BLOCK
TOTAL MEAN
I II III
V1TO T1
T2
T3 V2TO T1
T2
T3 V3TO
T1
T2 T3
V4TO
T1 T2 T3
V5TO
T1 T2
T3
28 89 65 28 43 69 85 75 83 79 66 65 59 73 85 80 86 69 81 65
86 91 63 94 75 88 88 90 75 100
80 80 60 100
89 100
94 100 100 84
68 44 75 81 79 74 83 25 74 74 50 85 80 68 60 80 39 66 54 0
182 224 203 203 197 231 256 190 232 253 196 230 209 241 234 260 219 235 235 149
60.66 74.66 67.66 67.66 65.66 77.00 85.33 63.33 77.33 84.33 65.33 76.66 69.66 80.33 78.00 86.66 73.00 78.33 78.33 49.66 ANALYSIS OF VARIANCE
SOURCE OF VARIATION
DEGREE OF FREEDOM
SUM OF AQUARES
MEAN SQUARE
COMPUTED F
TABULAR F
5% 1%
Replication Treatment
2 19
6154.53 3724.85
3077.26
196.04 0.54ns 1.87 2.44
Factor (a) 4 819.60 204.90 0.57ns 2.62 3.86
Factor (b) 3 852.45 284.15 0.78ns 2.85 4.34
A x B 12 2052.45 171.06 0.45ns 2.02 2.69
Error 38 13684.80 360.12
TOTAL 59
ns- Not significant CV= 26.04%
TWO-WAY TABLE
ENTRY
ORGANIC FERTILIZERS
TOTAL MEAN CONTROL ALNUS
BSU- ORGANIC FERTILIZER
MUSHROOM COMPOST
Bisaw 60.66 74.66 67.66 67.66 270.64 90.21
Putaw 65.66 77.00 85.33 63.33 291.32 97.10
Aknapan 77.33 84.33 65.33 76.66 301.76 100.58
Atok 69.66 80.33 78.00 86.66 314.65 104.88
Bakun 73.00 78.33 78.33 49.66 179.32 93.10
TOTAL 222.654
MEAN 485.87
Appendix Table 2. Initial height of five peanut entries as affected by organic fertilizers at 30 DAP
TREATMENT BLOCK
TOTAL MEAN
I II III
V1TO
T1
T2 T3
V2TO
T1 T2 T3
V3TO
T1 T2
T3
V4TO T1
T2
T3 V5TO T1
T2
T3
4.25 5.85 6.80 5.05 4.35 5.50 6.0 5.15 5.30 4.45 5.35 4.45 4.35 6.05 6.30 5.50 5.10 5.35 6.05 4.80
5.100 5.00 5.30 4.95 5.15 5.20 5.05 4.55 5.05 4.70 5.60 4.75 4.35 6.10 5.50 5.15 5.30 5.40 5.67 5.50
5.10 4.65 5.95 4.85 5.90 5.65 5.30 5.20 5.10 5.60 6.00 5.15 6.00 6,15 5.85 5.75 5.20 6.50 6.26 0.00
14.45 15.50 18.05 14.85 15.40 16.35 16.35 14.90 15.45 14.75 16.95 14.35 14.70 18.30 17.65 16.40 15.60 17.25 17.97 10.30
4.81 5.16 6.01 4.95 5.13 5.45 5.45 4.96 5.15 4.91 5.65 4.78 4.90 6.10 5.88 5.46 5.20 5.75 5.99 3.43 ANALYSIS OF VARIANCE
SOURCE OF VARIATION
DEGREE OF FREEDOM
SUM OF SQUARES
MEAN SQUARE
COMPUTED F
TABULAR F
5% 1%
Replication Treatment
2 19
0.25 20.74
0.12
1.09 1.56ns 1.87 2.44
Factor (a) 4 1.91 0.47 0.68ns 2.62 3.86
Factor (b) 3 10.10 3.36 4.81** 1.85 4.24
A x B 12 8.72 0.72 1.04ns 2.02 2.69
Error 38 26.60 0.70
TOTAL 59 47.60
ns - Not significant CV= 15.91%
** - Highly significant
TWO-WAY TABLE
ENTRY
ORGANIC FERTILIZERS
TOTAL MEAN CONTROL ALNUS
BSU- ORGANIC FERTILIZER
MUSHROOM COMPOST
Bisaw 4.81 5.16 6.01 4.95 20.93 5.2
.
Putaw 5.13 5.45 5.45 4.96 20.99 5.3
Aknapan 5.15 4.91 5.65 4.78 20.49 5.1
Atok 4.9 6.1 5.88 5.46 22.34 5.6
Bakun 5.2 5.75 5.99 3.43 20.37 5.1
TOTAL 21
MEAN 4.2 5.3
Appendix Table 3. Final height of five peanut entries as affected by organic fertilizers at 110 DAP
TREATMENT BLOCK
TOTAL MEAN
I II III V1TO
T1
T2
T3 V2TO
T1
T2 T3 V3TO
T1
T2 T3
V4TO
T1 T2
T3
V5TO T1 T2
T3
19.84 20.70 29.93 22.90 23.05 29.35 29.05 24.88 26.30 25,05 27.20 22.50 24.80 26.75 29.85 22.50 26.69 24.60 29.20 25.45
22.31 25.96 23.99 24.55 25.60 24.92 24.89 24.74 24.68 21.64 24.00 26.26 23.92 27.91 33.36 29.40 30.73 29.31 29.12 27.40
22.75 24.83 35.65 31.40 27.05 29.85 31.94 28.91 28.28 21.11 25.25 27.11 32.90 32.23 33.36 21.50 28.46 26.76 0.00 28.71
64.90 71.49 89.57 78.85 75.70 84.12 85.88 78.53 79.26 67.80 76.45 75.87 81.62 86.89 96.57 73.40 85.88 80.67 87.03 52.85
21.63 23.83 29.85 26.28 25.23 28.04 28.62 26.17 26.42 22.60 25.48 25.29 27.20 28.96 32.19 24.46 28.62 26.89 29.01 17.61 ANALYSIS OF VARIANCE
SOURDE OF VARIATION
DEGREE OF FREEDOM
SUM OF SQUARE
MEAN SQUARE
COMPUTED F
TABULAR F
5% 1%
Replication Treatment
2 19
23.41 486.15
11.70
25.58 1.03ns 1,03 2.44
Factor (a) 4 96.04 24.01 0.97ns 2.62 3.86
Factor (b) 3 11.55 3.85 0.15ns 1.85 4.34
A x B 12 378.55 31.54 1.27ns 2.02 2.69
Error 38 942.97 24.81
TOTAL 59 1452.54
ns- Not Significant CV= 18.99%
TWO-WAY TABLE
ENTRY
OGANIC FETILIZERS
TOTAL MEAN CONTROL ALNUS
BSU- ORGANIC FERTILIZER
MUSHROOM COMPOST
Bisaw 21.63 23.83 29.85 26.28 101.59 25
.
Putaw 25.23 28.04 28.62 26.17 108.06 27
Aknapan 26.42 22.6 25.48 25.29 99.79 25
Atok 27.20 28.96 32.19 24.46 112.81 28
Bakun 28.62 26.89 29.01 17.61 102.13 26
TOTAL 524 132
MEAN 105 26
Appendix Table 4. Number of seeds per pods of five peanut entries as affected by organic fertilizers
TREATMENT BLOCK
TOTAL MEAN
I II III
V1TO
T1
T2 T3
V2TO
T1 T2 T3
V3TO
T1 T2
T3
V4TO T1
T2
T3 V5TO T1
T2
T3
3 3 3 3 2 2 2 3 2 3 3 2 2 3 3 3 3 3 3 3
3 3 3 2 2 2 2 3 3 2 2 2 3 3 3 3 2 2 2 2
3 3 3 3 2 2 2 2 3 2 2 2 2 3 2 3 2 2 2 2
9 9 9 8 6 6 6 8 9 7 7 6 7 9 8 9 7 7 7 7
3 3 3 3 2 2 2 3 3 2 2 2 2 3 3 3 2 2 2 2
ANALYSIS OF VARIANCE SOURCE OF
VARIATION
DEGREE OF FREEDOM
SUM OF SQUARE
MEAN SQUARE
COMPUTED F
TABULAR F
5% 1%
Replication Treatment
2 19
1.23 5.56
.61 2.56
Factor (a) 4 .183 1.39 11.09** 2.62 3.86
Factor (b) 3 3.23 0.06 .48ns 2.85 4.34
A x B 12 4.67 .26 2.14* 2.02 2.69
Error 38 3.56 .12
TOTAL 59 14.98
ns- Not Significant CV= 14.07%
** - highly significant
* - Significant
TWO-WAY TABLE
ENTRY
ORGANIC FERTILIZERS
TOTAL MEAN CONTROL ALNUS
BSU- ORGANIC FERTILIZER
MUSHROOM COMPOST
Bisaw 3 3 3 3 12 3
.
Putaw 2 2 2 3 9 2
Aknapan 3 2 2 2 10 2
Atok 2 3 3 3 11 3
Bakun 2 2 2 2 10 2
TOTAL 50 13
MEAN 10 3
Appendix Table 5. Number of marketable seeds of five peanut entries as affected by organic fertilizers
TREATMENT BLOCK
TOTAL MEAN
I II III
V1TO
T1
T2 T3
V2TO
T1 T2 T3
V3TO
T1 T2
T3
V4TO T1
T2
T3 V5TO T1
T2
T3
82 194 123 125 122 125 202 125 113 108 77 108
60 116
91 75 125
67 103 128
68 67 107
81 111
84 119
81 80 80 67 73 66 80 91 64 103
78 85 84
55 37 78 32 5 65 65 32 74 61 61 83 27 55 33 60 44 64 80 0
205 298 308 238 238 274 386 238 267 249 205 264 153 251 215 199 272 209 268 212
68 99 103
79 79 91 129
79 89 83 68 88 51 84 72 66 91 70 89 71 ANALYSIS OF VARIANCE
SOURCE OF VARIATION
DEGREE OF FREEDOM
SUM OF SQUARE
MEAN SQUARE
COMPUTED F
TABULAR F
5% 1%
Replication Treatment
2 19
39592.13 15582.82
19796.06
820.12 1.28ns 1.87 2.44
Factor (a) 4 4603.90 1150.97 1.79ns 2.62 3.86
Factor (b) 3 2717.38 905.79 1.41ns 1.85 4.34
A x B 12 8261.03 688.41 1.07ns 2.02 2.69
Error 38 24392.53 641.90
TOTAL 59 79566.98
ns- Not Significant CV= 30.72%
TWO-WAY TABLE
ENTRY
ORGANIC FERTILIZERS
TOTAL MEAN CONTROL ALNUS
BSU- ORGANIC FERTILIZER
MUSHROOM COMPOST
Bisaw 68 99 103 79 350 87
.
Putaw 79 91 129 79 379 95
Aknapan 89 83 68 88 328 82
Atok 51 84 72 66 273 68
Bakun 91 70 89 71 320 80
TOTAL
.
427 461 384 1650 412
MEAN 142 154 128 330 83
Appendix Table 6. Weight of marketable seeds of five peanut entries as affected by organic fertilizers
TREATMENT BLOCK
TOTAL MEAN
I II III
V1TO
T1
T2 T3
V2TO
T1 T2 T3
V3TO
T1 T2
T3
V4TO T1
T2
T3 V5TO T1
T2
T3
200 220 330 135 275 270 205 270 290 230 295 250 150 140 245 190 322 180 240 300
180 140 260 120 280 200 260 140 200 180 180 175 180 200 240 160 240 130 200 190
100 170 170 200 120 145 150 060 150 145 150 170 050 140 065 150 090 062 165 0.00
480 530 760 455 675 615 615 470 640 555 535 595 380 480 550 500 652 372 605 490
160 176 253 151 225 205 205 156 213 185 178 198 126 160 183 166 217 124 201 163 ANALYSIS OF VARIANCE
SOURCE OF VARIATION
DEGREE OF FREEDOM
SUM OF SQUARE
MEAN SQUARE
COMPUTED F
TABULAR F
5% 1%
Replication Treatment
2 19
.12 .16
.06 .87
25.77ns 1.12ns
2.42 2.42
Factor (a) 4 .01 .03 1.19ns 1.86 2.42
Factor (b) 3 .01 .04 1.86ns 1.86 2.42
A x B 12 .03 .03 1.27ns 1.86 2.42
Error 38 09 .02
TOTAL 59 .27
ns- Not significant CV= 26.81%
TWO-WAY TABLE
ENTRY
ORGANIC FERTILIZERS
TOTAL MEAN CONTROL ALNUS
BSU- ORGANIC FERTILIZER
MUSHROOM COMPOST
Bisaw 16 176 253 151 740 16
.
Putaw 225 205 205 156 791 19
Aknapan 213 185 178 198 774 94
Atok 126 16 183 166 635 16
Bakun 217 124 201 163 705 18
TOTAL 3645 163
MEAN 729 33
Appendix Table 7. Number of non-marketable pods per plot of five peanut entries as affected by organic fertilizers
TREATMENT BLOCK
TOTAL MEAN
I II III
V1TO
T1
T2 T3
V2TO
T1 T2 T3
V3TO
T1 T2
T3
V4TO T1
T2
T3 V5TO T1
T2
T3
53 20 40 29 19 19 17 37 45 39 48 36 64 17 45 36 50 47 34 32
35 53 31 63 51 45 40 73 41 64 34 53 64 61 49 89 46 70 50 45
58 72 71 66 58 40 60 97 60 42 56 50 88 71 89 49 77 56 61 0
146 145 142 158 128 104 117 207 146 145 138 139 216 149 183 174 173 173 145 77
47 48 47 53 43 35 39 69 49 48 46 46 72 50 61 58 58 58 48 26 ANALYSIS OF VARIANCE
SOURCE OF VARIATION
DEGREE OF FREEDOM
SUM OF SQUARE
MEAN SQUARE
COMPUTED F
TABULAR F
5% 1%
Replication Treatment
2 19
6330.53 6615.25
3165.26
348.17 1.46ns 1.87 2.44
Factor (a) 4 1578.66 394.66 1.65ns 2.62 3.86
Factor (b) 3 352.05 117.35 0.49ns 1.85 4.34
A x B 12 4684.53 390.37 1.63ns 2.02 2.69
Error 38 9076.80 238.86
TOTAL 59 22022.58
ns- Not significant CV= 30.86%
TWO-WAY TABLE
ENTRY
ORGANIC FERTILIZERS
TOTAL MEAN CONTROL ALNUS
BSU- ORGANIC FERTILIZER
MUSHROOM COMPOST
Bisaw 49 48 47 53 58 14
.
Putaw 43 35 39 69 58 14
Aknapan 49 48 46 46 58 14
Atok 72 50 61 58 58 14
Bakun 58 58 48 26 58 14
TOTAL 189 72
MEAN 38 14
Appendix Table 8. Weight of non-marketable pods per plot (g) of five peanut as affected by organic fertilizers
TREATMENT BLOCK
TOTAL MEAN
I II III
V1TO
T1
T2 T3
V2TO
T1 T2 T3
V3TO
T1 T2
T3
V4TO T1
T2
T3 V5TO T1
T2
T3
82 94 123
75 122 125 202 125 113 108 77 108
60 116
91 75 125
67 103 128
68 67 107
59 111
84 119
81 80 80 67 73 66 80 91 64 103
78 85 84
55 37 78 91 5 65 65 32 74 61 61 83 27 55 33 60 44 64 80 0
205 295 308 225 238 274 386 238 267 249 205 264 153 251 215 199 272 209 268 212
68 98 102
75 79 91 128
79 89 83 68 88 51 83 71 66 90 69 89 70 ANALYSIS OF VARIANCE
SOURCE OF VARIATION
DEGREE OF FREEDOM
SUM OF SQUARE
MEAN SQUARE
COMPUTED F
TABULAR F
5% 1%
Replication Treatment
2 19
.03 .16
.01 .87
26.96ns 1.12ns
Factor (a) 4 .05 .01 1.64ns 1.86 2.42
Factor (b) 3 .04 .01 1.72ns 1.86 2.42
A x B 12 .8 .01 .99ns 1.86 2.42
Error 38 .02 .01
TOTAL 59 .081
ns- Not significant CV= 32.43%
TWO-WAY TABLE
ENTRY
ORGANIC FERTILIZERS
TOTAL MEAN CONTROL ALNUS
BSU- ORGANIC FERTILIZER
MUSHROOM COMPOST
Bisaw 68 98 102 75 343 100
.
Putaw 79 91 128 79 377 100
Aknapan 89 83 68 88 328 100
Atok 51 83 71 66 271 100
Bakun 90 69 89 70 318 100
TOTAL 1637 500
MEAN 300 100
Appendix Table 9. Total plot yield of five peanut entries as affected by organic fertilizers by organic fertilizers
TREATMENT BLOCK
TOTAL MEAN
I II III
V1TO T1 T2
T3
V2TO T1
T2
T3 V3TO
T1
T2 T3 V4TO
T1
T2 T3
V5TO
T1 T2
T3
282 414 453 210 397 395 407 950 403 338 282 358 210 256 336 265 447 247 343 428
248 207 367 179 391 284 379 221 280 260 247 248 246 280 331 224 343 208 285 274
155 207 248 291 125 210 215 920 224 206 211 253 770 195 980 210 134 126 245 0.00
685 825 1.06 680 913 889 1.00 708 907 804 740 859 533 731 765 699 924 581 873 702
228 275 356 226 304 296 333 236 302 268 246 286 177 243 255 233 308 193 291 234 ANALYSIS OF VARIANCE
SOURCE OF VARIATION
DEGREE OF FREEDOM
SUM OF SQUARE
MEAN SQUARE
COMPUTED F
TABULAR F
5% 1%
Replication Treatment
2 19
.28 .14
Factor (a) 4 .02 .07 1.61ns 2.62 3.86
Factor (b) 3 .0 .08 1.79ns 2.85 4.34
A x B 12 .06 .05 1.24ns 2.02 2.69
Error 38 .16 .04
TOTAL 59 .564
ns- Not significant CV= 25.03%
TWO-WAY TABLE
ENTRY
ORGANIC FERTILIZERS TOTAL MEAN
CONTROL ALNUS BSU- ORGANIC FERTILIZER
MUSHROOM COMPOST
Bisaw 228 275 356 226 1085 271
.
Putaw 304 296 333 236 1169 292
Aknapan 302 268 246 286 1102 276
Atok 177 243 255 233 908 227
Bakun 308 193 291 234 1026 257
TOTAL 5290 1323
MEAN 1058 265
Appendix Table 10. Computed yield per hectare of five peanut as affected by organic fertilizers
TREATMENT BLOCK
TOTAL MEAN
I II III
V1TO
T1
T2 T3
V2TO
T1 T2 T3
V3TO
T1 T2
T3
V4TO T1
T2
T3 V5TO T1
T2
T3
564 828 906 420 794 790 814 794 806 676 564 716 420 512 672 530 894 494 686 856
496 414 734 358 782 568 758 442 560 520 494 496 492 560 662 448 686 416 570 548
310 414 828 582 250 420 430 184 448 412 422 506 154 390 196 420 268 252 490 0.00
1370 1656 2468 1360 1826 1778 2002 1420 1814 1608 1480 1718 1066 1462 1530 1422 1848 1162 1746 1404
456 552 822 453 608 592 667 473 604 536 493 572 355 487 510 474 616 387 582 468 ANALYSIS OF VARIANCE
SOURCE OF VARIATION
DEGREE OF FREEDOM
SUM OF SQUARE
MEAN SQUARE
COMPUTED F
TABULAR F
5% 1%
Replication Treatment
2 19
1.01 .50
Factor (a) 4 0.13 .03 1.76ns 2.62 3.86
Factor (b) 3 .14 .04 2.49ns 2.85 4.34
A x B 12 .35 .02 1.57ns 2.02 2.69
Error 38 .71 .01
TOTAL 59 2.53
ns- Not significant CV= 25.61%
TWO-WAY TABLE
ENTRY
ORGANIC FERTILIZERS
TOTAL MEAN CONTROL ALNUS
BSU- ORGANIC FERTILIZER
MUSHROOM COMPOST
Bisaw .456 .552 .822 .453 2.283 .6
.
Putaw .608 .592 .667 .473 2.34 .6
Aknapan .604 .536 .493 .572 2.21 .6
Atok .355 .487 .51 .474 1.83 .5
Bakun .616 .387 .582 .468 2.1 .5
TOTAL 10.763 2.8
MEAN 2.1 .56