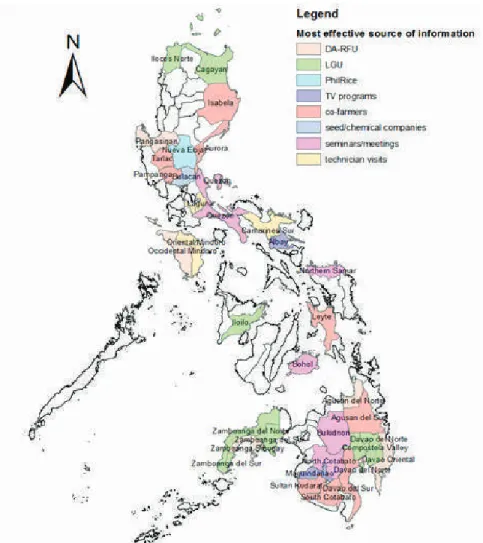
The Socioeconomics Division (SED) conducts socioeconomic and policy research and advocacy under the Office of the Deputy Executive Director for Development of the Philippine Rice Research Institute. In March 2012, the Department of Socio-Economics conducted the fourth round of the Rice-Based Farm Household Survey (RBFHS), which captured information not only on social and economic profiles of farmers, but also reported technology awareness and adoption of 2,500 sample farmers from 33 countries. major rice producing provinces in the Philippines. In the case of PhilRice's rice information service via text messages and the Internet, less than 30% of farmers were aware of these services and less than 10% tried to obtain information through PhilRice's text messages and the OpAPA website.
The most used rice cultivation methods/technologies are as follows: threshing palay 0-1 day after harvest (95%), harvest palay when 80% of the grains are ripe (73%), no high/low soil patches after leveling (76%), synchronous planting (50%), and not burning rice straw in the field (49%). As in the case of walking hand tractors, almost half of the farmers in the sample (46%) are aware of it, but only 8% adopt the technology. While 88% of the farmers know about organic fertilizers, only 27% of them used to spread organic fertilizers.
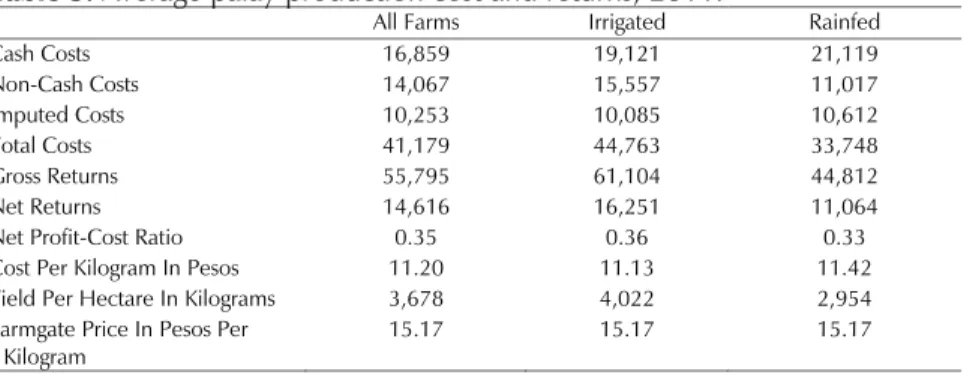
Reaper, one of the crop management methods mentioned, is known to 40% of farmers, but only 7%. An electronic copy of the compiled data will be available at the SED and these data will be published on the PhilRice website through the DBMP. Cash costs were calculated at 58% of total costs due to high costs of hired labor, fertilizers, pesticides, repairs, and fuel and oil.
In the case of the special palay, retail price is PhP34.93/kg while the farm gate price is PhP13.96 while the wholesale price is a little lower than the retail price.
Adoption and Impact Evaluation of Rice R&D Products and Development Projects
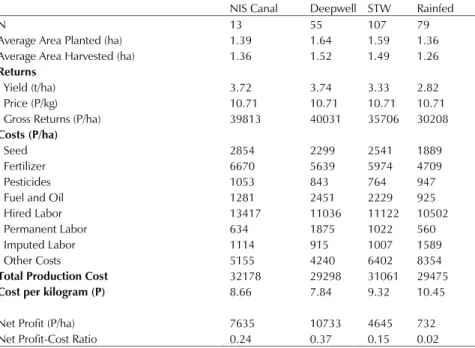
The same trend goes with the regular price, the retail price is PhP 31.31/kg, the farm price is PhP 13.16/kg and the wholesale price is PhP 29.15/kg. On the other hand, the average yield of STW users is 0.5 t/ha higher than pure rainfed farmers. In terms of profitability, the use of DPIS for the wet season in the case of Tarlac seems to result in the highest net profit, followed by those who used the NIS channel.
This study aims to determine the achievement of the fifth phase of the Technical Cooperation Project (TCP) between PhilRice and JICA. A group of non-participants was also monitored to be used as a benchmark for measuring the changes among beneficiaries. In 2012, baseline data was collected from 255 beneficiaries, but only 241 beneficiaries were monitored in 2013 since some.
Nevertheless, the average gross income of non-participants decreased by only 1% due to the higher price of paddy rice faced by non-participants in 2013. The production cost of a kilogram of paddy rice among beneficiaries increased from PhP 12.20 to PhP 13. 91, while non-participants increased from PhP 12.55 to PhP 15.98. Beneficiaries received higher returns over variable costs at PhP 10.00/kg per kilogram in 2013 compared to PhP 7.17 in 2012 due to a smaller increase in unit production costs.
Fertilizer costs per hectare of beneficiaries and non-participants both increased due to higher fertilizer application. Nevertheless, the increase in fertilizer applied by beneficiaries is greater than that of non-participants. The TCP aims for 70% of beneficiaries to adopt at least 15 technologies and good practices on rice production.
During the baseline period, none of the 20 rice technologies promoted by the TCP were adopted by 70% of the beneficiaries and non-participants. One year after the training, more than 70% of the beneficiaries had already adopted 11 out of 20 rice technologies. Only the good practice on harvesting was accepted by more than 70% of non-participants during the monitoring period.
Policy Research and Advocacy (PRA)
This publication discussed the nature of rice smuggling, the negative effects of smuggling, current government anti-smuggling measures, traders' reasons for smuggling, and suggestions for its long-term solution in the country. Regarding concerns about the marketing of rice production inputs, a compendium of the list of rice and value-added rice products as well as their applications was prepared. Area of seed production, productivity and preferred varieties of seed growers were some of the areas discussed.
The specific objectives of the activity were: presentation of the status of supply and use of rice in the country; to identify the factors that influence the consumption of rice per capita; to determine the factors that affect the change in the demand for rice; Duran, Officer-in-Charge of the Agricultural Accounts and Statistical Indicators Division (AASID), DA-Bureau of Agricultural Statistics (BAS). Merceditas Sombilla, Director of the Agriculture, Natural Resources and Environment Staff of the National Economic and Development Authority (NEDA).
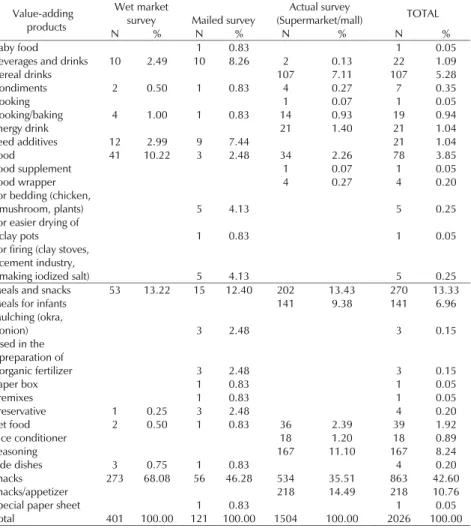
These data were used to inventory the current and potential uses of rice and its value-added products and to prepare a list of import and export rice products by the concerned agencies. Most of the samples came from Central Luzon, Northern Mindanao, Cagayan Valley and the Ilocos regions. Specifically, most of the wet market survey samples were collected in Cagayan Valley.
Northern Mindanao and Davao regions, while for the mailed survey samples, they mostly came from the Central Luzon and Ilocos regions. The results of the mailed survey show that the top five value-added rice products from three types of outlets were snacks, meals and snacks, snacks/. The results also show that the majority of rice products were snacks, meals and snacks, and drinks and beverages (coffee and wine).
How have the market structure and behavior, constraints and problems affected the performance of the rice seed market? This means that the seed production of the four largest seed growers in the region was not large enough to dominate the inbred rice seed industry. Note that two of the top three NSIC varieties (NSIC Rc216 and NSIC Rc160) were bred by the Philippine Rice Research Institute (PhilRice).
In the marketing of rice seeds, most of the seed growers placed their products in their common outlet, such as seed centers. This is one of the areas that can be looked at to improve the use of quality seed in the region.
Special Studies
The non-existence of any trading point in the area signals the difficulty of seed trading for producers and the inaccessibility of quality seed for farmers. With a small number of seed growers coupled with the lack of seed centers in Zambales, farmers complained about the scarcity and inaccessibility of quality seeds in the area. Problems in seed production and marketing commonly reported by seed growers, market as seed centers and commercial farmers in Region 3 include seed/variety mix, low germination rate, lack of proper labeling, poor packaging, availability and inaccessibility. of seeds.
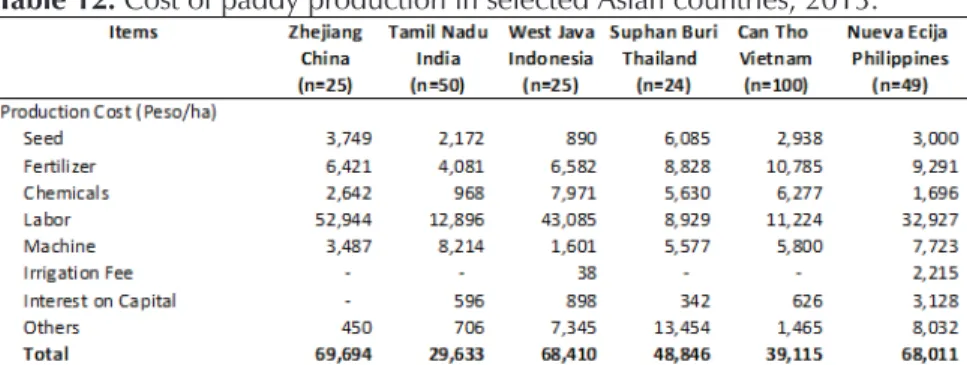
Some experiments for Nueva Ecija were carried out in the WABAL and the resulting agronomically relevant variables were used in the statistical estimation of yield. The purpose of this study is to compare the costs of rice production in irrigated and intensively cultivated areas in six countries in Asia, including the Philippines. The Philippines ranks fourth in production per hectare (or yield) with 6.38 tons/ha.
Labor costs in the Philippines are more than double those of the major rice exporting countries – Vietnam, Thailand and India (Table 12). Crop establishment through transplanting method is another labor intensive activity in the Philippines that adds to the labor cost. Lower fertilizer costs in China and Indonesia despite higher nitrogen fertilizer applications than in the Philippines (Table 2) indicate lower prices of nitrogen fertilizers in these two countries.
Similarly, despite the similar application of nitrogen fertilizers in the Philippines, lower fertilizer costs in India also imply cheaper fertilizers in India. On the other hand, initial data on costs and fertilizer use indicate the same or higher fertilizer prices in Thailand and Vietnam than in the Philippines. Machines commonly rented in the Philippines include two-wheel tractors for land preparation and a thresher for paddy threshing.
There are few possible reasons for high rental costs: the high costs of purchasing machines and the high costs of fuel and oil that are integrated into the rental price. Although irrigation costs in the Philippines account for only 3% of production costs, only Philippine farmers pay to use irrigation water from state-run canals. This study aims to analyze how the adoption of good agricultural practices in rice farming can complement the improvement of agricultural insurance in the Philippines.
Sixty-seven percent of farmers who did not benefit from crop insurance from 2007-2011 stated that they would not want to insure their crops in the future. On the other hand, PhilRice-Midsayap only had access to PhilRice due to the peace and order situation in the area that discouraged participation by individual farmers, cooperatives or agricultural corporations.