A special problem entitled "DynastyMap: An Interactive Data Visualization Tool on Political Dynasties in the Philippines" prepared and submitted by Lean Godffrey M. Rada in partial fulfillment of the requirements for the degree of Bachelor of Science in Computer Science has been reviewed and is recommended for acceptance. Accepted and approved as partial fulfillment of the requirements for the Bachelor of Science in Computer Science degree.
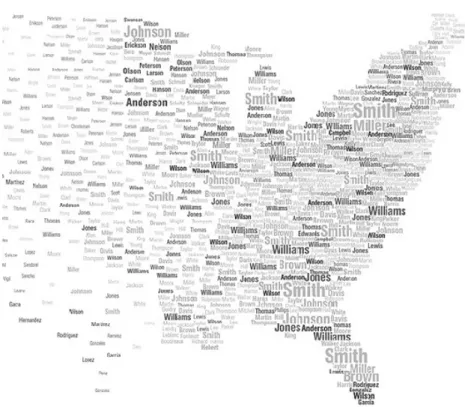
The relationship between the dominance of political dynasties and other aspects of the country, such as poverty, can be studied using data visualization. In this paper, DynastyMap, a web-based map data visualization system was introduced as a tool for studying data related to political dynasties in the Philippines. The choropleth map and label map were used as data visualization methods, with the choropleth showing different data sets and the label map showing dynasty data.
Using these visualizations with the right datasets, DynastyMap can be an effective tool for studying or presenting political dynasty data in the Philippines.
Background of the Study
Interaction and animation can provide more engagement with the information, enable easier multidimensional data representation, and can give viewers a clearer perspective on the data. Animations can be used for temporal data to provide an overview of the dynamics and trends in the data. Interactivity can be used for data exploration, such as focusing on parts of the data (zooming in).
Statement of the Problem
Objectives of the Study
An example of interactive visualization software is Gapminder's Trendalyzer, which produces animated and interactive bubble charts. a) Upload their geographic data of the Philippines. Choropleth map for visualizing any variable selected from user-uploaded Philippines geographic data and any of the dynasty indicator variables.
Significance of the Project
Scope and Limitations
The system only accepts quantitative or numerical data sets from the users, such as population and employment rate. The system does not take into account political affiliations among family members, such as party affiliations or inter-family divisions. For example, if two individuals belong to the same family but are rivals of each other, they are still considered members of the same political dynasty.
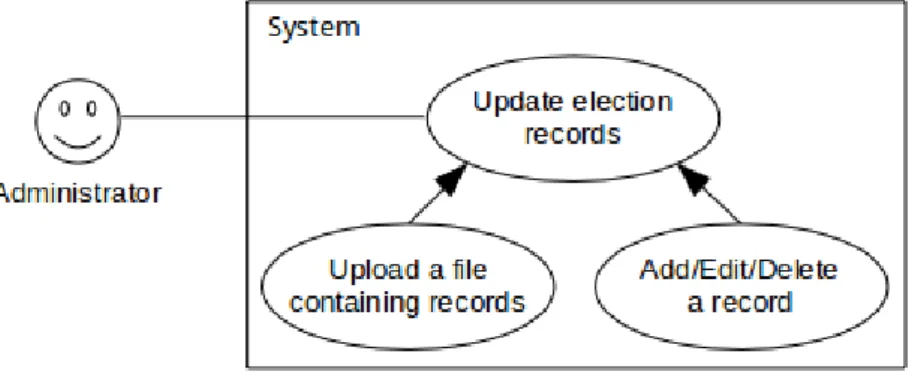
The administrators will provide the election data they will compile from COMELEC and the users will provide their own user data sets. If parts of the election reports are missing, these missing officials will not be included in the visualization.
Assumptions
Review of Related Literature 6
The interface provides visualizations for various global data such as land cover, elevation, soil types, ecosystems and climate maps. It used self-organizing maps to visualize patterns in data and also shows the geographic representation of data through GIS visualization. The software uses several online sources such as ProMED, World Health Organization, Google News and others to collect its data.
The system provides various visualizations that display information in different contexts, such as the geographic regions visited by a given user, the top topics and users connected to a particular region, and the top geographic topics associated with a term. The system mines microblog data using the Twitter Streaming API, processes the data using clustering, and visualizes the resulting information on a map through a web interface using the Google Maps API. It provides a web interface for exploring the timeline and location of Twitter events.
It is used to make thematic maps, such as bivariate maps, choropleth maps, proportional symbol maps, point density maps, and cartograms. 23] Specific definitions of political dynasties vary in details, such as what constitutes a family, how far back in generations individuals may be related, how distant the relationships may be, whether physical distance or blood distance, and consideration of family relationships. different from bloodline. relationships.
Dynastic measures
Generally, a political dynasty is defined as "a family or group that maintains power for several generations". The Anti-Political Dynasty Bill in the Philippines defines a political dynasty as existing when two or more related persons "concurrently run for elected public office within the same municipality, city or province", and also when a person is related to an incumbent " holds or holds an elective office concurrently with the incumbent within the same province" or succeeds the elective official. Related persons are defined as one person being the spouse of another, being a brother or sister, and being a descendant or descendant of direct (in other words, the second civil degree of connection or affinity).
For example, if six dynastic officials are elected in a province, and four of them belong to the same dynasty, while the other two belong to a different dynasty, then the DYNLAR value for this case is four (4). This is essentially “the sum of the squares of the total positions of each political dynasty in each province.” For example, suppose there are three dynasties in a province, with seven dynastic officials elected. Four officials are from one dynasty, two are from the second dynasty, and one is from the third dynasty.
DYNHERF is "a more nuanced indicator of the concentration of political power because it will give a correspondingly greater weight to the political dynasties with larger shares of the total positions (while also considering the other "fat" dynasties in the province)." . For this project, the indicators were adapted to the regional, municipal and barangay levels, for different years, and to create a per dynasty indicator.
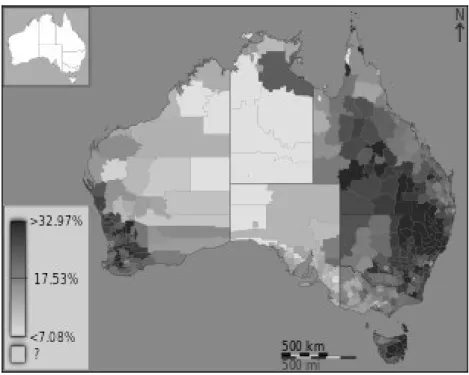
Choropleth map
Tag cloud
The label map showed the relative prominence and local concentrations of business inquiries through the use of labels overlaid on a geographic map. HEALTH GeoJunction is a web application for finding scientific publications with geographic, temporal and thematic filtering. Geographical user interests were mined from Twitter users using their visited locations and mentioned locations.
Dengue-GIS is a web-based surveillance geographic information system for the collection, analysis, and reporting of dengue cases in Mexico. The system implements epidemiological and entomological surveillance tools and functionalities for integrated analyzes of geo-referenced input data. The system generates visualizations showing the geographic distribution of cases and transmission risk maps.
Indiemapper is a geographic data visualization tool that allows users to upload their own datasets for visualization. It displays words or phrases in different font sizes to show the relative frequency or weight of each word or phrase.
Philippine political structure
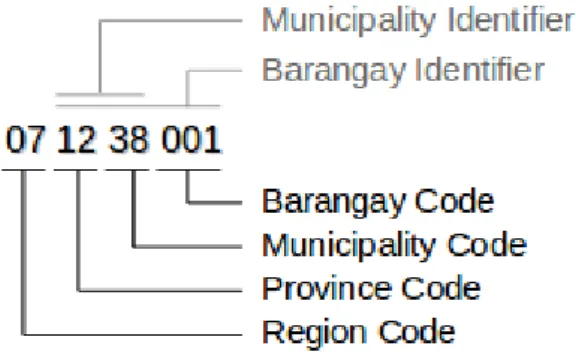
The Philippine Standard Geographic Code (PSGC) [30] is the standard for coding geographic areas of the Philippines. One of the uses of PSGC is the development of databases and geographic information systems. In the case of cities independent of the province, in addition to the code of the municipality, the independent city is also assigned its own code of the province, i.e. an independent city has its own "province". For example, the city of Cotabato is coded as 129804000.
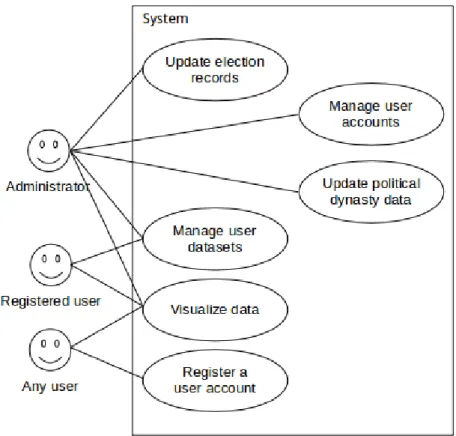
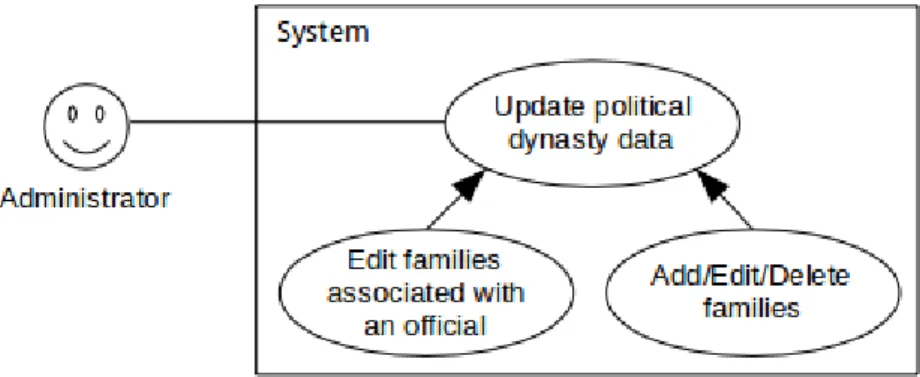
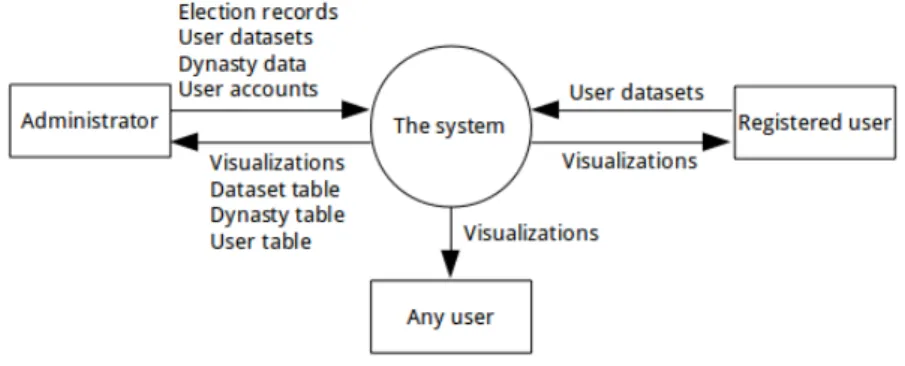
Geometry objects of a type other than "GeometryCollection" must have a "coordinates" attribute, which defines the shape or position of the geometry. They are also responsible for updating other data in the system, which are the electoral registers and dynasty data. They can upload datasets and, like any other user, visualize the data in the system.
The system interfaces with three types of entities: the administrators, the registered users, and the unregistered users (any user). Data sets other than election data and dynasty data can be uploaded into the system by any registered user or administrator.
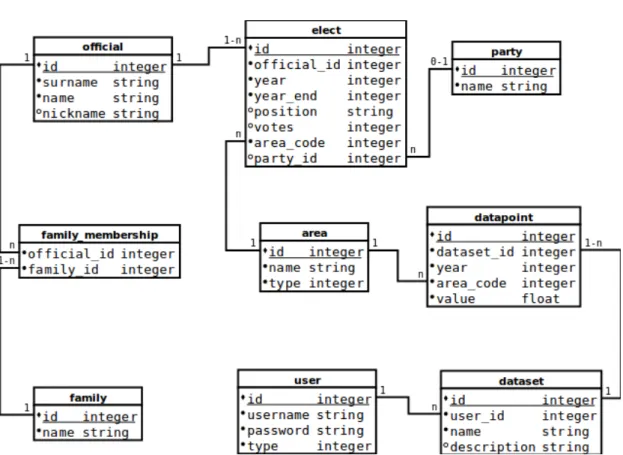
Entity relationship diagram
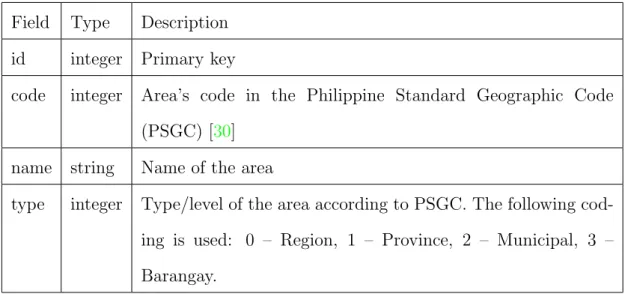
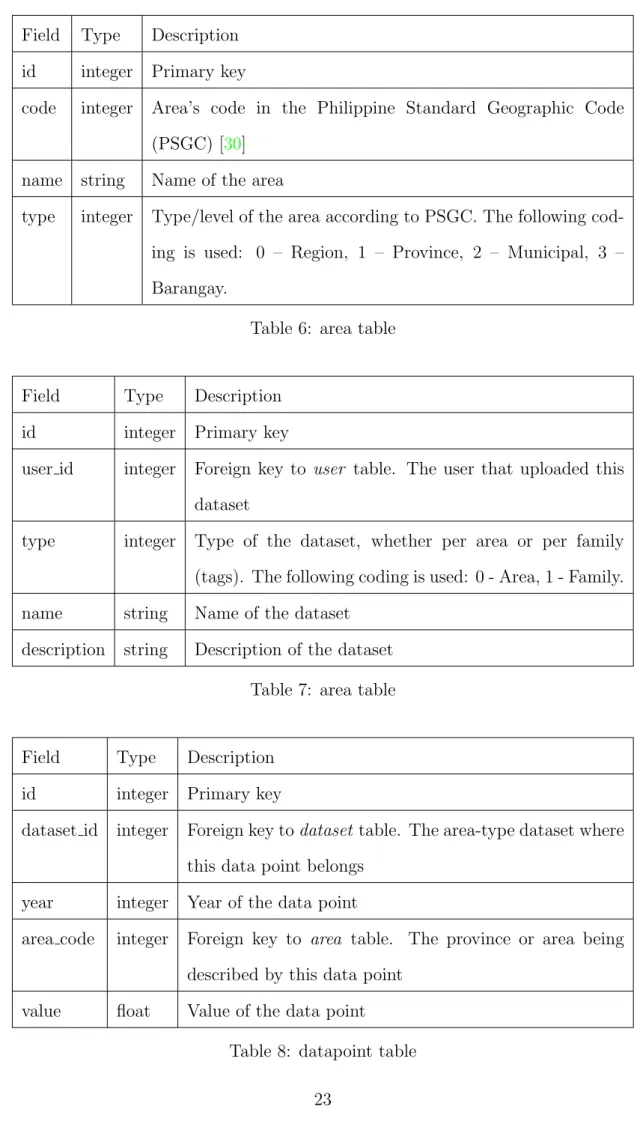
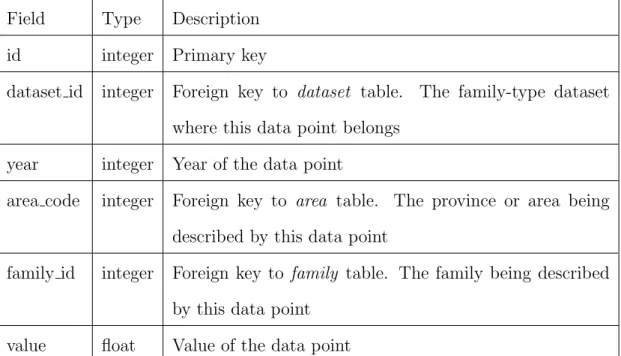
Data dictionary
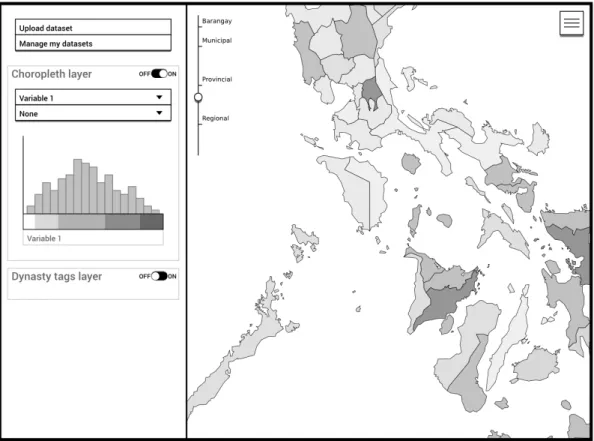
Wireframe
The marker size is proportional to the associated local dynasty's size, calculated using the LocalDynastySize variable (described in a later section of this chapter).
Indicators
An additional function LocalDynastySize(a, f, t) is the set of elected officials in area a at time t who belong to political dynasty f. DY N SHA [2] is an indicator variable for the share of dynastic positions in an area. DY N HERF [2] is the sum of the squared shares of the total positions of each political dynasty in an area.
The DY N SHA, DY N LAR and DY N HERF variables describe the dynastic share in an area. Using these variables as a basis, additional indicator variables were developed with the aim of describing the size of a dynasty in an area. RecursiveDynastySize (RDS) is the number of elected members of a political dynasty in an area, in all sub-areas of that area, and in all sub-areas of sub-areas.
The recursion stops at the barangay level since the subarea function is zero in the case of barangay.
Datasets format
Area strings can be the common names of the areas, such as "NCR", "Region IV-A", or "Abra".
Election records format
GeoJSON format
However, not all cases can be handled, as there are several ways to name an area. For each level, the user can update the geometry of the areas by uploading a GeoJSON file using the following format: For each feature encoding one area, it will have a "PSGC" property in its "properties" , with the value equal to the PSGC code of that area.
PSGC table format
The multiple rows encoding 133900000 are converted into the last row, which is the “CITY OF MANILA”. The flexibility in the format allows the user to directly upload the official PSGC table, which can be obtained from the NSCB website. However, it is recommended that the file consistently contain only valid rows containing only the PSGC and name fields, in that order, to avoid parsing errors.
Technical architecture
Results 34
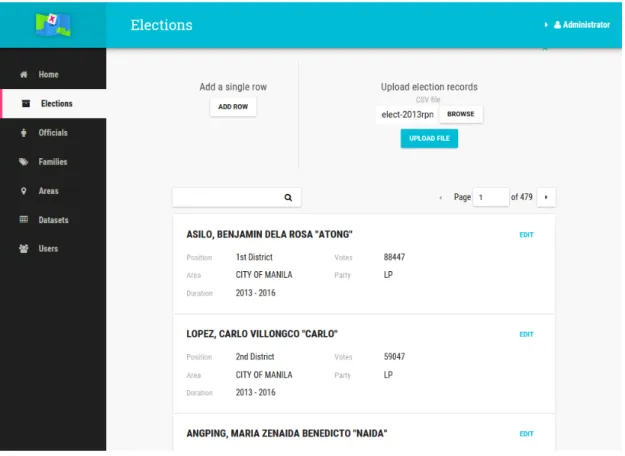
Administration pages
Admin can add multiple data either with single line option or file upload option. The families associated with each official are displayed and can be changed by entering a list of tokens. Area data can be added using the single line option or the file upload option.
If you choose an option, the system will generate the chosen indicator variable as a new data set. It can also change the type of any user except itself from a regular user to an administrator.
Main interface
Discussions 50