IMPROVING BUILDING DESIGN AND OPERATION OF A THAI BUDDHIST TEMPLE
USING TRANSIENT COUPLED DOE-2/CFD SIMULATIONS
By
A. Sreshthaputra, J. Haberl Department of Architecture
M.J. Andrews∗
Department of Mechanical Engineering
Texas A&M University College Station Texas 77843-3123
ABSTRACT
In this paper we report the results of coupled DOE-2 & 3-D transient Computational Fluid Dynamics (CFD) simulations for an unconditioned 100-year-old Buddhist temple located in an urban area of Bangkok, Thailand. The HEATX CFD code was combined with the DOE-2 thermal simulation program to analyze the heat transfer and airflow performance of the building. The
∗ Author to whom correspondence should be addressed.
indoor temperatures simulated by both programs were validated with measured temperature taken at the site. The simulation indicated poor thermal comfort conditions in this temple. The transient CFD/DOE-2 simulation suggested several remedial changes that could be implemented to improve the indoor comfort. In addition, a prototype building that combined several improved design options was proposed, and the simulation of the prototype was then performed. The result indicated an improvement of the indoor thermal comfort compared with that of the current building.
1. INTRODUCTION
Although air-conditioners are becoming more common in both residential and commercial buildings in hot-humid countries like Thailand, some building types, for example, Buddhist temples, do not use air-conditioners for various reasons but mostly due to religious constraints.
Therefore, these buildings must rely on natural ventilation to achieve comfort conditions. Passive cooling design strategies using only natural ventilation in hot-humid regions are difficult to accomplish, because the outside air is normally hotter and more humid than the indoor air for most of the time. For this reason, passive cooling designs in this climate must pay careful attention to building design, orientation, planning, material selection, window treatments, ventilation, and proper building operation. Unfortunately, practical advice for buildings without air-conditioning systems in hot-humid climates is not always available. Indeed, most passive cooling techniques were developed for either hot-arid or temperate climates where outdoor air has a lower humidity, allowing buildings to take advantage of large diurnal temperature swings.
Recently, advanced computer software such as Computational Fluid Dynamics programs (CFD) has been used to simulate fluid flows, heat transfer, and related phenomena through the use of numerical techniques. Although CFD simulations have become an integral part of engineering design in both the aerospace and automotive industries, they have only recently been used for
building design. Our literature reviews found several papers [1-5], where CFD studies have been performed for flows over buildings, or through rooms. Our main objective was to apply this tool to help improve the designs of unconditioned buildings in hot-humid climates using Thai Buddhist temples as the case study buildings.
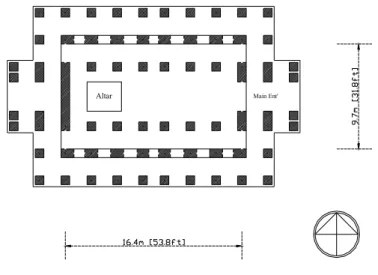
To improve comfort conditions inside the Thai Buddhist temples, two case-study temples (i.e., old and new temples) were selected for survey and measurement, however, simulations were performed only on the old temple. Figures 1, 2, and 3 show details of the old case-study temple.
Detailed measurement results of indoor temperature, relative humidity, and surface temperatures were reported in [6-7]. In addition to the measurement results, a steady-state CFD simulation that was coupled with the DOE-2 program indicated that, on a typical summer day, both indoor and outdoor conditions were beyond the limit of thermal comfort, which is established generally at about 21-27 °C [8]. It was also found from the measurements that during the night the indoor temperatures were higher than the outdoor especially on cloudy days. These results indicated that high-mass walls played a major role in keeping the indoor cooler than the outdoor during the day, but warmer during the night. For this reason, we found that a 24-hour transient CFD simulation would provide more detailed results than a steady-state calculation. This paper is focused on the use of a transient CFD simulation that was combined with the DOE-2 thermal simulation program.
We have adopted the DOE-2 simulation tool [9-10], and also performed transient 3-D Computational Fluid Dynamic (CFD) simulations. DOE-2 was used because of its ability to simulate the overall thermal performance of the building using the hourly outdoor weather data. In addition, DOE-2 can handle many variables of interest such as hourly indoor temperature, surface temperature, and solar gain, which can be reported from the program. To enhance accuracy of the DOE-2 simulation, several studies suggested that simulated results be compared with measured data and several input parameters affecting the simulation discrepancies were tuned [11-13]. This
procedure is known as calibration of the simulation model. Moreover, in an attempt to advance the calibrated simulation procedures, Haberl and Bou-Saada [14] have suggested the use of statistical indicators to evaluate the goodness-of-fit of predicted results compared with the observed data.
Several statistical indicators, such as mean difference, mean biased error (MBE), and root mean square error (RMSE), were calculated for each calibration stage. These indicators are helpful since they determine how well the simulated results match the measured data.
Research on building simulations in the last two decades has been extensively performed using CFD to study the airflow in and around buildings, only recently has CFD been combined with thermal simulation programs. This is because researchers have begun to realize that a thermal simulation program alone cannot provide enough information about buildings operated using natural ventilation as a passive cooling system. Two main problems exist: 1) a difficulty in estimating the airflow rate, and 2) an incorrect estimation of heat transfer coefficients, which are based on the incorrect airflow rates [15]. A thermal simulation program needs the air infiltration rate, and surface convection coefficients, calculated by CFD to provide accurate simulations of unconditioned buildings in which major heat gain components occur due to the incoming outside air. But CFD needs information regarding the building envelop, such as solar heat gain, and surface temperatures, to form accurate boundary conditions. Therefore, in this application the simulation tools support each other. Our literature reviews found several studies have been conducted about how to couple CFD with thermal simulation codes. Significant research in this area includes Nagrao [16], Sebric et al. [3], and Graca et al. [5].
Nagrao [16] integrated a CFD code into the ESP-r program using the coupled modeling approach. The idea is that for each time-step, ESP-r performs a thermal calculation only for the variables necessary for CFD to establish boundary conditions. Once the CFD solution converges, it passes the results back to ESP-r to complete the whole-building calculations. Prior to calculating
the airflow with CFD, a network airflow model was used in conjunction with ESP-r to calculate the inlet air velocity and temperature, including the surface heat flux. CFD then used these boundary conditions to calculate the detailed air velocity, air temperature, and surface convection
coefficients. The surface convection coefficients from CFD were then fed back to ESP-r to perform the detailed heating and cooling load calculations, including surface temperature calculations for the entire building. Nagrao’s approach seems to be very accurate, if time-consuming, because it is intended for use with multi-zone buildings where the inlet air velocity and temperature of each zone must be precisely calculated before the results are passed on to CFD. This is why the network airflow model was added into the thermal simulation process. However, it is not necessary for this study because the case study temple only has one ventilated zone and there is no HVAC system with ducts. Thus, only CFD will be used for these airflow calculations.
Srebric et al. [3] also developed a coupled airflow and energy simulation program. In essence, a CFD code was coupled with the energy analysis program named ACCURACY [17], which calculates the hourly heating and cooling loads based upon the energy balance method. At first, ACCURACY calculated the wall surface temperatures and A/C supply air velocity based on the cooling load required for that space, then CFD used those results to perform airflow simulations and calculate the convection coefficients for ACCURACY. Next, the air velocity, air temperature, wall temperatures, and air pressure were used to perform a thermal comfort analysis. Wall
convection coefficients were then calculated using the difference between the wall temperature and the air temperature of the cells next to the wall, along with the heat flux calculated by
ACCURACY. The results were validated by measurement data taken from experiments conducted in a test chamber. Using such heat-balance-based thermal simulation programs such as
ACCURACY might be inappropriate for a building with high thermal mass. However, the method of calculating the convection coefficients using CFD is related to our study.
Graca et al. [5] performed a coupled CFD/thermal simulation of a wind-driven ventilative cooling system for apartment buildings in Beijing and Shanghai, China. CFD was used to calculate the wind-driven airflow through the building for a set of wind speeds and directions. The air velocity distribution near the interior walls and ceiling was used to calculate the surface convection coefficients using experimental correlations suggested by Chandra and Kerestecioglu [18],
originally intended for use with naturally ventilated buildings. Graca used isothermal CFD
calculations to avoid the heavy computational burden of using CFD for detailed airflow and indoor surface temperatures. The method of calculating convection coefficients based on experimental correlations is useful for our study. However, using an isothermal CFD model is not appropriate for the temple simulations because this method cannot simulate buoyancy effects inside the temple.
Overall, it has been found that no previous studies were found that combined measured data, thermal simulation programs, and CFD to perform an analysis of a naturally ventilated, high mass building, where thermal inertia plays an important role in the indoor comfort conditions.
Additionally, no research was found to combine DOE-2 with a CFD program to perform
simulations of naturally ventilated buildings, particularly using a transient CFD calculation because of the lack of long-term measurements used to validate the simulation models.
2. METHODOLOGY
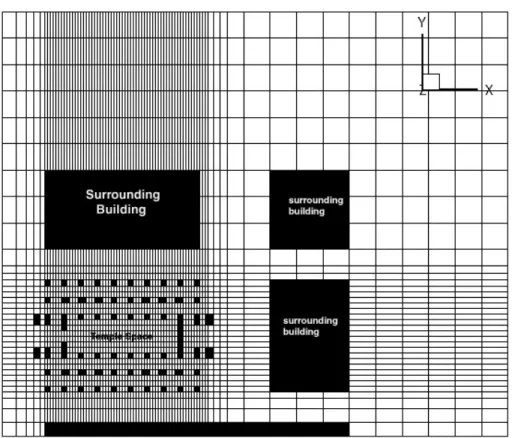
The methodology adopted for this study includes a survey of the case study buildings, the measurements and data collection, and the calibrated CFD/DOE-2 simulation. The details of the survey, measurement, and data collection were reported in [6-7]. This paper focuses on the calibrated CFD/DOE-2 simulation. The 3-D CFD simulations presented in this paper have been performed with the HEATX code written by Andrews and reported in [19-20]. The HEATX code solves the governing partial differential Navier-Stokes equations using finite volumes [21], in
which the temple and surrounding space was subdivided into finite-sized control volume as shown in Figure 4. A modified two-equation k-ε turbulence model including source terms for turbulence generation and dissipation due to buoyancy [22]. To perform a 24-hour transient simulation on a summer day, the hourly outdoor weather data (i.e., air temperature, wind speed and wind direction) obtained from the Royal Thai Meteorological Department [23] were used to set the hourly inflow boundary conditions in the CFD calculations. Hourly solar radiation, surface temperatures, surface thermal absorption, and the thermal conductivities of building envelopes were used to set the wall/roof boundary conditions. A 20-second time step was used with a total of 4,320 time steps.
The hourly solar gain was interpolated for each time-step change, but the inflow air velocity and temperature were constant between hours. The calculations were performed for each time step, but the outputs were generated only on an hourly basis. The entire computation took 2 days on a Pentium III 500 MHz PC.
In terms of the thermal simulation, the DOE-2 program used in this study was primarily designed to perform annual calculations of energy consumed by various heating and cooling systems in a building. However, this study was concerned with buildings operated with natural ventilation at all times. So, to simulate the thermal effect of natural ventilation with DOE-2, the temple was set as unconditioned spaces, where heat gains from the outside and inside cause the indoor temperature to float freely. In terms of the heat gains by natural ventilation, both spaces were treated like control volumes with outdoor air supplied to the spaces through air infiltrations.
For this study, the air infiltration rates were computed by HEATX, by multiplying the opening area with an average velocity of the air passing through the windows.
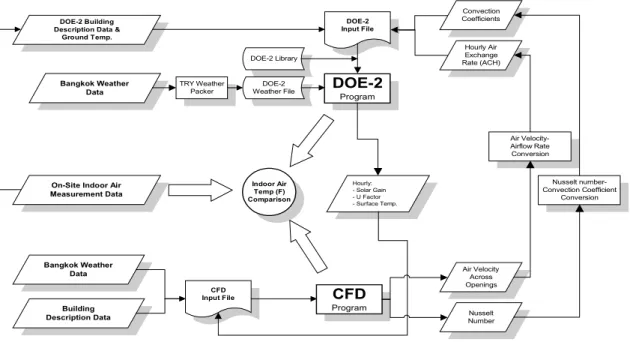
The flowchart in Figure 5 outlines the process through which DOE-2 and HEATX were combined to simulate the indoor air temperatures of the case-study temple for a 24-hour period.
The whole process began with the creation of input files for both programs from the same building
description data, measured data, and weather data. Two important variables were fed back and forth between the two programs during the calibration process. One was the amount of outside air infiltration, which is specified by the term “Air Exchange Rate (ACH)” in DOE-2, and the other was the interior surface convection coefficient for each surface. The Air-Exchange Rate was calculated using the following formulas.
ACH = (Vwin× Awin × 3600)/Space Volume in m3
where Vwin is the average air velocity across a window in m/sec. Awin is the window area in m2
At first, the initial values of these variables were set based on the ASHRAE
recommendations [24]. By supplying the DOE-2 program with these initial values, the thermal conductivity, the hourly solar gain to the walls and roof, and the hourly surface temperatures could be calculated. These outputs were then used to set the boundary conditions in HEATX. Thereafter HEATX calculated the velocity and temperatures of the air flowing through all openings, along with an average Nusselt number for each surface. In turn, the air velocity and the Nusselt numbers calculated by HEATX were then used to calculate the airflow rates and the surface convection coefficients for DOE-2. The calibration loops continued until the indoor temperatures calculated by both programs agreed with the measured data, and the same surface convection coefficients were used in both programs. Since HEATX can calculate indoor temperatures for a number of locations in the space depending on the number of cells, the HEATX results were compared with those from DOE-2, particularly the temperature at the center of the room was used. Using the convergence criteria suggested by Nagroa [16], the coupled DOE-2/CFD simulation model in this research was declared calibrated when the error between the indoor temperature calculated by DOE-2 and that simulated by HEATX for each hour is within ± 1 °C (±1.8 °F).
3. RESULTS AND ANALYSES
Figure 6 shows the HEATX-computed airflow across the building. Site observations and the Bangkok weather data revealed that the outdoor air moved across the temple at a 45° angle to the front entrance, passing through the front exterior colonnades, through the interior space, and exiting in the rear of the temple. It was found from the CFD velocity plot that the airspeeds increased significantly on the outside corners and at the side openings. This agrees with the observations recorded at the site, where increasing airspeeds at the windows were noticeable, thus producing a slightly more comfortable condition. However, inside the temple space where the major indoor religious activities take place, the CFD showed the air velocities decrease greatly, in agreement with on-site observation of the indoor conditions being stuffy and less comfortable. It was also observed on-site that smoke produced by candles and incense was trapped inside the space, which further deteriorated the indoor air quality. The results obtained from the CFD simulation showed a need to redesign the proper sizes and locations of vents that would produce more airflow across the building in the evening.
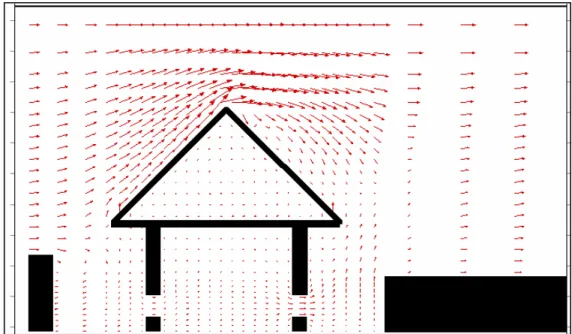
Figure 7 shows a cross section of incoming air flowing through the building. In this velocity plot, the airspeeds seem to increase significantly across the openings with vortices
occurring immediately above and below the window levels. It was also observed from the CFD that stagnation caused the indoor air to be trapped at a level just below the ceiling. Based on
observations made at the site, this stagnation condition leads to two undesirable outcomes in the case-study building. First, smoke produced by incenses rises, and it is trapped at the ceiling level.
This caused the ceiling and interior decorations (e.g. wall paintings, chandeliers) to become stained over time. Second, since the ceiling is hot during the day, air stagnation tends to decrease the thermal convection, which traps the heat in the ceiling. The hot ceiling then radiates heat to occupants, which contributes to the already uncomfortable conditions. Ventilating the air at the
ceiling level should help to alleviate these problems. However, designers must keep in mind that stirring hot, smoke laden air, from the ceiling down to the occupancy level might not produce a desirable effect; therefore ceiling fans, which blow down might not be a good option.
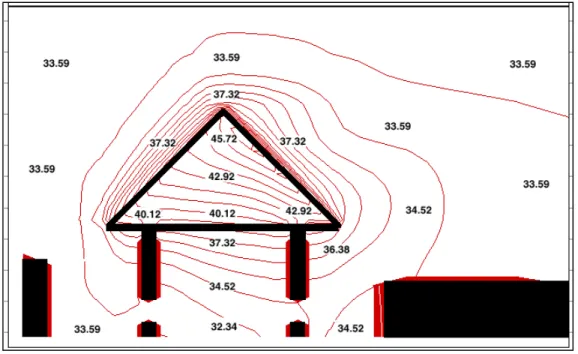
Figure 8 shows plots from HEATX of the temperature of the air passing through the building with buoyancy effects considered. Solar radiation heats up the outside roof surface and this heat is transferred to the attic. This causes the attic to be hotter, especially in the area immediately beneath the roof. Inside the attic, buoyancy causes the hot attic air to accumulate at the top of the attic. This stirs hot air from the inside surface of the roof with the cooler air at the ceiling. At the outside roof surface, it was found that the back roof (i.e., leeward) was hotter than the front (i.e., windward). This is because the incoming air (wind) convects away heat from the windward roof surface, while at the back roof a re-circulation of air occurs and that reduces the local convection heat transfer. Hot air vortices in the leeward side also act as an insulation layer to reduce a convective removal of heat, and thus add to the heating up of the outside back roof.
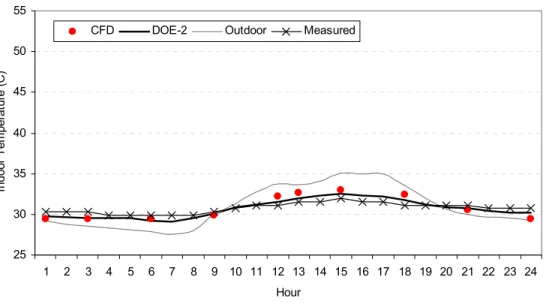
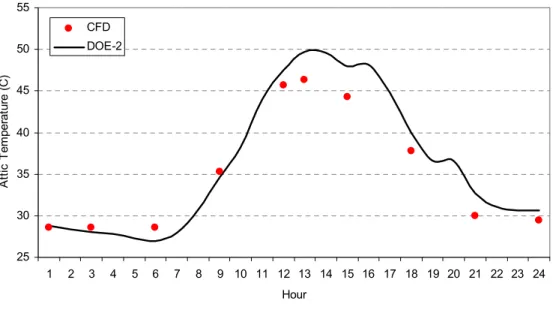
For the DOE-2/CFD calibration, Figures 9 and 10 show the simulation results of a coupled DOE-2/CFD transient calculation for a 24-hour period on a summer day. The simulation results of DOE-2 agreed moderately well with those from CFD. The maximum ventilation rate in terms of the air exchange per hour (ACH) in DOE-2 was found to be approximately 20 ACH. In addition, it was found that maximum ventilation occurs mostly during the afternoon, especially, in the summer when the outdoor wind speeds are at the highest, and all the windows are left open. This usually causes the temperatures inside the temple to rise as the cooler air inside the temple was replaced with hotter outside air. The DOE-2 simulation results also indicated that by reducing the ventilation rate during the afternoon the peak indoor temperature could be decreased.
The CFD results of the space temperature distribution and air velocity were used to calculate the convection heat transfer coefficients. For each inside surface, the wall temperature and the air temperature of the area next to the wall were used to establish the temperature difference needed for the calculation of the Rayleigh number. For each outside surface, the air velocity at the surface was used to calculate the Reynolds number, which was then used to calculate the Nusselt number. The convection heat transfer coefficients for all surfaces are
presented in Table 1. By using CFD, it was found that the convection coefficients calculated in our study were lower than that suggested by ASHRAE [24]. However, these results agreed more closely to the study of Gadgil et al. [25] given in Table 1, who performed a finite-difference calculation of the Navier-Stokes equations to determine the convection coefficients in a room.
Gadgil argued that the ASHRAE convection coefficients were too large, and that smaller values should be used if using a numerical model. This is because the numerical method provides more detailed convection heat transfer calculation.
Once the coupled DOE-2/CFD simulation results agreed with the measured data, the simulation model was declared calibrated. The calibrated simulation model was used to establish the thermal and airflow base-line model for the building, which then provided detailed information about how the building performed and reacted to the outside environment. Figure 11 shows detailed comparisons of the indoor and outdoor conditions during a two-week period during the summer. It is found that what drives the increase in indoor temperatures is not only the outdoor temperature, but also the solar radiation being directly transferred to the attic space, and finally through to the indoor space. On clear-sky days from March 30 to April 4, the amount of solar radiation was high, about 1,000 – 1,100 Watt/m2, which caused the simulated attic space to be very hot, about 49 ° to 55 °C during the afternoon. The attic then transferred the heat directly to the indoor space below by conduction through the uninsulated ceiling. The indoor temperatures seemed to have less fluctuation, compared with the outdoors. However, their pattern tends to
follow the amount of solar radiation and attic temperatures much closer than that of the outdoor temperatures. This can be observed on the cloudy days of April 5 and 6, where the outdoor temperatures tended to drop below the indoor temperatures. However, the air indoors still stayed warm due to the hot attic air. This situation was more noticeable during the winter. The peak outdoor temperatures dropped by 6 °C, but the peak indoor temperatures dropped only slightly, depending on the attic temperature and the amount of solar radiation.
It can be concluded that the indoor temperatures are predominantly regulated by the heat from the attic, and less so from heat conducted through the envelope. Therefore, the proposed design guidelines that follow are focused both on how to prevent heat transfer from the uninsulated attic and ceiling, and how to make the attic cooler during the day. In addition, it was found that the ground temperatures were constant and usually lower than both that of the outdoors and the
indoors. The ground could therefore provide a cooling effect on the building, since it could be used as a natural heat sink. Even though the indoor temperatures are mostly affected by the attic heat, and not the heat from envelop conduction, it was found that the 0.8 meter-thick brick walls performed remarkably well in terms of thermal inertia. Figure 11 shows that during the summer days, high-mass walls helped to reduce the diurnal temperature swings, causing peak indoor temperatures to be maintained at about 32 °C and the outdoor and attic temperatures to rise over 35
°C and 49 °C, respectively. This condition was advantageous in the older temple, which was found to be cooler than the new temple during the day. However, drawbacks occurred at night, when the outdoors is usually cooler, but the indoor often stayed warmer. This is because the heat stored inside the walls needs more time to be released back to the outside. This condition is more noticeable in the buildings that are completely closed off from the outside air, such as the old temple. The results suggested that night ventilation be used to increase the heat removal rate at night.
4. IMPROVED DESIGN OPTIONS
Based on the results of measurements and simulations, the indoor condition of the case- study temple might be improved by applying an appropriate design and operation modification.
Therefore, new design options focused on two important approaches: first, how to avoid attic heat gain, and second, how to remove indoor heat more effectively. To avoid attic heat gain, three major design criteria are proposed in this study. First, since solar radiation is a major source of heat gain to the attic, applying a low-absorption roof coating would help reduce the solar heat gain, and thus lower the attic temperature. Second, it was found that no thermal insulation was used on the ceiling; therefore, adding ceiling insulation would be an effective option. Third, because of the significant amount of solar radiation in this climate, shading from the sun all year round is desirable. Another option is to increase the sunshade at the building’s exterior surfaces. For removal of indoor heat, it was found that there was a possibility of reducing the peak attic
temperature during the daytime by introducing cooler outside air into the attic. A cooler attic would release less heat into the indoor space. It was found from the results that with high-thermal mass, various natural ventilation schedules had a significant impact on indoor temperatures. Therefore, the nighttime-only space ventilation was suggested for the proposed design options.
So, four specific design options were investigated: 1) a 0.22 solar-absorption roof surface, 2) R-30 ceiling insulation, 3) 24-hour attic ventilation, and 4) shading devices. Each design option was simulated independently using both daytime-only and nighttime-only ventilation to predict what would happen if each was applied to the existing old temple. The maximum ventilation rate for all design options was set to 20 ACH, which is the same as that calculated for the base case temple. The simulated indoor temperature reported by DOE-2 was used as an indicator of how much better each design option performed thermally compared with the existing temple, Figure 12 shows time-series plots of the simulated indoor temperatures of a building once constructed and
operated using these different options for a 2-week period of the summer. Among all the separate design options, it was found that a building constructed with either the white low-absorption roof, or R-30 ceiling insulation, has the lowest simulated indoor temperatures. Shading devices and attic ventilation appear to be the least effective options.
In terms of the ventilation schedules, the simulation results demonstrated that all design options performed much better if the nighttime-only ventilation was used [7]. The nighttime-only ventilation not only reduces peak indoor temperatures, but also the daily indoor temperature fluctuations during the summer. This is because the outdoors is cooler at night, and ventilating the building with this air helps to remove heat from the building faster, causing the building to be cooler the following morning. If the building is closed during the day, a lesser amount of heat can enter the building, and the indoor would be cooler. It was also found that the R-30 ceiling
insulation option allows for the smallest temperature fluctuations, while the white-roof option offers the lowest indoor temperatures, especially at night. This is because without the ceiling insulation, the heat gained and stored inside the indoor space in the daytime can dissipate to the attic, and then transfer to the outside through the roof more easily during the night, thus causing the indoor temperatures to decrease more quickly. However, with the ceiling insulation, it takes longer for the heat in the attic to transfer into the space. The thermal resistance is high enough to delay the heat transfer until the evening when the outside air is cooler, and the attic can lose heat to the ambient.
5. PROTOTYPE BUILDING
To maximize the performance of the building by applying the best possible design and operation, a prototype building design is proposed here, where all well-performing design options were combined to form the design, construction, and operation of the prototype. All major
construction techniques are the same as that of the old case-study temple, except that the roof is coated with high reflectance material with a solar absorptance of 0.22. In addition, R-30 fiberglass insulation is added on top of the ceiling, which forms the floor of the attic. A series of overhangs are installed on the colonnades on all sides of the building. In terms of the natural ventilation, all windows are scheduled closed during the day from 6 A.M. to 6 P.M., and open at night from 6 P.M. to 6 A.M. The indoor space is ventilated at night with an estimated maximum airflow rate of 20 ACH. The attic is ventilated 24 hours a day continuously with the CFD-calculated maximum airflow rate of 50 ACH. This prototype building was designed to have the same architectural footprint as that of the old case-study temple, and to have the same occupancy profile. The proposed prototype focuses on how to renovate an existing temple with adjustments that allow for the major building structure and construction materials to be maintained, because thousands of these historic temples are currently preserved in Thailand.
Figures 13 and 14 show the CFD results of the prototype building simulated under the same outside conditions as that used for the as-is temple simulation. Significant improvement is shown in the attic, where the maximum attic temperature would drop by as much as 12 °C. The hot attic air is replaced with the cooler outside air, causing the attic and space temperature to reduce.
The insulated ceiling also helps protect the conduction heat gain from the attic. In addition, at the outside roof surface, the air temperature is found to be lower than that of the as-is temple. This is because the outside roof surface absorbs a smaller amount of solar radiation as a result of a low- absorption coating applied to the roof.
The DOE-2/CFD simulation results for a 2-week period of the summer indicate that the prototype temple performs much better in terms of the indoor thermal conditions. Compared with the existing temple, Figure 15 shows that the afternoon peak temperatures can be reduced by as much as 4.5 °C in the summer. The average indoor temperatures are even lower than the lowest
indoor temperatures of the existing temple. In addition, it is apparent that the prototype building has fewer indoor temperature fluctuations during the day. The indoor temperatures are maintained closer to the ground temperature. Table 2 shows the DOE-2 simulation results of the prototype temple for a period of one year. On the annual average, Table 2 indicates that the prototype temple has the average indoor temperature of 27.6 °C, which is 1.5 °C lower than that of the existing temple. The average temperature deviation from the outdoor air is reduced from +0.6 °C to –0.9
°C, which means that on the average, the prototype temple is actually cooler than the outside. The average temperature deviation from the ground temperature is +1.6 °C, which is lower than the +2.9 °C of the existing temple. This deviation means that the indoor temperature of the prototype temple stays closer to the cooler ground, which is the natural heat sink.
6. SUMMARY AND CONCLUSION
Figures 16a, 16b, 16c, and 16d summarize and compare simulation results of the temple constructed with four individual options and all options combined (i.e., the prototype building) for a one-year period. In terms of the average indoor temperatures presented in Figure 16a, the low- absorption roof option appears to perform better than the R-30 ceiling insulation option. However, there is no difference in terms of the peak indoor temperatures between the two options, as shown in Figure 16b. It is important to realize that the peak indoor temperatures, which occur in the afternoon, have a direct impact on the thermal comfort of the occupants in the unconditioned buildings. A building with low-absorption roofs may be cooler at night, but it is unoccupied during that time. However, if it turns out that an air-conditioner is installed in the future, the low-
absorption roof might be a preferable renovation option because it allows the lowest average indoor temperatures and temperature deviations from the outdoors. Therefore, with a limited construction and maintenance budget, careful decisions regarding both design and renovation must be made
based on all possible factors. This analysis is very useful for architects and building renovators since it provides helpful information for making a decision on how to renovate old buildings.
In conclusion, an accurate assessment of naturally ventilated buildings in a hot-humid climate was accomplished with an in-depth DOE-2 and CFD analysis, a combination of advanced simulation tools. Detailed investigations of the space planning, building material, configuration of the openings, and operational schedules are essential for developing and testing of practical passive cooling techniques for unconditioned buildings in the tropics. This investigation is useful for building designers in terms of how to redesign and renovate this kind of building to improve indoor comfort conditions without using a mechanical A/C system. Our analysis indicates that the
traditional Buddhist temple design can be improved with several design and operation strategies, including: a low-absorptivity roof surface, ceiling insulation, solar shading, attic ventilation, and night ventilation of the temple space. Ceiling fans may not be a good option unless the building is properly designed. Detailed design guidelines and additional details concerning the work can be found in [7].
7. ACKNOWLEDGMENTS
This work was supported by the Department of Architecture and the Department of Mechanical Engineering, Texas A&M University. The instrumentation used for the measurements were supported by the Royal Thai Government and the American Society of Heating,
Refrigerating, and Air-Conditioning Engineers (ASHRAE) through a student grant.
TABLE 1
Comparison of the Surface Convection Coefficients
ASHRAE (1998) Gadgil et al. (1982) The Old Temple
(calculated by HEATX)
(W/m2.K) (W/m2.K) (W/m2.K)
Vertical walls 3.07 2.72 1.82
Lower surface of the ceiling 4.03 1.70 1.31
Inside roof surface (slope-45) 3.86 N/A 2.67
Upper surface of floor/ceiling 0.96 N/A 0.91
TABLE 2
Comparisons of Simulation Results of the Prototype, and the As-Is Temple.
Space Ventilation Modes Design options
As Is (day only) (20 ACH) Night Only (20 ACH) 24-Hour (20 ACH)
AS – IS Building:
0.75-Absorptance Roof, Peak Indr.temp = 34.1 °CPeak Indr.temp = 33.0 °CPeak Indr.temp = 34.6 °C No Ceiling Insulation, Avg Indr. temp = 29.1 °CAvg Indr. temp = 28.8 °CAvg Indr. temp = 29.1 °C No Attic Ventilation Dev. from grnd = + 2.9 °CDev. from grnd = + 2.7 °CDev. from grnd = + 3.0 °C Dev. from outdr. + 0.6 °CDev. from outdr. + 0.34 °CDev. from outdr. + 0.6 °C
Peak Indr.temp = 31.7 °C
N/A Avg Indr. temp = 27.6 °C N/A
Dev. from grnd = + 1.6 °C
Prototype Building:
0.22 - Absorptance roof, R-30 Ceiling Insulation, Shading, Attic Ventilation.
Dev. from outdr. - 0.9 °C
Fig. 1. Exterior view of the Old temple taken from the northeast direction at noon on January 7, 1999.
Altar Main Ent'
Fig. 2. Floor plan of the Old temple.
Attic
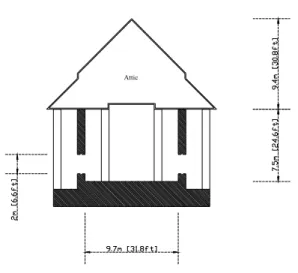
Fig. 3. Section view of the Old temple.
Fig. 4. Non-uniform grid setting for a CFD simulation of the Old temple.
DOE-2
Program
CFD
Program Indoor Air
Temp (F) Comparison
Air Velocity- Airflow Rate Conversion
Nusselt number- Convection Coefficient
Conversion Hourly:
- Solar Gain - U Factor - Surface Temp.
DOE-2 Input File
Bangkok Weather Data DOE-2 Building Description Data &
Ground Temp.
On-Site Indoor Air Measurement Data
Hourly Air Exchange Rate (ACH) Convection Coefficients
Air Velocity Across Openings
Nusselt Number DOE-2 Library
DOE-2 Weather File TRY Weather
Packer
CFD Input File Building
Description Data Bangkok Weather
Data
Fig. 5. Flowchart diagram showing the DOE-2/CFD calibration process for a 24-hour run period.
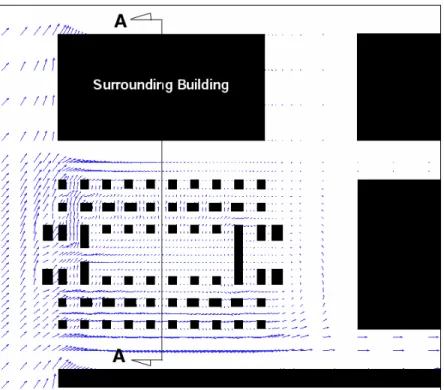
Fig. 6. Vector plot showing the airflow through the building on 03/30/99 at noon.
Fig. 7. Vector plot showing the airflow through the building on 03/30/99 at noon (Section A-A).
Fig. 8. Contour plot showing temperatures of the air passing through the building on 03/30/99 at noon (Section A-A).
25 30 35 40 45 50 55
1 2 3 4 5 6 7 8 9 10 11 12 13 14 15 16 17 18 19 20 21 22 23 24 Hour
Indoor Temperature (C)
CFD DOE-2 Outdoor Measured
Fig. 9. Comparison of the DOE-2 and the transient CFD-simulated indoor temperatures of the Old temple on a summer day.
25 30 35 40 45 50 55
1 2 3 4 5 6 7 8 9 10 11 12 13 14 15 16 17 18 19 20 21 22 23 24 Hour
Attic Temperature (C)
CFD DOE-2
Fig. 10. Comparison of the DOE-2 and the transient CFD-simulated attic temperatures of the Old temple on a summer day.
0 10 20 30 40 50 60
3/29 3/30 3/31 4/1 4/2 4/3 4/4 4/5 4/6 4/7 4/8 4/9 4/10 4/11
Temperature (C)
0 400 800 1200 1600 2000 2400
Solar Radiation (W/m2)
Indoor (sim) Outdoor Ground Attic (sim) Solar
Fig. 11. Simulated indoor/outdoor conditions of the Old temple during a 2-week period of the summer.
25 27 29 31 33 35
3/29 3/30 3/31 4/1 4/2 4/3 4/4 4/5 4/6 4/7 4/8 4/9 4/10 4/11
Date
Temperature (C)
AS IS White Roof Ceiling Insul
Attic Vent Shading Ground
Fig. 12. Comparison of the DOE-2 simulated indoor temperatures of all design options with nighttime-only space ventilation for a 2-week period of the summer.
Fig. 13. Vector plot of the Prototype temple.
Fig. 14. Temperature plot of the Prototype temple.
20 22 24 26 28 30 32 34 36 38
3/29 3/30 3/31 4/1 4/2 4/3 4/4 4/5 4/6 4/7 4/8 4/9 4/10 4/11
Date
Temperature (C)
Prototype Outdoor AS-IS Ground
Fig. 15. DOE-2 simulated indoor temperature of the Prototype temple for a 2-week period of the summer.
Fig. 16a. Annual average indoor temperatures of individual options and of the Prototype.
25 26 27 28 29 30
As - Is Shading Attic Ventilation R-30 Ceiling Insulation
Low-Absorption Roof
Prototype
Temperature (C)
Day Vent Night Vent
30 31 32 33 34 35
As - Is Shading Attic Ventilation R-30 Ceiling Insulation
Low-Absorption Roof
Prototype
Temperature (C)
Day Vent Night Vent
Fig. 16b. Annual peak indoor temperatures of individual options and of the Prototype.
-1.0 -0.8 -0.6 -0.4 -0.2 0.0 0.2 0.4 0.6 0.8 1.0
As - Is Shading Attic Ventilation R-30 Ceiling Insulation
Low-Absorption Roof
Prototype
Temperature (C)
Day Vent Night Vent
Fig. 16c. Annual average indoor temperature deviations from the outdoor temperature of individual options and of the Prototype.
0 1 2 3 4
As - Is Shading Attic Ventilation R-30 Ceiling Insulation
Low-Absorption Roof
Prototype
Temperature (C)
Day Vent Night Vent
Fig. 16d. Annual average indoor temperature deviations from the ground temperature of individual options and of the Prototype.
8. REFERENCES
[1] S.T. Awolesi, H.W. Awbi, M. J. Seymour, R.A. Hiley, In: Computational Fluid Dynamic- Tool or Toy? Proceedings of the 1991 IMechE Conference on The Use of CFD Techniques for The Assessment and Improvement of a Workshop Ventilation System. London, UK, 1991.
[2] H.B. Awbi, In: Computational Fluid Dynamic-Tool or Toy? Proceedings of the 1991 IMechE Conference on Computational Fluid Dynamics in Ventilation. London, UK, 1991.
[3] J. Srebric, Q. Chen, L.R. Glicksman, A coupled airflow-and-energy simulation program for indoor thermal environment studies, ASHRAE Transactions 105(2) (2000) 414-427.
[4] C. Tantasawasdi, J. Srebric, Q. Chen, Natural ventilation design for houses in Thailand, Energy and Buildings 33(8) (2001) 815-824.
[5] G.C. Graca, Q. Chen, L.R. Glicksman, L.K. Norford, Simulation of wind-driven ventilative cooling systems for an apartment building in Beijing and Shanghai, Energy and Buildings 34(1) (2002) 1-11.
[6] A. Sreshthaputra, J. Haberl, M.J. Andrews, 3-D Studies of heat transfer and airflow in an unconditioned Thai Buddhist temple, Journal of Energy, Heat, and Mass Transfer 22 (2001) 455-471 (Printed in 2002).
[7] A. Sreshthaputra, Building design and operation for improving thermal comfort in naturally ventilated buildings in a hot-humid climate, Ph.D. Dissertation, Texas A&M University, College Station, Texas, 2003.
[8] ASHRAE, Handbook of Fundamentals, American Society of Heating, Refrigerating, and Air-Conditioning Engineers, Atlanta, GA, 2001.
[9] LBNL, The DOE-2.1E Supplement, Lawrence Berkeley National Laboratory, Berkeley, CA, 1994.
[10] LBNL, The DOE-2.1E Documentation Update Package #4, Lawrence Berkeley National Laboratory, Berkeley, CA, 2001.
[11] T. Bou-Saada, J. Haberl, In: Proceedings of Building Simulation '95 on An Improved Procedure for Developing Calibrated Hourly Simulation Models, Madison, Wisconsin, 1995.
[12] J.M. Manke, D.C. Hittle, C.E. Hancock, In: Proceedings of the 1996 International ASME Solar Energy Conference on Calibrating Building Energy Analysis Models Using Short Term Test Data, San Antonio, TX, 1996.
[13] J.S. Haberl, T. Bou-Saada, V. Soebarto, A. Reddy, In: The Eleventh Symposium on Improving Building Systems in Hot and Humid Climates Proceedings on Use of Calibrated Simulation for the Evaluation of Residential Energy Conservation Options of Two Habitat for Humanity Houses in Houston, Texas, Forth Worth, Texas, 1998.
[14] J.S. Haberl, T.E. Bou-Saada, Procedure for calibrating hourly simulation models to measured building energy and environmental data, ASME Journal of Solar Energy Engineering 120(August) (1998) 193-208.
[15] R. Kammerud, E. Ceballos, B. Curtis, W. Place, B. Anderson, Ventilation cooling of residential buildings, ASHRAE Transactions 95(2) (1984) 226-251.
[16] C.O.R. Nagrao, Conflation of computational fluid dynamics and building thermal simulation, Ph.D. Thesis, University of Strathclyde, Glasgow, UK, 1995.
[17] Q. Chen, J.V.D. Kooi, ACCURACY: A computer program for combined problems of energy analysis, indoor airflow, and air quality, ASHRAE Transactions 94(2) (1988) 196- 214.
[18] S. Chandra, A.A. Kerestecioglu, Heat transfer in naturally ventilated rooms data from full- scale measurements, ASHRAE Transactions 90(1) (1984) 211-224.
[19] M. Prithiviraj, M.J. Andrews, Three-dimensional numerical simulation of shell-and-tube heat exchangers part 1: Foundation and fluid mechanics, Numerical Heat Transfer Part A:
Applications 33(8) (1998) 799-816.
[20] M. Prithiviraj, M.J. Andrews, Three-dimensional numerical simulation of shell-and-tube heat exchangers part 2: Heat transfer, Numerical Heat Transfer Part A: Applications 33(8) (1998) 817-828.
[21] V.S. Patankar, Numerical Heat Transfer and Fluid Flow. Hemisphere Publishing Corp., U.S.A., 1980.
[22] D.M. Snider, M.J. Andrews, The simulation of mixing layers driven by compound buoyancy and shear, ASME Journal of Fluids Engineering 118(2) (1996) 370-376.
[23] RTMD, The Hourly Weather Data of Bangkok Station, The Royal Thai Meteorological Department, Bangkok, Thailand, 2000.
[24] ASHRAE, Cooling and Heating Load Calculation Principles. Atlanta, GA: American Society of Heating, Refrigerating, and Air-Conditioning Engineers, Atlanta, GA, 1998.
[25] A. Gadgil, F. Bauman, R. Kammerud, Natural convection in passive solar buildings:
experiments, analysis, and results, Passive Solar Journal 1(1) (1982).