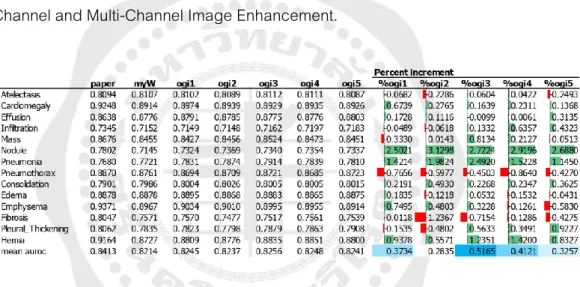
48 Table 5: Comparing AUROC Result of Transfer Learning and Fine Tuning with Gamma Correction to the AUROC of the Original Image Model. 54 Table 10: AUROC result of Transfer Learning and fine-tuning with Complement compare with the AUROC of the original image model. 71 Table 17: AUROC Comparison of Transfer Learning and Fine Tuning with Five Multi-Channel Combination Image Enhancement Techniques and the AUROC of the Original Image (myW Column) Based on the Best Overall AUROC (Mean AUROC).
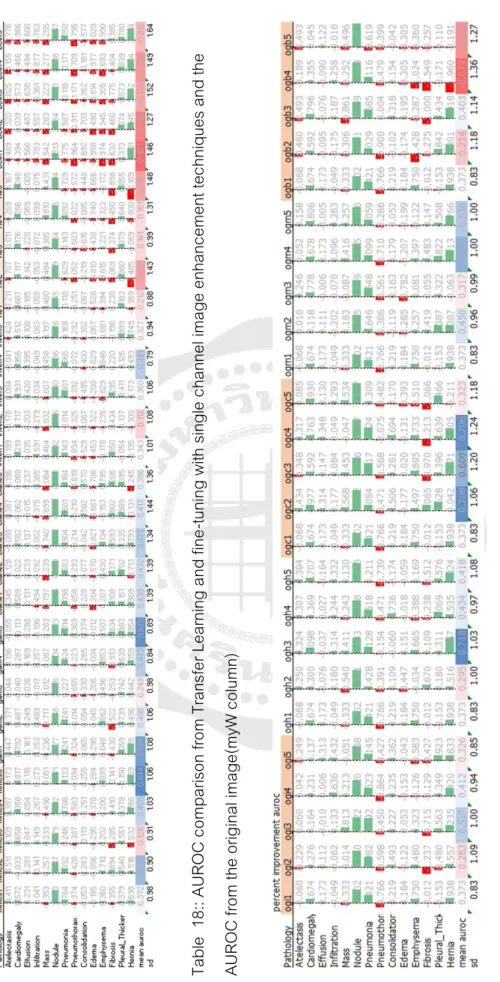
73 Table 18:: AUROC Comparison of Transfer Learning and Fine Tuning with Single Channel Image Enhancement Techniques and the AUROC of the Original Image (myW column). 83 Table 19: AUROC comparison of Transfer Learning and fine-tuning with five multi-channel combination image enhancement techniques and the AUROC of the original image (myW column). M Figure 29: The percentage of AUROC improvement of multi-channel combined image enhancement techniques in pneumonia.
INTRODUCTION
- Introduction
- Problem Statement
- Objective
- Scope and Limitation
- Thesis Structure
Recently, deep learning (with the Convolution Neuron Network: CNN) has been successful in interpreting medical mags. An existing deep learning model, CheXNet[7], for diagnosing 14 chest pathologies performs well on most of them. Then download the learning and fine-tune the model with the new chest x-ray shape from image enhancement techniques.
17 o To construct the method used for Image Enhancement technique to select the best detection performance on the specific pathologies, Infiltration, Nodule, Pneumonia and Consolidation. Chapter four is results of experiments separated into two sections; The single channel image enhancement results and the multichannel image enhancement results. Then the tabular comparison of overall pathology detection performance and specific pathology detection performance is shown in this chapter.
LITERATURE REVIEW
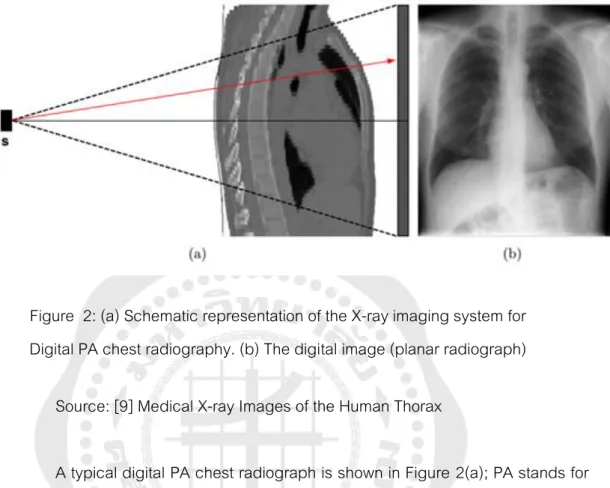
- Conventional radiography imaging
- Digital Radiography
- Chest X-ray Abnormalities
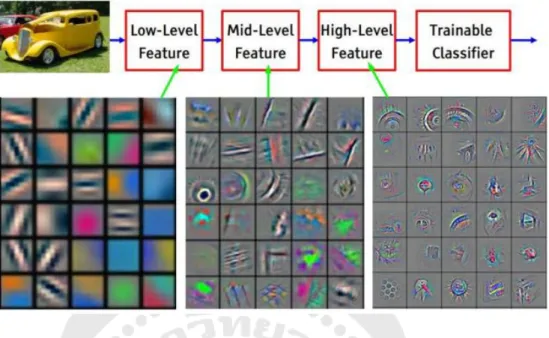
- Deep Convolutional Neural Networks
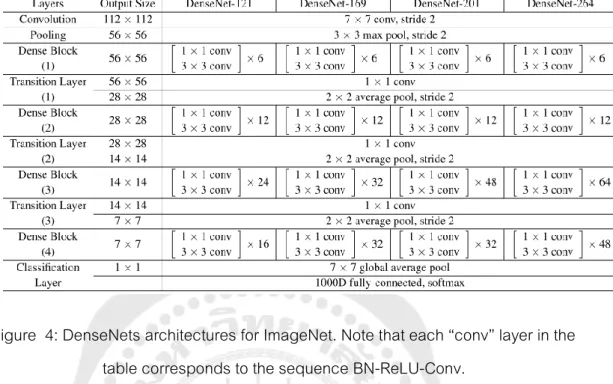
- DenseNet121, CheXNet
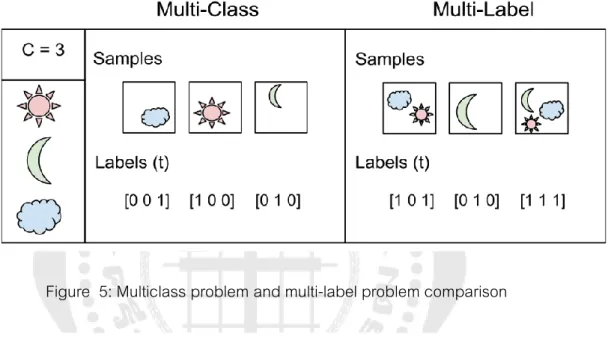
- Result from Image classification as multi-label
- Image Enhancement
- Histogram Equalization (HE)
- Contrast-limited adaptive histogram equalization (CLAHE)
- Image Invert/ Complement
- Gamma correction
- Balance Contrast Enhancement Technique (BCET)
- Min Max Linear Contrast Stretching
- Related Works
Next, distinct items are obtained that must be linearly separated by a classifier (ie, the final fully connected layer). The purpose of the histogram equalization (HE) method is to distribute the grayscale values in an image evenly. A dark image would cause the histogram to skew toward the end of the gray scale, and the image data would be packed into the dark end of the histogram.
Where 𝑥 and 𝑦 are the intensity values of the original and transformed (new) images, this technique shows the lung area (i.e., the region of interest) lighter and the bones are darker as it can be observed that the histogram for completed image is a reversed copy of the original image. By stretching or compressing the image contrast without changing the histogram pattern of the image data, BCET is a method to enhance the equilibrium contrast[16]. Additionally, DenseNets require far fewer parameters and less computation to achieve state-of-the-art performance.[14] The DenseNet121 proposal to implement came from comparing the performance of ResNet152, DenseNet121, InceptionV4 and SEResNeXt101 in CheXpert, finding that DenseNet121 performed better.[20].
METHODOLOGY
Dataset
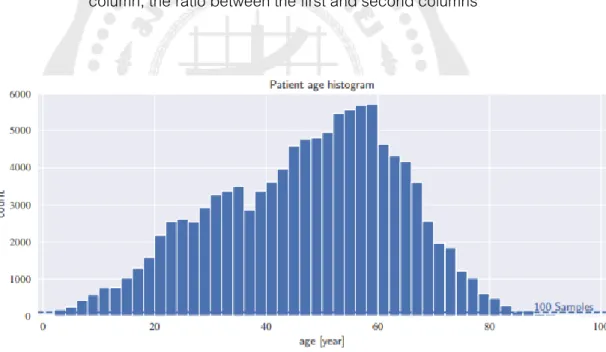
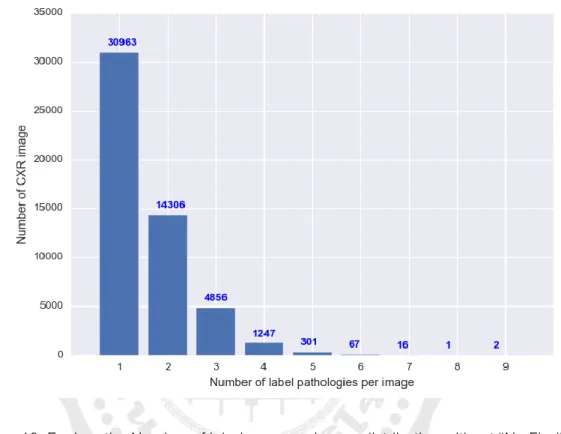
The distribution of each class and statistics for non-imaging data are provided in Tables 2 and 3, as well as Figure 9. The occurrence of each pathology was generally rare, with frequency ranging from 0.2 percent to 17.74 percent (see Table 2). The patient gender and view position distributions were relatively equal, with ratios of 1.3 and 1.5, respectively (see Table 3).
For each disease, the total number of "true" and "false" (i.e., whether the disease is present or not) and their incidence are given. Prevalence is the value shown ratio of the positive number found in a sample of people studied and usually used in medical conditions for risk of disease. For patient gender, the total score of female and male is shown, and for viewing position, the total score of posterior-anterior (PA) and anterior-posterior (AP) is given.
![Figure 8: eight visual examples of common thorax diseases Source: [19]](https://thumb-ap.123doks.com/thumbv2/filepdfco/9587164.144099/37.892.192.780.165.682/figure-visual-examples-common-thorax-diseases-source.webp)
Method for study
- Flow of work
- Image Enhancement and preparation
- Single Channel Image Enhancement process
- Multi-Channels Image Enhancement process
- Training Procedure
- Evaluation and Comparison
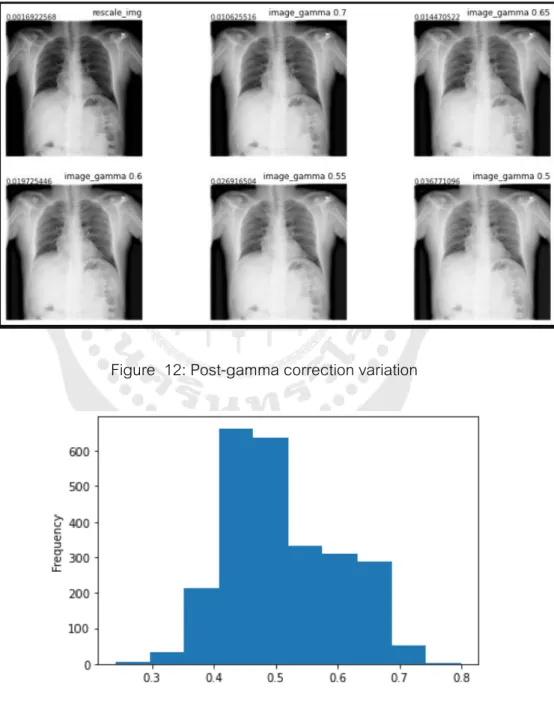
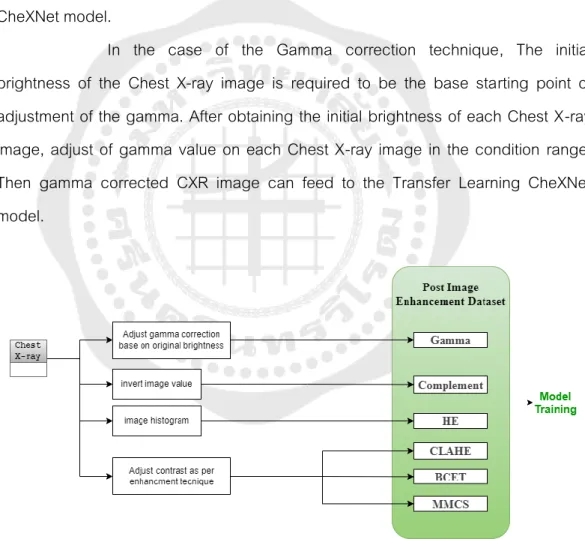
In the case of the Gamma correction technique, the initial brightness of the chest X-ray image is required to be the base starting point of adjusting the gamma. After obtaining the initial brightness of each chest X-ray image, adjust the gamma value on each chest X-ray image in the condition range. Initially, the test dataset of chest X-ray images will go through the Deep CNN related model, the "CheXNet".
The result is used for the baseline in performance compared to the result of various image enhancement techniques on the CheXNet fine-tuning model. The second and third stack are the combination of the experiment shown in the workflow below. For example, in the Gamma+CLAHE combination, the first array stack is the original image.
45 We train chest X-ray image classification models with ImageNet in advance and use the weight obtained from our unweighted CheXNet training state. An input image dimension of 224 x 224 from a 1024 x 1024 chest X-ray image used the “ReduceLROnPlateau” callback to reduce the learning rate every epoch, and the minimum learning rate is 1e-8, the “Adam” optimizer with standard parameters (β1 = 0.9 and β loss function “binary_crossentropy” and training epoch 50. Data augmentation was performed by horizontal image rotation only to switch between PA and AP types of chest X-ray image.
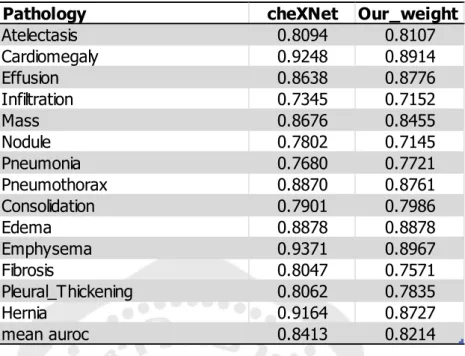
The best weight from training with an original image of the Chest X-ray 14 dataset is CheXNet weight. Then it uses this weight to refine the deep learning model with the same parameter above but changing the input source from 6 different image enhancement techniques prepared earlier. We evaluate models by averaging their AUROC metrics (AUC) on the 14 radiological observations (Atelectasis, Cardiomegaly, Effusion, Infiltration, Mass, Nodule, Pneumonia, Pneumothorax, Consolidation, Edema, Emphysema, Fibrosis, Pleural Thickening, Hernia). use. between image enhancement.
47 graph consists of false positive rate (1-specificity, FPR) versus true positive rate (sensitivity, TPR).
Experiment baseline (from paper and our result)
By analogy, the higher the AUC, the better the model can distinguish between patients with disease and no disease.
RESULTS
Single Channel Image Enhancement Result
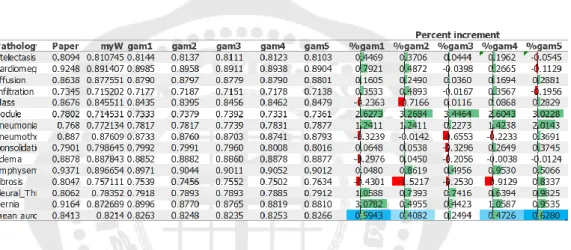
- Gamma correction
- Contrast-limited adaptive histogram equalization (CLAHE)
- Histogram Equalization
- Balance Contrast Enhancement Technique (BCET)
- Min Max Linear Contrast Stretching (MMCS)
- Image Invert/ Complement
- Single Channel image enhancement result comparison
The mean AUROC of the 5th experiment indicates the best overall performance of these studies on gamma correction - performance degradation in other pathologies is virtually unchanged. The mean AUROC in the 3rd experiment indicates the best overall performance of these studies on CLAHE. The average AUROC in the 1st experiment indicates the best overall performance of these studies on histogram smoothing.
The mean AUROC of the 5th experiment indicates the best overall performance of this study on BCET, even if there is no improvement compared to the performance without using the image enhancement technique. The most improvement of BCET pathology is Hernia when comparing all six image enhancement techniques. The mean AUROC of the 5th experiment indicates the best overall performance of these studies on MMCS.
The average AUROC on the 4th experiment indicates the best overall performance of these studies on complement - the performance reduction in other pathologies is almost unchanged. Based on the selection of the best average AUROC from each single-channel image enhancement model training, the comparison result is shown in Table 11. MMCS and gamma correction is the best overall performance on 14 pathologies from these single-channel input training experiments.
For the pathology example of a Nodule alone, the CLAHE is the best technique to improve disease detection by 3.37 percent. Each pathology detection base on each image enhancement technique, from figure 18, shows the potential performance for the specific uses for one class of pathology detection. When observing different perspectives of all the experiments on image enhancement techniques specific to the disease, the disease that improves significantly is cardiomegaly, nodule, pneumonia, emphysema, fibrosis, pleural thickening and hernia.
The best weight trained by the experiment is shown in Figures 19-25, according to each pathology.
Multi-Channels Image Enhancement Result
- Original image + Gamma correction + Invert
- Original image + Gamma correction + HE
- Original image + Gamma correction + CLAHE
- Original image + Gamma correction + MMCS
- Original image + Gamma correction + BCET
- Multi-Channels image enhancement result comparison
The average AUROC on the 3rd experiment is 0.4243 percent increase, indicating the best overall performance on the combination. A percent increase of 1.924 is the best enhancement of pneumonia, specifically both Single Channel and Multi-Channel Image Enhancement. The average AUROC in the 3rd experiment is an increase of 0.5901 percent from the baseline, indicating the best overall performance in this combination.
The mean AUROC in the 2nd experiment is an increase of 0.5812 percent from baseline, indicating the best overall performance in this combination. The mean AUROC in the 4th experiment is an increase of 0.4946 percent from baseline, indicating the best overall performance in this combination. The five repeated experiments confirm that most results were in the same direction, 3 out of 5.
The mean AUROC in the 3rd experiment is an increase of 0.3313 percent from baseline, indicating the best overall performance in this combination. Based on the selection of the best average AUROC from each Multi-Channel Image Enhancement Model training, the comparison result is shown in Table 17. For the pathology sample of a Nodule alone, the ogc4 combination is the best technique to improve disease detection by 2.71. per cent.
Each pathology detection basis based on each image enhancement technique in Figure 26 shows the potential performance for specific applications for one pathology detection class. When looking at different perspectives with all attempts at disease-specific image enhancement techniques, the disease that improves significantly is cardiomegaly, nodules, pneumonia, emphysema, fibrosis, pleural thickening, and herniation. The best combination for diagnosing pneumonia is the ogi3 combination, while the best combination for detecting a hernia is the ogh3 combination.
The best weight trained from the experiment is shown in Figures 27-33, according to each pathology.
All result comparison
Hinton, “Imagenet classification with deep convolutional neural networks,” Advances in Neural Information Processing Systems, vol. Le, “Efficientnet: Rethinking Model Scaling for Convolutional Neural Networks,” in International Conference on Machine Learning, 2019: PMLR, p. Rajpurkar et al., "CheXNet: Radiologist-level detection of pneumonia in chest radiographs using deep learning," p.
Weinberger, “Densely connected convolutional networks,” in Proceedings of the IEEE conference on computer vision and pattern recognition, 2017, p. Rahman et al., “Exploring the effect of image enhancement techniques on the detection of COVID-19 using chest X-ray images,” Comput Biol Med, vol.
Hospital-Scale Chest X-Ray Database and Benchmarks on Poor-Surveillance Classification and Localization of Common Thoracic Diseases,” in 2017 IEEE. Irvin et al., “CheXpert: a large chest radiography dataset with uncertainty labels and expert comparison,” 33rd AAAI Conference on Artificial Intelligence, AAAI 2019, 31st Innovative Applications of Artificial Intelligence Conference, IAAI 2019 and the 9th AAAI Symposium on Educational Advances in Artificial Intelligence, EAAI 2019, pp.
![Figure 6: Example of two similar images but with different labels. These two images have “joy” and “alone” non-mutually exclusive.[15]](https://thumb-ap.123doks.com/thumbv2/filepdfco/9587164.144099/27.892.190.738.180.837/figure-example-similar-images-different-labels-mutually-exclusive.webp)
![Figure 7: Histogram for original X‐ray image and images undergo different enhancement techniques[17]](https://thumb-ap.123doks.com/thumbv2/filepdfco/9587164.144099/33.892.191.810.160.975/figure-histogram-original-images-undergo-different-enhancement-techniques.webp)