THE CAUSAL INFLUENCE OF EXPECTATIONS, PERCEIVED QUALITY, PERCEVED VALUE, SATISFACTION, COMPLAINTS AND
LOYALTY OF CHINESE TOURISTS TO MAE TAENG ELEPHANT CAMP, CHIANG MAI, THAILAND
NUOXIANG SHA
MASTER OF ARTS IN TOURISM DEVELOPMENT MAEJO UNIVERSITY
2018
THE CAUSAL INFLUENCE OF EXPECTATIONS, PERCEIVED QUALITY, PERCEVED VALUE, SATISFACTION, COMPLAINTS AND
LOYALTY OF CHINESE TOURISTS TO MAE TAENG ELEPHANT CAMP, CHIANG MAI, THAILAND
NUOXIANG SHA
A THESIS SUBMITTED IN PARTIAL FULFILLMENT
OF THE REQUIREMENTS FOR THE DEGREE OF MASTER OF ARTS IN TOURISM DEVELOPMENT
GRADUATE SCHOOL MAEJO UNIVERSITY 2018
Copyright of Maejo University
THE CAUSAL INFLUENCE OF EXPECTATIONS, PERCEIVED QUALITY, PERCEVED VALUE, SATISFACTION, COMPLAINTS AND
LOYALTY OF CHINESE TOURISTS TO MAE TAENG ELEPHANT CAMP, CHIANG MAI, THAILAND
NUOXIANG SHA
THIS THESIS HAS BEEN APPROVED IN PARTIAL FULFLLMENT OF THE REQUIREMENTS FOR THE DEGREE OF MASTER OF ARTS
IN TOURISM DEVELOPMENT
APPROVED BY Advisory Committee
Chair
(Dr.Winitra Leelapattana) .../.../ ...
Committee
(Assistant Professor Dr. Suriyajaras Techatunminasakul) .../.../ ...
Committee
(Dr. Yutthakarn Waiapha) .../.../ ...
Program Chair, Master of Arts
in Tourism Development (Dr. Keerati Trakansiriwanich) .../.../ ...
CERTIFIED BY GRADUATE SCHOOL
(Associate Professor Dr. Kriangsak Mengamphan) Dean of Graduate School
.../.../ ...
C
ABSTRACT (THAI)
ชื่อเรื่อง THE CAUSAL INFLUENCE OF EXPECTATIONS, PERCEIVED QUALITY,PERCEVED VALUE, SATISFACTION, COMPLAINTS ANDLOYALTY OF CHINESE TOURISTS TO MAE TAENGELEPHANT CAMP, CHIANG MAI, THAILAND
ชื่อผู้เขียน Mr.Nuoxiang Sha
ชื่อปริญญา ศิลปศาสตรมหาบัณฑิต สาขาวิชาพัฒนาการท่องเที่ยว อาจารย์ที่ปรึกษาหลัก อาจารย์ ดร.วินิตรา ลีละพัฒนา
บทคัดย่อ
การศึกษาครั้งนี้ใช้วิธีการวิจัยเชิงคุณภาพและเชิงปริมาณ โดยท าการสัมภาษณ์เชิงลึกกับ นักท่องเที่ยวชาวจีน 10 คน ที่มาท่องเที่ยวปางช้างแม่แตง เจ้าหน้าที่ปางช้างแม่แตง 5 คน และ ผู้บริหารปางช้างแม่แตง 1 คน ใช้แบบสอบถามเก็บข้อมูลกับนักท่องเที่ยวชาวจีนที่มาท่องเที่ยวปาง ช้างแม่แตง จ านวน 400 คน ข้อมูลที่ได้รับจากแบบสอบถามถูกน าไปวิเคราะห์โดยสถิติเชิงพรรณา และการวิเคราะห์เนื้อหา น าไปใช้กับข้อมูลที่ได้จากการสัมภาษณ์เชิงลึก เพื่อท าการประเมินอิทธิพล มูลเหตุ
ผลการศึกษาพบว่า กลุ่มตัวอย่างนักท่องเที่ยวชาวจีนมีความคิดเห็นต่อการท่องเที่ยวปาง ช้างแม่แตง ดังนี้ 1) ส่วนใหญ่ใช้บริการท่องเที่ยวกับบริษัททัวร์ ได้ข้อมูลปางช้างแม่แตงจากบริษัททัวร์
และเดินทางมาท่องเที่ยวเป็นครั้งแรก นักท่องเที่ยวกลุ่มตัวอย่างชาวจีนเลือกดูการแสดงของช้างมาก ที่สุด รองลงมา คือ การขี่ช้าง การท่องเที่ยวหมู่บ้านชาวเขา การล่องแพ และการเล่นซิบไลน์
ตามล าดับ และ 2) นักท่องเที่ยวกลุ่มตัวอย่างชาวจีนประทับใจในกิจกรรมการขี่ช้างมากที่สุด รองลงมา คือ การแสดงของช้าง การท่องเที่ยวหมู่บ้านชาวเขา การล่องแพ การนั่งเกวียน และการเล่น ซิปไลน์ ตามล าดับ ปัจจัยที่มีอิทธิพลต่อความภักดีของกลุ่มตัวอย่างนักท่องเที่ยวชาวจีนมีดังนี้ 1) ความคาดหวังของนักท่องเที่ยว 2) การรับรู้คุณค่าของนักท่องเที่ยว และ 3) การรับรู้คุณภาพของ นักท่องเที่ยว (0.84, 0.68, 0.54 และ 0.41 ตามล าดับ)
จากผลการศึกษามีข้อเสนอดังนี้ 1) ควรสร้างความคาดหวังหรือความรู้สึกที่ดีของลูกค้า โดยเฉพาะด้านความปลอดภัย ความสนุกสนานและความตื่นเต้น 2) สร้างความพอใจต่อการใช้บริการ และความประทับใจในการแสดงของช้าง การขี่ช้าง การล่องแพ การนั่งเกวียน การท่องเที่ยวหมู่บ้าน ชาวเขา และการเล่นซิปไลน์ 3) สร้างความรับรู้ของลูกค้าด้านคุณภาพ ซึ่งได้แก่ ด้านผลิตภัณฑ์ สิ่ง
D อ านวยความสะดวก ความสะอาดของอาคารสถานที่ และที่จอดรถ 4) ราคาที่เป็นธรรม 5) การ ส่งเสริมการขาย เช่น ตัวแทนจ าหน่ายและออนไลน์ และ 6) การบริการที่ยุติธรรมเป็นมิตร ความ สุภาพ ความรวดเร็ว และระบบรักษาความปลอดภัยที่ดี
D
ABSTRACT (ENGLISH)
Title THE CAUSAL INFLUENCE OF EXPECTATIONS,
PERCEIVED QUALITY,PERCEVED VALUE, SATISFACTION, COMPLAINTS ANDLOYALTY OF CHINESE TOURISTS TO MAE
TAENGELEPHANT CAMP, CHIANG MAI, THAILAND
Author Mr. Nuoxiang Sha
Degree Master of Arts in Tourism Development Advisory Committee Chairperson Dr. Winitra Leelapattana
ABSTRACT
This study employed mixed-method research quantitative research and qualitative research. In qualitative research, in-depth interview was employed with 10 Chinese tourists travelling at Mae Taeng Elephant Camp, 5 staff of Maetang Elephant Camp and 1 executive. The quantitative research was conducted by using a questionnaire administered with 400 Chinese tourists travelling at Mae Taeng Elephant Camp. Fundamental quantitative data were analyzed by using descriptive statistics while qualitative data were analyzed by using content analysis technique and estimation of causal influence in structural model with deductive statistics with parameter technique of Maximum livelihood.
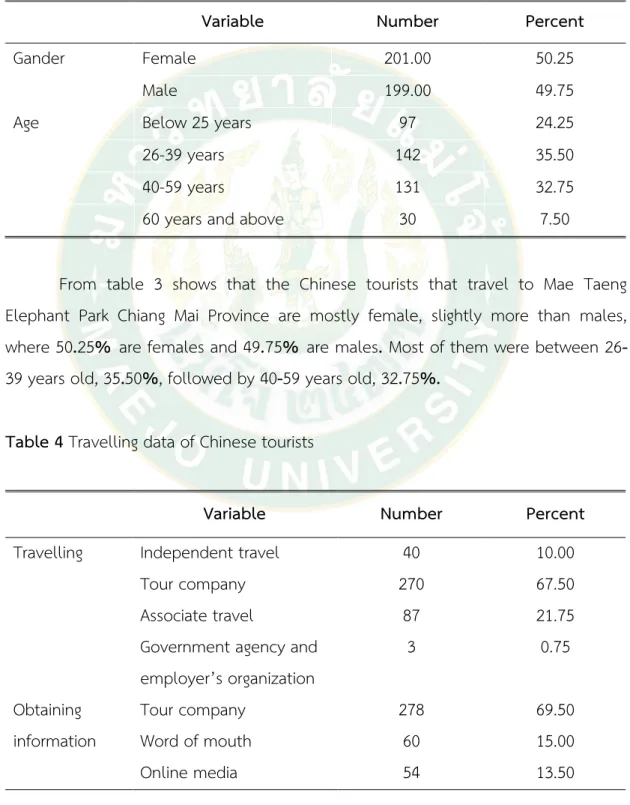
Findings revealed that the respondents had opinions towards Maetang Elephant Camp as follows. They mostly travelled with travel agencies and received information from travel agencies. Most of them visited there for the first time.
Services which the tourists mostly selected was elephant performance, followed by riding elephant or cart, visiting tribal villages, rafting and playing zip line, respectively.
Tourism activities that the respondents were most impressed was elephant riding followed by elephant performance, tribal village visiting, rafting, cart riding and zip- line playing, respectively. Factors that influenced customer’s loyalty of Mae Taeng Elephant Camp visitors with statistical significance at 0.05 were 1) customer expectation, 2) customer satisfaction, 3) customer’s value perception, 4) customer’s
E quality perception with causal influence of 0.84, 0.68, 0.54 and 0.41, respectively.
Recommendations were as follows: 1) creation of good customer’s expectation; in other words, creating good feeling and having experience with elephants to bring enjoyment and safety as well as excitement; 2) satisfying customers that used; services which the respondents were pleased and impressed included elephant performance, elephant riding, cart riding, tribal village visiting and zip line playing; and 3) creating the perception of quality to customers, that is, 1) product: emphasizing quality of service quality including elephant performance, elephant riding, cart riding, tribal village visiting, rafting and zip-line playing, 2) facility:
maintaining nature of the place with clean toilets, clean dining room and convenient parking space, 3) price: determining reasonable price, 4) sale promotion: including travel agencies and online sale promotion, and 5) services: staff providing services with honesty, hospitality and politeness and can help when the tourists have problems. They also need to provide fast service and reliable security system.
F
ACKNOWLEDGE MENTS
ACKNOWLEDGEMENTS
This research is the work of the researcher that has devotedut most attention, intelligence, physical strength, and spirit, until the its successful completion. With the assistance, advice, and help from many parties especially Dr. Winitra Leelapattana, Advisory Committee Chairperson, who gave up valuable time, provided knowledge, advice, and counsel, as well as good care and attention, until the research had been successfully completed, along with Dr. Yuttakarn Waiapa and Assistant Professor Dr.
Suriyajaras Techatunminasakul, Advisory Committee, including the manager of Mae Taeng Elephant Park, Dr. Boontha Chailert, who gave aid and help in the successful completion of this research, thus I would like to express my gratitude and my highest thanks here.
I would like to give the highest thanks here to my father, mother, and relatives that were a positive encouragement, providing support and counseling in both studies and life.
Nuoxiang Sha
G
TABLE OF CONTENTS
Page ABSTRACT (THAI) ... C ABSTRACT (ENGLISH) ... D ACKNOWLEDGEMENTS ... F TABLE OF CONTENTS ... G LIST OF TABLES ... I LIST OF FIGURES ... J
CHAPTER 1 INTRODUCTION ... 1
Background ... 1
Research Problem ... 3
Research Question ... 4
Objectives of the Study ... 4
Expected Results ... 4
Scope of the Study ... 5
Definition of Terms ... 5
Operation Definitions ... 6
CHAPTER 2 REVIEW OF RELATED LITERATURE ... 9
Brand Loyalty ... 9
Customer’s Satisfaction, Customer’s Expectation, Perceived Value and Customer Complaint ... 12
Perceived Quality ... 23
Relevant Research ... 27
H
Overviews ... 32
Conceptual Framework in Research ... 37
Research Hypothesis ... 46
CHAPTER 3 RESEARCH METHODOLOGY ... 47
Location of the Study ... 47
The Population and Sampling Procedures ... 47
Measurement of Variables ... 49
Instrument of the Research ... 51
Quantitative Research ... 51
Instrument Quality Development... 52
Data Gathering ... 53
Data Analysis ... 54
CHAPTER 4 RESULTS AND DISCUSSION ... 55
Part 1: Results of the analysis of data on general information and travelling data of Chinese tourists travelling to Mae Taeng Elephant Park, Chiang Mai ... 56
Part 2: Results of the analysis of feedback data on expectations, perceived value, perceived quality, satisfaction, and complaints towards Chinese tourists’ loyalty to Mae Taeng Elephant Park, Chiang Mai Province ... 58
Part 3: Result of causal influence analysis of expectation, quality perception, value perception, satisfaction and customer’s complaint on loyalty of Chinese tourists visiting Mae Taeng Elephant Park, Chiang Mai Province ... 69
Part 4: Result of suggestion data analysis of Chinese tourists towards service quality improvement of Mae Taeng Elephant Park, Chiang Mai Province ... 73
CHAPTER 5 RESULTS AND DISCUSSION ... 75
Summary ... 75
I
Implication ... 82
Recommendation ... 91
APPENDIX ... 97
Appendix A Questionnaires ... 98
Appendix B The Result of Reliability Analysis ... 122
Appendix C The Result of SPSS Data Analysis ... 132
Appendix D The Result of LISREL Data Analysis ... 143
Appendix E Curriculum Vitae ... 185
REFERENCES ... 186
CURRICULUM VITAE ... 186
I
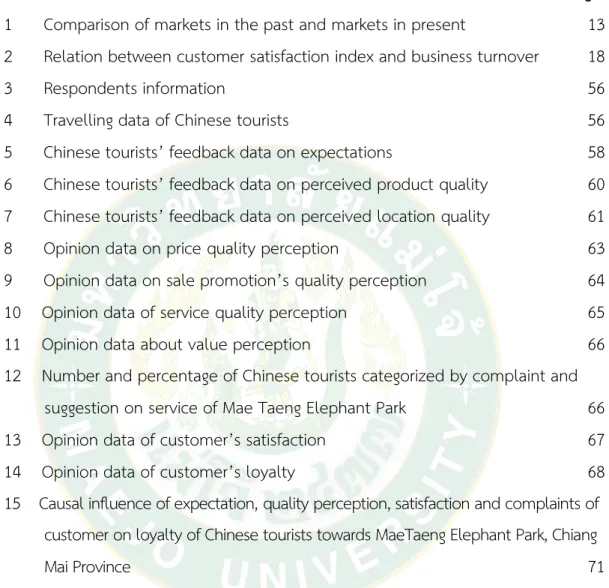
LIST OF TABLES
Table Page
1 Comparison of markets in the past and markets in present 13 2 Relation between customer satisfaction index and business turnover 18
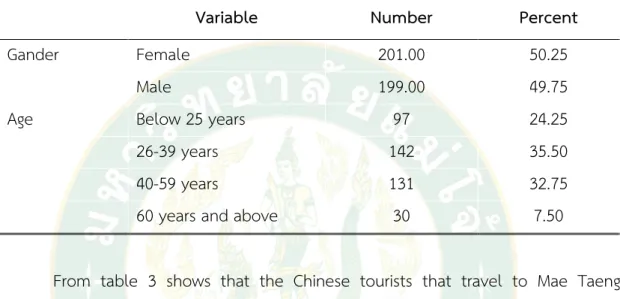
3 Respondents information 56
4 Travelling data of Chinese tourists 56
5 Chinese tourists’ feedback data on expectations 58 6 Chinese tourists’ feedback data on perceived product quality 60 7 Chinese tourists’ feedback data on perceived location quality 61
8 Opinion data on price quality perception 63
9 Opinion data on sale promotion’s quality perception 64
10 Opinion data of service quality perception 65
11 Opinion data about value perception 66
12 Number and percentage of Chinese tourists categorized by complaint and suggestion on service of Mae Taeng Elephant Park 66
13 Opinion data of customer’s satisfaction 67
14 Opinion data of customer’s loyalty 68
15 Causal influence of expectation, quality perception, satisfaction and complaints of customer on loyalty of Chinese tourists towards MaeTaeng Elephant Park, Chiang
Mai Province 71
J
LIST OF FIGURES
Figure Page
1 National Income and NCSI 16
2 Labor Productivity and NCSI 17
3 Unemployment Rate and NCSI 17
4 Countries with national customer satisfaction survey 19
5 ACSI Model 20
6 The model of causal influence of expectation, quality perception,
satisfaction and complaints of customers on loyalty of Chinese tourists 69 7 Model of chi-square testing concordance of the model and statistics 70
1
CHAPTER 1 INTRODUCTION
Background
Tourism is a part of service sector that plays an essential role in driving and restoring economy of Thailand and it is regarded as high potential sector. In 2015, 29.8 million foreign tourists travelled to Thailand bringing income for 1.7 trillion Baht.
Among these people were tourists from East Asia, with increasing amount of 66.50%
resulted from the rapid increase of tourists from China and Malaysia, around 7.9 and 3.4 million people respectively (Department of Tourism, 2015: Online).
It is undeniable that Chiang Mai is a scenery town that tourists all over the world dream to visit at least once in their lifetime. After the movie “Lost in Thailand” (shot at the outstanding location of Chiang Mai) was released in China in 2012, the behavior of modern Chinese tourists changed as they desired to visit Chiang Mai for different reasons: one was to follow the movie, while another was Chinese government allowing travel to Thailand. In 2015, Chinese tourists visited Thailand roughly in amount of 2.8 million people (Department of Tourism, 2015:
Online)
Most appealing tourist directories in Chiang Mai included historic sites (for example: Doi Suthep Temple, Prasing Temple and Chiang Mai City Gate etc.) or events like animal shows (Chiang Mai zoo, Night Safari etc.). Traditional tourist activities such as walks, visiting city’s downtown, Chiang Mai city hall, markets, food centers, observing multiple cultural performances etc. were very popular as well.
Finally, travelling to natural locations: waterfalls and geysers, Mountain or health- related venues such as SPAs, traditional Thai massages etc. Nonetheless, Elephant Camp in Chiang Mai is one of the most popular location for Chinese tourists. There are 4 large Elephant Camps that provide services of elephant riding and elephant shows - Mae Taeng Elephant Camp, Mae Sa Elephant Camp, Chokchai Elephant Camp and Maetaman Elephant Camp. Among these, Mae Taeng Elephant Camp is most famous in Chinese tourists’ opinion, especially since it was used in “Lost in
2 Thailand” movie and additionally it also have good marketing strategies. Mae Taeng Elephant Camp is quite sizable camp with 98 elephants, 571 employees (383 regular employees and 188 part-time employees). From around 520,000 tourists visiting this site, 70% of this amount are Chinese tourists - in 2015 it was 364,000 tourists; the remained include Malaysian, Korean and Middle Eastern tourists. Mae Taeng Elephant Camp provides elephant shows, elephant riding, ox-cart riding, rafting, most famous Chiang Mai Zip line and living in traditional, tribal house. Undoubtedly, Mae Taeng Elephant Camp has been extremely successful in operating tourism business for years and because of that it has been awarded by Department of Tourism “Excellent Elephant Camp” for last 5 years. Furthermore, it also holds high standard in various tourist assets including prizes for Best Tourist Attraction and 5-star Halal Restaurant.
The impact on local community was undoubtedly enormous, as Mae Taeng Elephant Camp employers around 571 people (mahouts, workers, cooks and officers) who create monthly value of employment approximately 84 million Baht. Additionally, benefits are shared with tourist and travel agencies within around 500 million Baht/year and Mae Taeng Elephant Camp pay government taxes at least 100 million Baht/year (Boontha Chailert, 2016: interview)
The success of Mae Taeng Elephant Camp is because of constant improvements according to tourist expectations, which resulted in customers loyalty (especially Chinese tourists) there are four main reasons to be pointed out: (1) Strong position among other camps, providing unique products and Services, (2) “Lost in Thailand” movie advertisement and promotion, (3) Successful strategy of sharing benefits with the community and (4) Creating well-established network. (Suriyajaras Techatanminsakul, 2016: interview). Akarapong Anthong and Mingsap Khaosa-ad (2015) destination source credibility was a part of marketing mix in terms that tourists would perceive interesting to travel to. “Created image of destination directly and positively influenced the value of the destination, attributes and overall satisfaction”
and “The perceived value was a factor that directly influenced attributes and overall satisfaction which was influenced by attribute satisfaction. Overall satisfaction directly affected Destination loyalty” (Chokniti Sanglaor and Suchada Korapetchpranee, 2015:25). Both issues were consistent with Songsom in part, stating that product
3 loyalty or determination of customers to purchase products and services that they would like in the future. Songsom changed the marketing situation when the customers are committed to product, service or brands that can be measured from willingness in terms of patronage and recommendation (Songsom and Trichun, 2012:
42). The factors that affected products and service were various: customer satisfaction and quality perception of consumers (Piti Tantakasem, 2003; Claes Fornell et al., 1996).
However, Nattaphat Lorpraditpong (2013) stated that to calculate national satisfaction index by using Multi-equation Econometric Model with crucial factors to define customer’s satisfaction could comprise 3 main components: customer expectations, quality and value. If customer’s satisfaction is positive, it will lead to customer loyalty and consequently if it’s negative, it will cause customer complaints.
Research Problem
Based on the data above that the business of the Mae Taeng Elephant Park has an impact on the economy and tourism of the in Chiang Mai province. is causing employment in the community and create a good image of the tourism industry.
Which The factors that will affect the success of Mae Taeng Elephant is the quality of service that result in children born after fulfillment services create value in the eyes of consumers. The three factors that contribute to customer satisfaction and the customer has no reason to complain. As a result, customer loyalty.
It is decided that to provide successful strategy of developing tourist attractions in other Elephant Camps in Thailand, customer loyalty must be reached, especially with Chinese Tourists. Studying should be held on causal influence of tourists’ expectations, perceived quality, perceived value, satisfaction and complaints, based on research in Mae Taeng Elephant Camp. The research would be used as information for Elephant Camp entrepreneurs in Chiang Mai to define strategies that will flourish in successful business.
4 Research Question
1. What are different among Chinese tourists’ expectations, quality perception, value perception, satisfaction, complaint and loyalty toward Mae Taeng Elephant Park in Chiang Mai Thailand.
2. The Expectations, Perceived Quality, Perceived Value, Satisfaction and Complaints of Chinese Tourists influence to the Loyalty of Mae Taeng Elephant Park, Chiang Mai, Thailand.
3. What are appropriate suggest that the Mae Taeng Elephant Park improve the quality of service in the future.
Objectives of the Study
1. Explain Chinese tourists’ expectations, quality perception, value perception, satisfaction, complaint and loyalty toward Mae Taeng Elephant Park in Chiang Mai province.
2. Discuss the Causal Influence of Expectations, Perceived Quality, Perceived Value, Satisfaction and Complaints of Chinese Tourists to the Loyalty of Mae Taeng Elephant Park, Chiang Mai, Thailand.
3. To find out appropriate suggest that the Mae Taeng Elephant Park improve the quality of service in the future.
Expected Results
1. The discovery from this research is used as an information for Mae Taeng Elephant Camp and elephant camp entrepreneurs in Chiang Mai Province to improve service for better quality and to provide customers satisfaction and assure their loyalty.
2. The discovery from this research is used as information for the government to strategize standard development for Elephant Camp management in Thailand.
5 Scope of the Study
This research is scoped as follows:
1. Content scope: the research focuses on causal influence of expectations, quality perception, value perception, satisfaction, complaint of customers on loyalty of Chinese tourists toward Mae Taeng Elephant Camp in Chiang Mai Province.
2. Population Scope: population in this research includes Chinese tourists who visit Mae Taeng Elephant Camp in Chiang Mai Province.
3. Term content: this research takes 1 year from October 2016 to October 2017(collect data in high season only 4 months).
Definition of Terms
Customer loyalty is real determination of Chinese customers to purchase products and services at Mae Taeng Elephant Camp regularly in the future as they are committed to products, services or brands. This can be measured from willingness in term of patronage and recommendation. Therefore, customer loyalty can be measured from buying products and services again and recommending service to other customers. The measurement includes products impression, possibility of using service in the future and possibility of convincing other people to use services. (Piti Tantakasem, 200; Nattaphat Lorpraditpong, 2013; Claes et al., 1996)
Satisfaction means satisfaction of Chinese tourists after using services at Mae Taeng Elephant Camp. The measurement is satisfaction with services meeting the needs and satisfaction with services beyond expectation. (Gorson, 2003: 20; Kotler, 1997: 40; Nattaphat Lorpraditpong, 2013)
Perceived Quality means determining quality of tourism products after service which can be evaluated in 3 issues as follows: overall quality, long-term products and service credibility that are consistent with or meets the needs of consumers. (Nitiphon Putachote, 2010; Nattaphat Lorpraditpong, 2013) Laksamee Saraban (2013, Online).
6 Customer’s expectation means collecting vision and imagination about products and services that are held in Mae Taeng Elephant Camp for Chinese tourists from analyzing information from media, advertisements and sale promoters before travelling to Mae Taeng Elephant Camp. Measurement is that after collecting information about Mae Taeng Elephant Camp, tourists’ experience must be associated with good feelings, excitement, enjoyment and safety. (Nattaphat Lorpraditpong, 2013)
Value Perception means evaluating worthiness of service and price that tourists pay for products. That is to say, satisfaction with price at current rate.
Measurement is that travelling to Mae Taeng Elephant Camp is worth money and time with proper service rate for elephant ridings, cart ridings, rafting, zip lines, and living in traditional, tribal houses visited with food and beverage cost that is suitable for tourists. (Nattaphat Lorpraditpong, 2013)
Customer’s complaint means what Chinese tourists complain about Quality services of Mae Taeng Elephant Camp. (Nattaphat Lorpraditpong, 2013)
Operation Definitions
Customer’s expectation means collecting vision and imagination about products and services that are held in Mae Taeng Elephant Camp for Chinese tourists from analyzing information from media, advertisements and sale promoters before travelling to Mae Taeng Elephant Camp.
Measurement is that after collecting information about Mae Taeng Elephant Camp, tourists’ experience must be associated with good feelings, excitement, enjoyment and safety.
The Value of Measurement customers opinion with rating scale according to approach of Likert Scale that opinion is rated in 5 levels as : (1) Highly agree scaled as 5 (2) Moderately agree scaled as (3) Slightly agree scaled as 3 (4)Moderately disagree scaled as 2 and (5) Highly disagree scaled as 1.
Quality perception means determining quality of tourism products and service after service which can be evaluated in 5 issues as follows: overall quality,
7 long-term products and service credibility that are consistent with or meets the needs of consumers. Measurement is opinions of customers on marketing mix in 5 terms as follows: Perceived Quality of Products. Perceived Quality of Place. Perceived Quality of Price, Perceived Quality of Promotion and Perceived Quality of Service.
The Value of Measurement customers opinion with rating scale according to approach of Likert Scale that opinion is rated in 5 levels as: (1) Highly agree scaled as 5 (2) Moderately agree scaled as (3) Slightly agree scaled as 3 (4)Moderately disagree scaled as 2 and (5) Highly disagree scaled as 1.
Value Perception means evaluating worthiness of service and price that tourists pay for products. That is to say, satisfaction with price at current rate.
Measurement is that travelling to Mae Taeng Elephant Camp is worth money and time with proper service rate for elephant ridings, cart ridings, rafting, zip lines, and living in traditional, tribal houses visited with food and beverage cost that is suitable for tourists.
The Value of Measurement customers opinion with rating scale according to approach of Likert Scale that opinion is rated in 5 levels as: (1) Highly agree scaled as 5 (2) Moderately agree scaled as (3)Slightly agree scaled as 3 (4)Moderately disagree scaled as 2 and (5)Highly disagree scaled as 1
Satisfaction Measurement opinion of customer with satisfaction of Chinese tourists after using services at Mae Taeng Elephant Camp. The measurement is satisfaction with services meeting the needs and satisfaction with services beyond expectation.
Customer loyalty is real determination of Chinese customers to purchase products and services at Mae Taeng Elephant Camp regularly in the future as they are committed to products, services or brands. This can be measured from willingness in term of patronage and recommendation. Therefore, customer loyalty can be measured from buying products and services again and recommending service to other customers.
The measurement includes products impression, possibility of using service in the future and possibility of convincing other people to use services.
8 The Value of Measurement customers opinion with rating scale according to approach of Likert Scale that opinion is rated in 5 levels as: (1) Highly agree scaled as 5 (2) Moderately agree scaled as (3) Slightly agree scaled as 3 (4) Moderately disagree scaled as 2 and (5) Highly disagree scaled as 1
Customer’s complaint means what Chinese tourists complain about Mae Taeng Elephant Camp.
Measurement is including proportion between product and service that the customers make a complaint or feels dissatisfied. Divide by The total number of items The Value of Measurement customers opinion with rating scale according to approach of Likert Scale that opinion is rated in 5 levels as: (1) Highly agree scaled as 5 (2) Moderately agree scaled as (3) Slightly agree scaled as 3 (4)Moderately disagree scaled as 2 and (5)Highly disagree scaled as 1.
9
CHAPTER 2
REVIEW OF RELATED LITERATURE
Literary review is reviewing relevant concepts, theories and researches as basic knowledge in the research to create conceptual framework and hypothesis which are presented in sequence as follows:
1. Brand Loyalty
2. Customer’s Satisfaction, Customer’s Expectation, Perceived Value and Customer Complaint
3. Perceived Quality 4. Related Research
Brand Loyalty
Songsom and Trichun (2012: 42) mentioned that the customers will use product and service of any brands again when they hold loyalty toward the brand.
This is regarded as the result of evaluation after consuming products or services that can be explained based on concepts about consumer behaviors as personal action related to decision making to purchase or use products or services to meet their own needs. Furthermore, customer loyalty was defined as determination of customers to repurchase products and services that will make them satisfied in the future.
Although situations or marketing attempts change, this cannot affect customers to change their liking in the brand and consequently purchase same products from different brands; in other words, the fact that customers are committed to products or services is definitely a brand which can be measured from willingness in form of patronage or recommendation.
Investopedia (2016: online) define Brand loyalty is a pattern of consumer behavior where consumers become committed to brands and make repeat purchases from the same brands over time. Loyal customers consistently purchase products from their preferred brands, regardless of convenience or price. Companies often use different marketing strategies to cultivate loyal customer, including loyalty
10 programs (i.e. rewards programs) or trials and incentives (such as samples and free gifts). Companies that successfully cultivate loyal customers sometimes work with brand ambassadors, consumers who market the brand and communicate with it positively about it among their friends both online and in real time. This is free word- of-mouth marketing for the company and is often an effective way of building brand loyalty. In a competitive marketplace, brands need to maintain continuous meaningful engagement in order to identify consumer needs and expectations.
Brands are most successful when they address emotional values that are important to their target customers. When the value identification is correct, it leads to more customer engagement and higher numbers of repeat customers. High repeat customer rates lead to higher profits for brands.
Wikipedia (2016: Online) define Brand loyalty is defined as positive feelings towards a brand and dedication to purchase the same product or service repeatedly now and in the future from the same brand, regardless of a competitor’s actions or changes in the environment. It can also be demonstrated with other behaviors such as positive word of mouth advocacy. Brand loyalty is where an individual buys products from the same manufacturer repeatedly rather than from other suppliers.
Businesses whose value rests in a large part on their brand loyalty are said to use the loyalty business model. A brand is seen as an idea or concept, not a product. This concept of a brand displays imagery and symbolism for a product or range of products. Brands can have the power to engage consumers and make them feel emotionally attached. Consumer’s beliefs and attitudes make up brand images, and these affect how they will view brands they come into contact with Brand experience occurs when consumers shop for or search for, and consume products.
Holistic experiences such as sense, relation, acting and feeling occur when one comes into contact with brands. The stronger and more relational these senses are to the individual, the more for likely repeat purchase behavior will occur. After contact has been made, psychological reasoning will occur, followed by a buy or not-buy decision. This can result in repeat purchase behavior, thus incurring the beginning of brand loyalty. Brand loyalty is not limited to repeat purchase behavior, as there is deeper psychological reasoning as to why an individual will continuously
11 re-purchase products from one brand. Brand loyalty can be shortly defined as the
‘behavioral willingness to consistently maintain relations with a particular brand’ In a survey of nearly 200 senior marketing managers, 68 percent responded that they found the "loyalty" metric very useful. True brand loyalty occurs when consumers are willing to pay higher prices for a certain brand, go out of their way for the brand, or think highly of it. Brand loyalty in marketing, consists of a consumer’s devotion, bond, and commitment to repurchase and continue to use a brands product or service over time, regardless of changes with competitors pricing or changes in the external environment. Brand loyalty reflects a customer's commitment to remain in a relationship for a long period of time with a brand. A critical factor of building brand loyalty is developing a connection or relationship between the consumer and the brand. When an emotional relationship is created between the consumer and the brand this leads to a strong bond and a competitive advantage for that particular brand. Loyalty consists of both attitudinal and behavioural components. Attitudinal loyalty relates to the customers willingness to purchase product or service from the brand at any reasonable cost. Behavioural loyalty is the re-purchasing. Both behavioral and attitudinal components are important. One example is that a consumer displays behavioural loyalty by buying Coke when there are few alternatives available and attitudinal loyalty when they will not buy an alternative brand when Coke is not available. The attitudinal component is psychological, this leads to the behavioural action of repeat purchase. It is the attitudinal loyalty that drives most loyalty behaviour and ensures loyalty over time not just with one purchase. “Brand loyalty is desired by firms because retention of existing customers is less costly than obtaining new ones. Firms profit from having loyal customers”
Therefore, customer loyalty can be measured from opportunity to use service again along with recommending same service to other people. However, brand loyalty also depends on various factors, such as customer satisfaction and perception of quality (Piti Tantakasem, 2003); Fornell et al., 1996).
Customer Loyalty can be measured from probability of customers to purchase products and services again in the future. (Nattaphat Lorpraditpong , 2013)
12 Customer’s Satisfaction, Customer’s Expectation,
Perceived Value and Customer Complaint
Kotler (1997: 40) said that the satisfaction of our customers. A sense of satisfaction or disappointment at the result of a comparison between the benefits of the product features. Or function of the product to the customer's expectations.
Gorson (2003: 20) defined “satisfaction” as customer’s satisfaction occurring when products or services meet the needs or are beyond expectation of customers.
Quality means whether the customers feel satisfied or always mention it when they use that product or service. Benefits of quality and satisfaction consist of:
1. It initiates instinct to win and to be successful that results in better service quality for customers.
2. It makes us aware of present limits of normal performance standard and possible best standard that will lead to better quality and higher satisfaction.
3. It makes us know what should be improved in terms of quality and satisfaction as it will drive us to work better with higher efficiency.
Nattaphat Lorpraditpong (2013: 1-7) mentioned that in current marketing world, product manufacturers and service providers intensively compete with each other and many businesses are trying to create uniqueness for their product and services. Marketing personnel try to share mix of marketing ways to focus on penetrating customer groups and impressing customers that have different expectations and needs; customers are categorized by gender, age, or occupation etc. different strategies are applied such as price strategy, unique product design or after-sale service etc.
The statement “Cheap products may not be good and good product may not be cheap” cannot be implemented in present days as we can easily purchase products with good quality at reasonable price. Initially, when industry was developed, manufactures would attract customers by focusing on developing products and service quality along with production process improved with efficiency.
They tried to reduce the capital by not emphasizing on manufacturing products to meet customers’ need but doing the research and developing their own products to
13 be different from the competitors. Thus, products and services were not various and consumers had only few options. Furthermore, as the information was not complete, consumers had lower expectation at current time, that is to say, only few types of products could be sold because consumers had no alternatives or the market belonged to manufacturers.
When products were developed to have good quality and other opponents could develop their products to have quality equivalent to the market leaders in the period that commerce and trading substantially expanded, manufacturer used price strategies such as discount, exchange or even premium. The manufactures with low capital would be advantages to set low price and they emphasized on quantity rather than quality and satisfaction. Besides, they focused on production process improvements more than satisfaction of customers along with product and service distribution to reduce transport costs. However, in this seamless world, information is sent all around the world with low capital and in short time. The consumers in other hemisphere could perceive information about products and services of the other in seconds and it is not difficult to deliver products and services. Therefore, this is truly an era of consumers and the manufacturers have less bargaining power while consumers have more power resulting higher expectation. However, products with good quality and reasonable price are still essential factors; if every manufacturer could do it easily, competition would be focused on service that customers’
satisfaction is an important factor in competition.
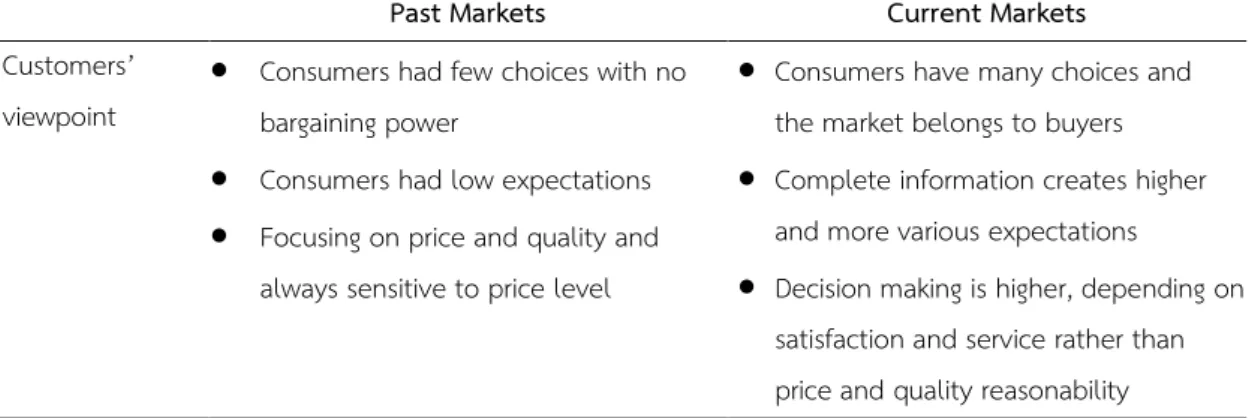
Table 1 Comparison of markets in the past and markets in present
Past Markets Current Markets
Customers’
viewpoint
Consumers had few choices with no bargaining power
Consumers had low expectations
Focusing on price and quality and always sensitive to price level
Consumers have many choices and the market belongs to buyers
Complete information creates higher and more various expectations
Decision making is higher, depending on satisfaction and service rather than price and quality reasonability
14 Table 1 (continued)
Past Markets Current Markets
Manufacturers’
viewpoint
They had bargaining power over consumers, products and services in their own way
The manufacturers did not need to have knowledge about customers
They emphasized on price and quality rather than customers’
satisfaction
They focused on production process rather than customers
They have less bargaining power
Knowledge about customers is essential factor to maintain competitiveness
They prioritize price, quality and customers’ satisfaction
They focus on bringing satisfaction and expectations of customers for product and service development
Source: Nattaphat Lorpraditpong (2013: 2)
According to the study result by The American Society of Quality (ASQ), it was found that causes that made business to lose its customers was that proportionately 2/3 of customer stopped purchasing products and services from that company due to dissatisfaction with products and services, as well as lack of care of the staff. Simply, the company failed to bring satisfaction to its customers, while it was only 9% of customers that were snatched by the competitor and only 5% of customers who were persuaded or forced to use other products instead.
1. 68% of customers who used products and services of the competitor because staff lacked in caring about customers
2. 14% of customers felt dissatisfied with products and services provided by the company
3. 9% of customers were snatched by the competitors
4. 5% of customers were influenced by their close associates with force or persuasion
5. 1% of customers passed away
15 Furthermore, there was an interesting survey explaining the reasons why customers decide to use certain products and services: 50% was based on impression in service and professional staff care while technical or technological expertise was only 7%. On the contrary, 40% of customers decided to purchase products or services with dissatisfaction and among those only 8% gave reasons about unreasonable price and unpleasing quality.
Based on this, decision to purchase products and services or to stop purchasing or using them was mainly caused by satisfaction, rather than because of competitors, price and quality or influence from other factors. Each manufacturer did not directly compete with another but were forced to upgrade their own systems to bring satisfaction to customers promptly and to manage the needs. At the end, the company that possess proper system of perceiving customer’s satisfaction and immediate problem solving will be advantageous over competitors and could possess higher market share.
In addition, customer’s satisfaction is regarded as one of valuable assets of the business. Although customer’s satisfaction is intangible compared to business’s tangible assets in the past (building, equipment, land etc.), it is essential that the business cumulates and strengthens if it wants to maintain its competitiveness and it also ensures profit in the future. Current businesses tend to increasingly possess Intangible Asset but some may have Intangible Asset more than Tangible Asset.
Successful businesses use customer’s satisfaction as leading indicator to create turnover in the future because considering it from only financial statements, like in the past just studying previous information, could not guarantee product distribution in the future. However, if customers are satisfied with products and services, they will purchase them again and they may recommend them further. This would bring good turnover and create profit – profit that could predict the turnover to the certain extent in the future.
Concepts of customers’ satisfaction in macro-viewpoint are to be considered with crucial macroeconomic factors (national income, employment/ unemployment, consumer price index, balance on current accounts and balance of payments etc.) and these macro-indicators could reflect national economy as a result of previous
16 transactions of the country. The survey will be conducted when transactions are completed, to measure overall operation or results. Sometimes result measurement is not up-to-date in terms of situation or fluctuation; thus, National Customer Satisfaction Index – NCSI is a leading indicator that can reflect country’s future turnover tendency of the business or competitiveness of. This could indicate whether domestic and international products and services will be needed by consumers in the future; in other words, if such products and services can be sold well. In case customer satisfaction index is elevated, customers are satisfied with products and services at present and tend to purchase them again in the future.
Products are salable leading to rise in production, employment and investment in the future.
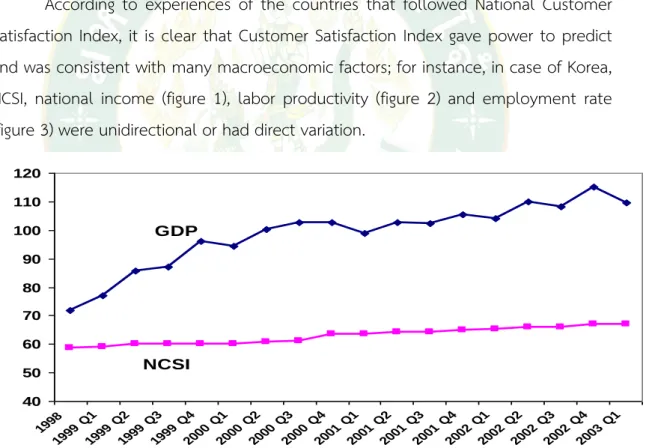
According to experiences of the countries that followed National Customer Satisfaction Index, it is clear that Customer Satisfaction Index gave power to predict and was consistent with many macroeconomic factors; for instance, in case of Korea, NCSI, national income (figure 1), labor productivity (figure 2) and employment rate (figure 3) were unidirectional or had direct variation.
Figure 1 National Income and NCSI Source: Nattaphat Lorpraditpong (2013: 3)
40 50 60 70 80 90 100 110 120
1998 1999 Q1
1999 Q2 1999 Q3
1999 Q4 2000 Q1
2000 Q2 2000 Q3
2000 Q4 2001 Q1
2001 Q2 2001 Q3
2001 Q4 2002 Q1
2002 Q2 2002 Q3
2002 Q4 2003 Q1 GDP
NCSI
17
Figure 2 Labor Productivity and NCSI Source: Nattaphat Lorpraditpong (2013: 3)
Figure 3 Unemployment Rate and NCSI Source: Nattaphat Lorpraditpong (2013: 4)
40 50 60 70 80 90 100 110 120
19981999 Q1 1999 Q2
1999 Q3 1999 Q4
2000 Q1 2000 Q2
2000 Q3 2000 Q4
2001 Q1 2001 Q2
2001 Q3 2001 Q4
2002 Q1 2002 Q2
2002 Q3 2002 Q4
2003 Q1 NCSI
Labor Productivity
%
54 56 58 60 62 64 66 68
19981999 Q1 1999 Q2
1999 Q3 1999 Q4
2000 Q1 2000 Q2
2000 Q3 2000 Q4
2001 Q1 2001 Q2
2001 Q3 2001 Q4
2002 Q1 2002 Q2
2002 Q3 2002 Q4
2003 Q1 0 1 2 3 4 5 6 7 8 9
NCSI (%) Une m poym e nt (%)
Unemployment NCSI
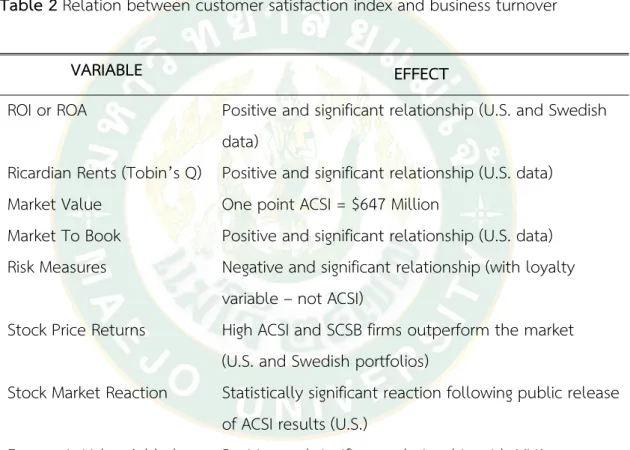
18 In case of USA, according to the research of Michigan University, it was found that American Customer Satisfaction Index: ACSI was consistent with business-level turnover index such as Return on Investment (ROI) or Return on Asset (ROA). ACSI was associated with both variables with statistical significance and had direct variation with Value Added that business could create. Whenever ACSI was reported, stock exchange would respond in the same way of survey result; besides, the researcher could calculate customer satisfaction in market values (table 2).
Table 2 Relation between customer satisfaction index and business turnover
VARIABLE EFFECT
ROI or ROA Positive and significant relationship (U.S. and Swedish data)
Ricardian Rents (Tobin’s Q) Positive and significant relationship (U.S. data) Market Value One point ACSI = $647 Million
Market To Book Positive and significant relationship (U.S. data) Risk Measures Negative and significant relationship (with loyalty
variable – not ACSI)
Stock Price Returns High ACSI and SCSB firms outperform the market (U.S. and Swedish portfolios)
Stock Market Reaction Statistically significant reaction following public release of ACSI results (U.S.)
Economic Value Added Positive and significant relationship with MVA
Source: Nattaphat Lorpraditpong (2013: 4)
From above, national customer satisfaction index was as beneficial and important as macroeconomic indicators such as national income, productivity, unemployment rate, and inflation rate. Furthermore, it could be used as an instrument to measure brand loyalty of customers and to predict future turnover of the business. In addition, Customer Satisfaction Index was popular and widely
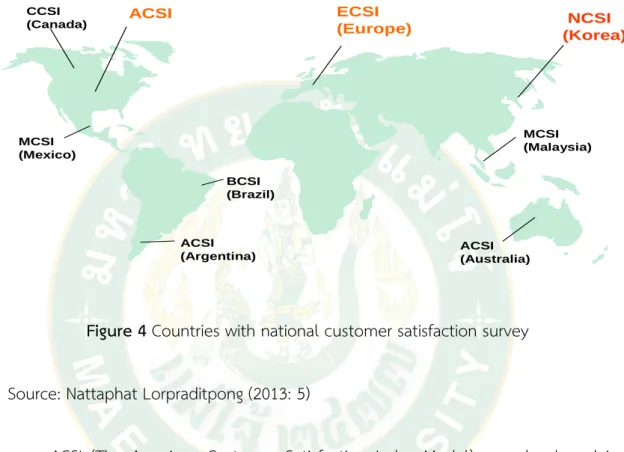
19 surveyed in many countries (Figure 4) with similar model and survey method that the surveyed data could be used to compare product and service quality along with competitiveness in national and industrial levels.
Figure 4 Countries with national customer satisfaction survey Source: Nattaphat Lorpraditpong (2013: 5)
ACSI (The American Customer Satisfaction Index Model) was developed in 1994 as the macroeconomic index to reflect products and service quality and consumer’s satisfaction with domestically-produced materials and services along with international products and service distributed in The United States of America.
The reason why ACSI played a great role in US economy was because customer satisfaction always affected future trends of the business and how much it could sell products and services leading to turnover and later to the profit of the company.
This finally indicated competitiveness of the country. Furthermore, in ASCI Business level, it could enable the business to measure customers’ loyalty and find weak points causing dissatisfaction and it could be used to compare products and services that are domestically and internationally manufactured.
ECSI
(Europe) NCSI
(Korea)
MCSI (Malaysia)
ACSI (Australia) ACSI
(Argentina) BCSI (Brazil) MCSI
(Mexico) CCSI
(Canada) ACSI
20 Calculation of American Customer Satisfaction Index was based on Multi- equation Econometric Model with essential factors to define customer satisfaction consisting of 3 main components including customer expectation, perceived quality and perceived value. Positive customer satisfaction would affect customer loyalty but negative one would cause customer complaints (Figure 5)
Figure 5 ACSI Model
Source: Nattaphat Lorpraditpong (2013: 6)
ACSI Model from Figure 5 detail as follow:
1. Customer Expectations happen from experience of using products and services along with information perception from media, advertisement and sale promotion officers.
2. Perceived Quality can be evaluated within 3 major questions including overall quality, reliability and accordance with customer’s need.
3. Perceived Value can be evaluated with 2 questions including satisfaction with price at current quality and satisfaction with quality at current price. According to the model, perceived value will directly affect customer satisfaction while influenced by Perceived Quality and Perceived Value.
4. Customer Complaint is measured from proportion of consumers who have complaint or dissatisfaction with products and services.
21 5. Customer Loyalty can be measured from probability of customers to purchase products and services again in the future.
This is consistent with Akkarapong Anthong and Mingsap Khaosaad (2011) identifying that destination credibility was a part of marketing mix in term of promotion that would make tourist perceive destination image which directly influenced perceived value.
Besides, Chokniti Sanglaor and Suchada Korapetchpranee (2015: 25) stated that for attribute satisfaction and overall satisfaction, perceived value were factors with positive influence on attribute satisfaction and overall satisfaction. Overall satisfaction was positively influenced by attribute satisfaction and was a vital factor affecting Destination loyalty.
The productivity enhancements, once mentioned that for Productivity Improvement, measurement regarded 20% of process while 80% depended on improvement and implementation according to PDCA which was planning, doing, checking and acting to improve and standardize the system. Therefore, in this part, I would like to propose factor of success to provide customer satisfaction as guideline for further application. That is to say, the successful organization with customer satisfaction always comprises following characteristics.
1. Customer Service: customer service means treating customers to meet their expectations and needs. When customers buy products and service, they always expect good service which is more than just payment and goods delivery.
They need information about products, good service, staff who have knowledge about products and can give generous advices. Thus, the business should have good system to perceive customer’s need, understand them and focus on complaints that cause dissatisfaction with well-trained, knowledgeable and proficient personnel.
2. Customer Complaint Management: according to the research, when customers are dissatisfied with products and services, they will tell 8-10 people, while only 1 out of 10 customers will inform the company for further improvement.
The successful company always uses customer complaints to improve business and manage efficiently to bring back reputation, customer satisfaction and loyalty.
22 3. Determination of Executive: it is undeniable that determination of executives is extremely important factor no matter what activities the organization is handling. Providing customer satisfaction is not only the duty of operators but everyone in the organization - especially chief executives have to be good models and remind employees regularly with various methods:
a. Transmitting strategies and work plans to the entire organization including vision, mission that emphasizes customer importance. The manager should always be familiar with employees and customers and every employee should be able to explain about how their work affects customer satisfaction etc.
b. The executives should be a good model to realize customer satisfaction provision-the person must be the role model for employees in every level and subordinates, recruiting qualified employees that have knowledge and proficiency in the position to contact customers, as well as providing training and skill development continually.
c. Praising and rewarding person or the team that is successful in providing customer satisfaction. The reward may be money which is good for an organization but may not be effective to others. Therefore, it should be suitable methods fitting with such organization. Besides, there should be promoting good work environment so that employees van work with happiness and they can deliver best products and services to customers.
d. Creating culture of teamwork and unity especially when they manage with customer complaints that cannot be resolved by an individual or one sector that sometimes it requires Cross Functional Team).
e. Power should be properly given to employees and they should be promoted to consider and decide about how to settle customer complaints for immediate resolution. Such guideline is to promote employees to understand customers better and to respond them quickly for best impression.
4. Technological Emphasis: Current organizations cannot deny that technology is an essential part in business process, for example, a leading company, when receiving customer complaints, will send data to employees in the entire organization along with executives immediately to manage such complaints.
23 However, what should be recognized is that the organization should know how to use technology and not be obsessed with technology that it ignores basic process or investment worthiness.
Perceived Quality
According to the study of Choi and Kim (2013), it was found that perceived value influenced customer satisfaction and loyalty which was consistent with the research of Nazia Yaseen and Mariam Tahira (2011) that perceived value influenced product purchasing. Furthermore,
Laksamee Saraban (2013: Online) said that quality means usage suitability, consistence with requirement. Quality of designing and consistency of operation would lead to pride for work owner along with most savings and could create highest benefit and regularly provide customer satisfaction. The best things include suitability of usage and price of customers or standards, work efficiency and satisfaction.
After studying the meaning of quality defined by experts, the researcher saw that quality was a work with changes and development in meaning. However, its meaning could be summarized in the same way as 3 terms including: conformity standard or requirement, customer satisfaction and proper operation cost.
Considering the quality of the property can be split into two varieties.
1. Quality of Products: can be considered 8 characteristics as capacity, identity, Reliability Compliance requirements, endurance, the ability to provide, services, beauty and Perceived Quality or reputation of the product.
2. Quality of Services: can be considered 8 characteristics as Credit, Demand Responsibilities, Ability, Accessibility, polite, Communications, reliability, security, safety, Customer insight and service feeling.
Somphol Vantamay (2006:2-3) There are various academics defining the concept of perceived quality. The perceived quality is “a specialtype of association, partly because it influences brand associations in many contexts and partly because it has been empirically shown to affect profitability.” And the perceived quality is
“the consumer’s judgment about a product’s overall excellence or superiority.” and
24 perceived quality is (1) different from objective or actual quality, (2) a higher level abstraction rather that a specific attribute of a product, (3) a global assessment that in some cases resemble a attitude, and (4) a judgment usually made within a consumer’s evoked set. Similarly, the definition of perceived quality by Aaker (1991) is “the customer’s perception of the overall quality or superiority of the product or service with respect to its intended purpose, relative to alternatives.” In fact, the perceived quality is different from actual or objective quality, product-based quality, and manufacturing quality. It can be viewed as the difference between overall quality and undetected quality. Furthermore, perceived quality may lead to consumer satisfaction, which is determined by perceived performance and expectation. Although there are a lot of definitions from many scholars, each of the definition has a shared common meaning; that is, perceived product quality is the consumer’s perception of overall components of product--both tangible and intangible characteristics. It may also include performance, features, reliability, conformance, durability, serviceability, and aestheticsetc. Above all, it is different from the actual quality of products.
The perceived product quality has a powerful effect on various variables about business’ performances which can be described as follows:
1) Profit margins Today, the widely-acknowledged importance of the perceived product quality has prompted scholars from a variety of disciplines to investigate and examine the impact of this concept. First, perceived quality affects profit margins. Three evidence is from studies of the Profit Impact of Market Strategy (PIMS) database developed at the Marketing Science Institute and the Strategic Planning Institute in Cambridge during the 1970s and 1980s. This database today contains data from some 3000 business units of 450 companies. The PIMS database is widely recognized as the only complete database in the world of strategic information on many different industries. Studies on the PIMS database dramatically confirm that market-perceived quality has the relationship with return on sales positively. The customers usually rely on perceived brand quality because they want to buy the best possible products, and the enormous profits that owners of
25 successful brands receive are in fact the reward for delivering high quality to their customers. Market-perceived quality boosts margins Return on Sales.
2) Brand Power and Market Share the perceived product quality can result in brand power and dominant market share. Let us now consider how the entrepreneurs and managers create power brands. They must start with a clear sense of needs and desire of a well-defined group of customers. They produce products and supply the associated services that meet those needs exceptionally well.
Effective ‘quality control’ measures ensure they do things right the first time in delivering those products and services. Therefore, they achieve superior quality in areas that matter to the customer together with a cost structure no higher than that of lower-quality competitors. Then, they advertise to communicate their products’
advantages. The customer perceives the quality and the exceptional value is offered.
The result: a power brand is created and dominant market share follows.
3) Brand Equity Aaker (1991) stated that perceived product quality is one of the key dimensions of brand equity as shown in Figure 3. Perceived quality will directly influence purchase decisions and brand loyalty, especially when a buyer is not motivated or able to conduct a detailed analysis. It can also support a premium price which, in turn, can create a gross margin that can be reinvested in brand equity.
The brand equity will provide values to customers by enhancing customers’: (1) interpretation/processing of information (2) confidence in the purchase decision and (3) satisfaction. As part of its role in adding value for the customer, brand equity has also the potential to add values for the firm by increasing (1) efficiency and effectiveness of marketing programs