Southeast Asian Fisheries Development Center
United Nations
Environment Programme Global Environment Facility
Establishment and Operation of a Regional System of Fisheries Refugia in the South China Sea and Gulf of Thailand
REGIONAL GUIDELINES ON INDICATORS FOR
SUSTAINABLE MANAGEMENT OF FISHERIES REFUGIA IN THE SOUTH CHINA SEA AND GULF OF THAILAND
JUNE 2022 REGIONAL GUIDELINES ON INDICATORS FOR
SUSTAINABLE MANAGEMENT OF FISHERIES REFUGIA
IN THE SOUTH CHINA SEA AND GULF OF THAILAND
Cover Graphic and Photo:
Somboon Siriraksophon
Copies of the report can be downloaded from:
Page 1 of 36
Southeast Asian Fisheries Development Center
United Nations Environment Programme
Global Environment Facility
Establishment and Operation of a Regional System of Fisheries Refugia in the South China Sea and Gulf of Thailand
REGIONAL GUIDELINES ON INDICATORS FOR SUSTAINABLE MANAGEMENT OF
FISHERIES REFUGIA IN THE SOUTH CHINA SEA AND GULF OF THAILAND
SEAFDEC/UNEP/GEF Fisheries Refugia
2022
Page 2 of 36
First published in Phrasamutchedi, Samut Prakan, the Kingdom of Thailand in June 2022 by the SEAFDEC/UNEP/GEF Fisheries Refugia Project, Training Department of the Southeast Asian Fisheries Development Center
Copyright © 2022, SEAFDEC/UNEP/GEF Fisheries Refugia Project
This publication may be reproduced in whole or in part and in any form for educational or non-profit purposes without special permission from the copyright holder provided acknowledgment of the source is made. The SEAFDEC/UNEP/GEF Fisheries Refugia Project would appreciate receiving a copy of any publication that uses this publication as a source.
No use of this publication may be made for resale or for any other commercial purpose without prior permission in writing from the Project Manager of the SEAFDEC/UNEP/GEF Fisheries Refugia Project.
SEAFDEC/UNEP/GEF Project Coordination Unit Training Department
Southeast Asian Fisheries Development Center
Postal Address: P.O.Box 97, Phrasamutchedi, Samut Prakan, Kingdom of Thailand Tel: (66) 2 425 6100
Fax: (66) 2 425 6110
https://fisheries-refugia.org
DISCLAIMER:
The contents of this report do not necessarily reflect the views and policies of the Southeast Asian Fisheries Development Center, the United Nations Environment Programme, and the Global Environment Facility.
For citation purposes this document may be cited as:
SEAFDEC, 2022. Regional Guidelines on Indicators for Sustainable Management of Fisheries Refugia Iin the South China Sea and Gulf of Thailand. Southeast Asian Fisheries Development Center, Training Department, Samutprakarn, Thailand. 36p.
Page 3 of 36
REGIONAL GUIDELINES ON INDICATORS FOR SUSTAINABLE MANAGEMENT OF FISHERIES REFUGIA
THE ORIGIN OF THIS WORK
This paper grew out of a three-day workshop on sustainable management indicators for long term Fisheries Refugia approaches by small expert groups from six Southeast Asian Countries, members of the GEF/UNEP/SEAFDEC project on “Establishment and Operations of a Regional System of Fisheries Refugia in the South China Sea and the Gulf of Thailand” initiated from 2016 to 2022.
The workshop was held at A-One The Royal Cruise Hotel, Pattaya City, Chonburi Province, Thailand, from 9-11 September 2019. The participants, identified here by their institution, were:
• Ouk Vibol, Department of Fisheries Conservation, Fisheries Administration, Cambodia
• Leng Sy Vann, Department of Fisheries Conservation, Fisheries Administration, Cambodia
• Joni Haryadi, Agency for Marine and Fisheries Research and Human Resources, Ministry of Marine Affairs and Fisheries, Indonesia
• Ir. Ngurah N. Wiadnyana, Agency for Marine and Fisheries Research and Human Resources, Ministry of Marine Affairs and Fisheries, Indonesia
• Haryati binti Abdul Wahab, Resource Management Division, Department of Fisheries, Malaysia
• Ryon Siow, Fisheries Research Institute, Malaysia
• Joeren S. Yleana, Bureau of Fisheries and Aquatic Resources, Philippines
• Valeriano M. Borja, National Fisheries Research and Development Institute, Philippines
• Nguyen Thanh Binh, Directorate of Fisheries, Viet Nam
• Nguyen Van Minh, Directorate of Fisheries, Viet Nam
• Praulai Nootmorn, Department of Fisheries, Thailand
• Kumpon Loychuen, Department of Fisheries, Thailand
• Weerasak Yingyuad, Southeast Asian Fisheries Development Center, Thailand
• Somboon Siriraksophon, Project Director
The workshop was a brainstorming session moderated by Fisheries Consultant Somboon Siriraksophon, as a Project Manager employed by the Project. Inputs were also based on individuals and six countries responsible for fisheries, namely Cambodia, Indonesia, Malaysia, Philippines, Thailand, and Viet Nam. The questions came to our minds on how the Refugia approach subsidizes the sustainable development in fisheries. Nevertheless, what kinds of information and indicators we would need to guide ourselves toward a sustainable world in the context of the fisheries refugia approach.
This paper also considers the progress works of all regional experts from six participating countries on the establishment of fisheries refugia. The challenges, issues, and achievements facing each country are the essential lessons learned and information for coloring the paper.
Page 4 of 36
ACRONYMS
ASEAN Association of Southeast Asian Nations CBD Convention of Biological Diversity
CCRF Code of Conduct for Responsible Fisheries CRM Coastal Resource Management
EA Ecosystem Approach
EEZ Exclusive Economic Zone
FAO Food and Agriculture Organization GEF Global Environment Facility
ICZM Integrated Coastal Zone Management
IUCN International Union for Conservation of Nature and Natural Resources IUU Illegal, Unreported, and Unregulated fisheries
MPI Multidimensional Poverty Index MSP Marine Spatial Planning
MTL Mean Trophic Level OEA Open Access Equilibrium PPR Primary Production Requires PSR Pressure-State-Response
SEAFDEC Southeast Asian Fisheries Development Center
UN United Nations
UNCLOS United Nations Convention of the Law of the Sea UNEP United Nations Environment Programme
WCS World Conservation Strategy
Page 5 of 36
TABLE OF CONTENTS
CHAPTER 1: INTRODUCTION ... 6
1.1 IMPORTANCEOFINDICATORS ... 6
1.2 SUSTAINABLEDEVELOPMENTCONCEPTANDFISHERIESSUSTAINABILITY ... 6
1.3 INDICATORSFORFISHERIESSUSTAINABILITY ... 8
CHAPTER 2: UNDERSTANDING FISHERIES REFUGIA CONCEPT ... 9
2.1 NATUREOFFISHERIESANDADAPTIVEMANAGEMENTNEEDS ... 9
2.2 COMPARISONWITHOTHERECOSYTEMAPPROACHES ... 9
2.3 FISHERIESREFUGIACONCEPT ... 10
CHAPTER 3: INDICATORS FOR MANAGING FISHERIES REFUGIA ... 13
3.1. LONG-TERMOBJECTIVES ... 13
3.2. DEVELOPINGTHEFRAMEWORK ... 13
3.3 SPECIFYINGCRITERIAANDINDICATORS ... 15
CHAPTER 4: GLOSSARY ... 31
ACKNOWLEDGEMENT ... 33
REFERENCES ... 34
Page 6 of 36
CHAPTER 1: INTRODUCTION
1.1 IMPORTANCE OF INDICATORS
If we could first know where we are, and whether we are tending, we could better judge what to do, and how to do it. (Abraham Lincoln, speech to the Illinois Republican state convention, June 16, 1858).
Intuitively, we all use indicators to monitor the complex systems we care about or need to control.
Indicators are part of everyone’s life. Indicators are also a necessary part of the stream of information we use to understand things, make decisions, and plan our actions. For example, fishers scan the sky for weather sea condition fronts before deciding to leave port for fishing. We have many words for indicator - sign, symptom, signal, tip, clue, grade, rank, data, pointer, dial, warning light, instrument, measurement, a reference point.
The Convention of Biological Diversity (CBD) adopted the concept to understanding trophic interactions and how fisheries affect, using the mean trophic level (MTL) and primary production required (PPR) as among the indicators for the management of sustainable fisheries exploitation (Hornborg. el.al., 2013).
In terms of the environmental health indicators, which aim to give people the idea of whether their environment is getting better or worse, an overview of six analytical frameworks or models was defined by Julie et al., 2004. They described the scientific aspects of indicator establishment by including frameworks and criteria that apply to establishing a core indicator list for environmental health in Fander, Nothern Belgium.
In fisheries aspects, FAO (1999) stated that indicators aim to enhance communication, transparency, effectiveness, and accountability in natural resource management. Indicators assist in the process of assessing the performance of fisheries policies and management at global, regional, national, and sub-national levels. They provide a readily understood tool for describing the state of fisheries resources and fisheries activity and for assessing trends regarding sustainable development objectives. In measuring progress towards sustainable development, a set of indicators should also stimulate action to achieve sustainable development.
1.2 SUSTAINABLE DEVELOPMENT CONCEPT AND FISHERIES SUSTAINABILITY
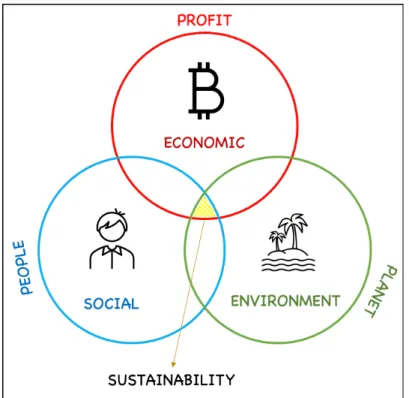
The concept of sustainable development has emerged as a key guiding principle and action agenda for all forms of environmental management, economic development, and social justice at international, regional, national, sub-national, and local levels. The ‘triple bottom line’ of sustainability concept (Elkinton, 1997) has revolutionized the way we see and interact with the world and each other, as shown in Figure 1. It attempts to set a course for an increasingly innovative future based on conservation and protection, wise resource use, social equity, economic growth, and stability. The concept emerged in the late 1980s with groundbreaking international reports such as Our Common Future and the early 1990s with the UN Declaration on Environment and Development negotiation and its product: Agenda 21 (UN, 1993). Sustainability implies that all socio-economic (human-based) systems and ecological (natural-based) systems should remain in a healthy and viable state so that benefits can flow to current and future generations. This includes the orientation of development activities within the carrying capacity of the natural environment to ensure ongoing resource availability and environmental services. Management for sustainability should, therefore, consider integrated approaches, ecosystem scales, and socio-economic considerations. Initially, ideas of sustainability were promoted when the effects of environmental degradation became increasingly visible across the globe. Poverty, population pressure, unequal resource distribution, and trade were the base causes of environmental degradation in developing countries, which required a new development approach to create sustainable economies.
Page 7 of 36
Sustainable development was also viewed as entirely relevant to the developed nations, with the concept highlighting integrated aspects of conservation and economic growth, technology and information transfer, energy, food supply, security, transport, and pollution control.
Figure 1: Triple Bottom Line of Sustainable Development Concept
For development to be sustainable, it must take account of social and ecological factors, as well as economic ones, of the living and non-living resource base, and the long term as well as short-term advantages and disadvantages of alternative actions (World Conservation Strategy (WCS)(IUCN 1980).
The concept of sustainability has dramatically altered the fisheries sector. Over the last century, activities have intensified from a local scale to a global market industry that employs millions and is a source of income and food for many nations. After modernization and industrialization of the fisheries sector, distant water fleets have been able to circumnavigate the globe in sourcing fisheries stocks, often with severe consequences for offshore species or conflicts with localized and community-based fisheries.
In addition, with increasing coastal state control and rights over living marine resources after the signing of the United Nations Convention of the Law of the Sea in 1982, the capacity of fishing effort for domestic- based fisheries has dramatically increased in national EEZs, leading to further pressures on the stocks. As a result, marine living resources are under stress, with many showing signs of degradation and collapse due to overcapacity and destructive fishing practices. Current statistics display that the global capacity of the ocean to produce wild harvests is at its maximum sustainable limit. In addition, the broader ecosystems have been detrimentally affected, especially species associated with or dependent on target stocks. Bycatch and habitat degradation remain two crucial issues for modern fisheries management. The increased impact of Illegal, Unreported, and Unregulated fisheries (IUU) further stresses the global supply and the viability of marine ecosystems. Agenda 21, Chapter 17, provides important challenges and opportunities for nation states in the implementation of policies related to ocean and coastal management. The policy has oriented the concept at a strategic level but requires applying sustainability concerns at an operational level. The current challenge for the fisheries sector is to interpret and practically apply the concept of sustainability into fisheries practice. In other words, developing sustainability indicators in fisheries contexts are urgently needed, as a valuable and practical process, to incorporate ecosystem management and precautionary concerns into fisheries management operations.
Page 8 of 36 1.3 INDICATORS FOR FISHERIES SUSTAINABILITY
Indicators have increasingly been seen as a valuable tool for ‘building in’ sustainability in various sectors, with efforts to pursue this process with fisheries (FAO, 1999). Indicators fulfill multiple roles in fisheries systems and can be adapted to a particular use or set of users, including public education, performance assessment, meeting legislative and policy goals, broadening the management base, increasing participation and coordination, management certification, and environmental protection reporting. The FAO guidelines on indicators for sustainable development of marine capture fisheries were drafted in 1999. Later it was adopted by their member countries in the same year to support the implementation of the Code of Conduct for Responsible Fisheries (CCRF). The guidelines provide general information on the sustainable development of fisheries to clarify why a system of indicators is needed to monitor the contribution of fisheries to sustainable development. The guidelines also provide information on the type of indicators and related reference points required. However, it is recognized that it is difficult to generalize. There is a need to agree on common conventions for joint reporting at the national, regional, and global levels, particularly international fisheries, or transboundary resources.
In Southeast Asia, fisheries development has been confronted with various concerns, notably over-exploitation of the limited resources, which results in the degradation of the fishery resources.
Moreover, excessive fishing capacity, use of irresponsible fishing practices, conflicts among the various stakeholders, and lack of an appropriate regulatory system for fisheries are the multiple factors that contribute to the deterioration of the fishery resources. To address such concerns, the governments of the countries in the region have been promoting sustainable fisheries resources management over the past three decades. The global Code of Conduct for Responsible Fisheries (CCRF) developed by FAO as well as by the Resolution and Plan of Action on Sustainable Fisheries for Food Security for the ASEAN Region adopted during the ASEAN- SEAFDEC Millennium Conference on “Fish for the People” in November 2001 has been used as frameworks in the Southeast Asian countries’ efforts towards sustainable fisheries management. In addition, in collaboration with the ASEAN member states, the Southeast Asian Fisheries Development Center (SEAFDEC) published in 2003 the Regionalization of the Code of Conduct for Responsible Fisheries (RCCRF) in Southeast Asia. Later in 2006, the Supplementary Guidelines on Co- management Using Group User Rights, Fishery Statistics, Indicators and Fisheries Refugia was published mainly to substantiate the afore-mentioned Regional Guidelines. The supplementary guidelines on the Use of Indicators for Sustainable Development and Management of Capture Fisheries in Southeast Asia were achieved through consultations and after several pilot-testing activities in selected countries in the ASEAN region. Considering that the Guidelines specify the need to develop the National System to Use Indicators for marine capture fisheries management, ASEAN Member States strongly requested to systematically establish the most critical and proper fisheries indicators and standards for fostering sustainable fisheries management in the respective country.
Page 9 of 36
CHAPTER 2: UNDERSTANDING FISHERIES REFUGIA CONCEPT
2.1 NATURE OF FISHERIES AND ADAPTIVE MANAGEMENT NEEDS
Considering the nature of fisheries in the region, which is mainly characterized as tropical small- scale multi-species/multi-gear fisheries, the use of indicators for fisheries management in an adaptive manner is seen to be more practical and easily understood and supported by the stakeholders. Adaptive management is a paradigm shift from a predictive approach to an adaptive strategy. Under a broad co- management concept, adaptive management is an approach where fishery managers react on indicators to assess fisheries, resources, and eco-system instead of classical stock assessment (e.g., MSY and MEY).
Adaptive management is a process to achieve management objectives and a learning process among interested stakeholders about fisheries or systems being managed to adopt policies and management frameworks to be more responsive to future conditions. The backbone of an excellent adaptive fisheries management system lies in a good data and information system in which we apply to the sustainable management of fisheries refugia approach.
2.2 COMPARISON WITH OTHER ECOSYTEM APPROACHES
The concept of fisheries refugia has been developed by the Fisheries Component of the UNEP/GEF Project Entitled “Reversing Environmental Degradation Trends in the South China Sea and the Gulf of Thailand” (UNEP/GEF SCS Project) in collaboration with the SEAFDEC for the development of a regional system of fisheries refugia. The Fisheries Refugia approach is based on the “ecosystem approach (EA)”
concept like many existing approaches such as Marine Spatial Planning (MSP), Coastal Resource Management (CRM), Co-management, and Integrated Coastal Zone Management (ICZM). Fisheries refugia are developed in parallel by different user groups with specific management interests. Fisheries refugia share many of the same principles and have many commonalities with other approaches, but management focus or coverage can be different and support each other. In practice, fisheries refugia can incorporate conventional fisheries management and overlaps with co-management, MSP, and ICZM, as shown in Figure 2.
Figure 2: Fisheries Refugia and Other Existing Approaches for Sustainable Development
Page 10 of 36 2.3 FISHERIES REFUGIA CONCEPT
Fisheries Refugia (Paterson et al., 2012) was developed as a novel fisheries resource management approach to the identification and designation of priority areas in which to integrate fisheries and habitat management in the context of maintaining fish stock and critical habitats as satisfying the fishing community, social needs now and futures. The fisheries refugia approach needs a good platform for building partnerships, enhancing communication and engagement of stakeholders, finding local and scientific-based knowledge, and putting in place an effective integration of fisheries and habitat management. In some cases, the management of fisheries refugia may include the transboundary fish stock or shared stocks issues in which cooperation among relevant states is needed to take into accounts.
In the South China Sea and the Gulf of Thailand Sub-regions, against the general background of uncertainty and complexity associated with the development of fisheries refugia, there is a need to develop robust and workable solutions to involve stakeholders in establishing and managing refugia. An emerging appreciation of the diverse traditions and cultures in the region and the vital role of small-scale, coastal, and subsistence fisheries has recently provided an impetus for the development of fisheries refugia approaches to stakeholder participation in the management of fisheries at all levels.
The concept supports the Regional Guidelines for Responsible Fisheries in Southeast Asia with emphasis on item 7.6.4 ADD. 1 on Responsible Fishing (SEAFDEC, 2003), which states that in terms of taking appropriate action to ensure that fishing gear, methods, and practices that are not consistent with responsible fishing are phased out and replaced with more acceptable alternatives: “States should consider area or seasonal closure to protect critical stages of the life cycle of fisheries resources.” In addition, the concept also builds upon item 7.6.9 of the Regional Guidelines on Wastes, Discards, and Ghost Fishing, which states that in terms of taking appropriate action to minimize waste, discards, catch by lost or abandoned gear, catch of non-target species, both fish and non-fish species, and negative impacts on associated or dependent species, in particular, endangered species: “States should strongly implement management measures such as closed areas and seasons in critical habitats (e.g., coral reefs, seagrass beds, mangrove areas, etc.) which are important for sustaining fish stocks.”
The concept of natural refugia is well developed in the fields of terrestrial ecology and wildlife management. For instance, spatial controls that recognize the potential “source-sink” nature of hunted systems and protect natural refugia often effectively avoid wildlife over-exploitation when biological data and enforcement capabilities to regulate harvests are limited. In the context of fisheries, natural refugia arise from the interaction of the spatial dynamics of the population, oceanographic features, fish behavior, and fishing effort dynamics. The fisheries refugia approach can complement conventional fisheries management measures, such as effort or gear restrictions. It should be a priority consideration in the ASEAN region when fisheries are subject to intense and unmanageable fishing pressure. They may also be used to separate potentially conflicting uses of coastal and marine habitats and their limited resources. However, the effectiveness of fisheries refugia will largely depend on the selection and appropriate use of fisheries management measures within the refugia area, and at the most general level, the process of establishing fisheries refugia must consider the:
• Life-cycle of the species for which refugia are being developed,
• Type(s) of refugia scenarios(s) that relate to the species for which refugia are being developed,
• Location of natural refugia and appropriate sites for the establishment of [artificial] refugia, and
• National and regional level competencies in using fisheries management measures and spatial approaches to resource management and planning.
Fisheries Refugia in the ASEAN context is defined as: “Spatially and geographically defined, marine or coastal areas in which specific management measures are applied to sustain important species [fisheries resources] during critical stages of their life cycle, for their sustainable use.” There is a general commonality of understanding that fisheries refugia relate to specific areas of significance to the life-cycle of particular species. Fisheries refugia may be defined in space and time and protect spawning
Page 11 of 36
aggregations, nursery grounds, and migratory routes. Figure 3A shows a generalized life-history triangle for fished species, highlighting the problems of growth and recruitment overfishing, which are reflexed the requirements to protect juvenile and spawning refugia.
Figure 3A: Life-history triangle highlighting the need for refugia to protect the recruitment Therefore, the promotion and use of the fisheries refugia concept in the ASEAN region is aimed at improving the use of spatial approaches to fisheries management for the sustainable use of fisheries.
The specific fisheries management problems in the ASEAN region that fisheries refugia will assist in resolving to include:
• The capture of juveniles – an action focused on reducing the risk of growth over-fishing due to young recruits to the fishery being caught before they grow to optimal market size, or a size at first capture less than that required to maximize yield (or value) per recruit,
• The capture of spawning stock in spawning areas at the time of spawning – an action focused on reducing the risk of recruitment over-fishing due to adult stock being reduced to the extent that recruits are insufficient to maintain commercial fish stocks,
• Use of inappropriate fishing gears and practices,
• Poor management of fish habitats, particularly spawning and nursery areas, and
• Conflicts among resource users – such as those between small-scale and large-scale fisheries.
While recognizing that the overall goal associated with the fisheries refugia approach is to improve the service of spatial approaches to fisheries management for sustainable use of fish stocks and maintenance of habitats, objectives relating to fisheries refugia should be developed with stakeholder engagements. In defining such objectives, ASEAN Member States must consider the objective-related indicators to support evaluating the performance of fisheries refugia. Specific objectives may be drawn from the following [non-exhaustive] list and should be defined in terms of temporal and spatial scales:
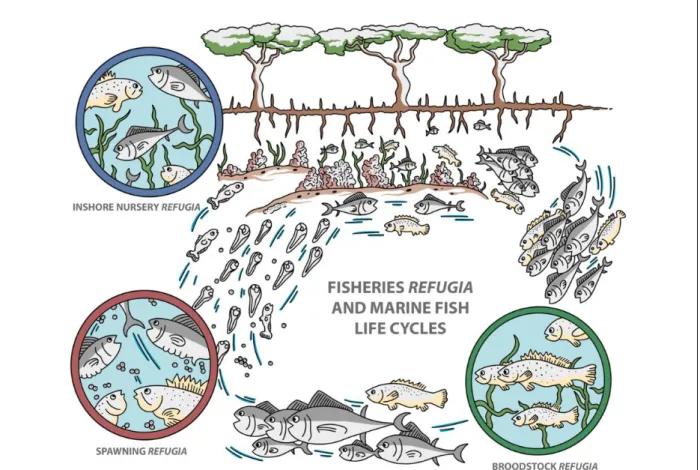
• Safeguarding of spawning and nursery areas and commercial species within these areas at critical stages of their life cycles (Figure 3B),
• Enhancement of fisheries resources and their habitats,
Page 12 of 36
• Prevention of habitat degradation and commercial extinction of important fishery species,
• Improved coordination between fisheries and environmental agencies and organizations,
• Enhanced use of zoning in fisheries management,
• Improved incorporation of species-specific life-history characteristics in fisheries management systems,
• Improved understanding amongst stakeholders, including fisherfolk, scientists, policymakers, and fisheries managers of ecosystem and fishery linkages, and
• Promotion of the role of refugia in enhancing the resilience of fisheries systems.
Figure 3B: Types of fisheries refugia in relation to the generalized life cycle of demersal marine fishes (Pernetta et al., 2010)
Page 13 of 36
CHAPTER 3: INDICATORS FOR MANAGING FISHERIES REFUGIA
3.1. LONG-TERM OBJECTIVES
From the brainstorming among regional experts in September 2019, the objectives for management of fisheries refugia should reflect on healthy and sustainability aligned with the Triple Bottom Line of Sustainable Development Concept. The long-term objectives for development of the indicators for management of fisheries refugia are to:
a) Maintain the fish stock and critical habitats: The successful maintaining or enhancing of fish stocks requires harvest controls but also demands attention to human impacts on the habitat.
Reducing exploitation alone on the stock being restored will not be effective if critical habitat has disappeared.
b) Satisfy fishing community, social needs now, and futures: Taking the time and effort to understand your community well before embarking on a community effort will pay off in the long term. A good way to accomplish that is to create a community description -- a record of your exploration and findings. It's a good way to gain a comprehensive overview of the community -- what it is now, what it's been in the past, and what it could be in the future.
c) Put in place an effective management system: Available evidence suggests that the regions without assessments of abundance have little fisheries management, and stocks are in poor shape. Increased application of area-appropriate fisheries science recommendations and management tools are therefore needed for sustaining fisheries in places where they are lacking.
3.2. DEVELOPING THE FRAMEWORK
Indicators play an essential part in the communication of scientific results to decision-makers.
Many countries develop indicators to support effective decision-making and policy-setting at every stage of the decision-making cycle - during problem identification, policy formulation, implementation, or policy evaluation. In developed countries, many fisheries are assessed and evaluated using models of growing complexity that require data. Model results are often very complex, and their presentation may vary significantly between models. Comparing with many developing countries, because the costs of data collection and analysis for these models may be relatively high, it is not feasible to collect all the information required, and a set of indicators can simplify the evaluation and reporting process. Hence, the finding indicators need to be presented simply and understandably.
Rapport and Friend (1979) indicated the good indicators could be oriented to reflect better the pressures of human activities, the state of human and natural systems, and society's responses to the changes in those systems as called a pressure-state-response (PSR). The PSR model highlights these cause- effect relationships and helps decision-makers, and the public see environmental, economic, and other issues as interconnected. In this guideline, developing the indicators for sustainable management of fisheries refugia considers a structural framework representing all the relevant dimensions of sustainable development, e.g., economic, social, environmental (ecosystem/resource), and institutional/governance.
As noted above, the SCS is a global hotspot of marine biodiversity subjected to high and increasing levels of small-scale fishing pressure and other threats. Various fisheries management reforms are required to fashion a sustainable future for the fisheries of this marine basin. As such, it is important that the refugia initiative is not viewed as a proposed ‘panacea’ to the fisheries problems of Southeast Asia, rather one of a series of complementary management strategies being promoted regionally, including efforts to curb the high and increasing levels of fishing pressure. However, given the high rates of habitat loss and the high levels of community dependence on small-scale fisheries, it is imperative that efforts to
Page 14 of 36
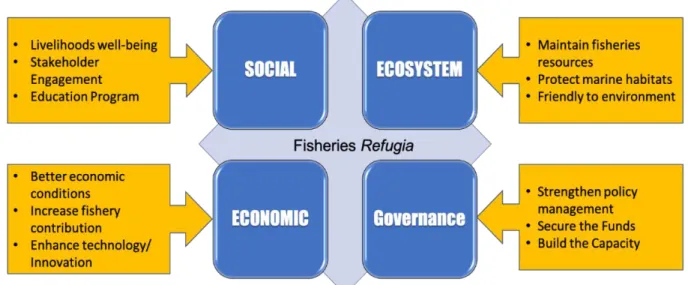
operate the regional fisheries refugia system be sustained. Accordingly, the regional experts defined a structural framework for enhancing the effective sustainable management of fisheries refugia into twelve targets under four dimensions as shown in Figure 4.
Figure 4: Structural framework for enhancing the effective sustainable management of fisheries refugia a) Ecosystem Dimension: Managing a complex ecosystem to balance delivery of all its services is
at the heart of ecosystem-based management. But how can this balance be accomplished amidst the conflicting demands of stakeholders, managers, and policy makers? In marine ecosystems, several common ecological mechanisms link biodiversity to ecosystem functioning and to a complex of essential services. As a result, the effects of preserving diversity can be broadly beneficial to a wide spectrum of important ecosystem processes and services, including fisheries, water quality, and recreation. In this guideline, we defined the ecosystem into three sub- dimensions: 1) fisheries resources, 2) marine habitats, and 3) marine environment. To maintain the ecosystem health, we need to maintain fisheries resources, protect the marine habitats and friendly to the marine environment.
b) Governance Dimension: Good governance is fundamental to ensuring the equitable and sustainable management of fisheries and to facilitate policy change. To improve fisheries governance, further analysis of institutional arrangement of fisheries governance is needed to better understand how different structures impact policymaking. In particular, it would be interesting to investigate how institutions can facilitate increased co-ordination and coherence between policies for all the sectors using marine resources. For effective policy creation, change, and implementation, countries require a governance process that integrates information on the impacts of existing policies and the views of a wide range of stakeholders collected by institutions that can respond to the specific context of individual fisheries (Delpeuch et.al., 2019). The main objectives of this dimension are strengthening governance and institution capacity as well as strengthening the policy management and securing the fund for sustainability in managing fisheries refugia.
c) Economic Dimension: The capture fisheries have played an important role to national economies among ASEAN countries, particularly as a source of foreign exchange earnings, an employment creator and income generator, as well as in food and nutrition security. It was also recognized that the region’s contribution to global fishery production has gradually increased from 5% in 1950 to 21.1% in 2014 (FishStatJ, 2016). Considering the economic sustainability refers to practices that support long-term economic growth without negatively impacting social, environmental, and cultural aspects of the community. It can refer either to the continued success of an economy over time or more recently to the way an economy operates in a sustainable
Page 15 of 36
manner, protecting social and environmental elements. How can we know the economic sustainability? The guideline defined economic dimension into three sub-dimensions that we need to know as follows: 1) economic health/condition, 2) economic/fisheries production, and 3) driving innovation and transforming fisheries.
d) Social Dimension: Social or humans and its relation to the marine ecosystem are at the core of the fisheries refugia approach and a “human dimension” for this approach needs to be understood, analyzed, identified, and implemented. Implementation of ecosystem approach like fisheries refugia without consideration of socio-cultural, economic, political and institutional dimensions is nowadays regarded as incomplete, delivering only partial and insufficient achievements that the approach aims to generate. In addition, failure to consider human dimensions risks producing or reinforcing social inequalities with marginal groups, enhance conflicts and distrust hindering collaboration, ignoring local values, knowledge and skills essential for particular contexts, striping customary social norms, fostering unemployment, depriving individual and collective identities, altering socio-cultural relations and social capital; all of them critical for human well-being and the associated exploited marine ecosystems. We defined three sub-dimensions, to ensure and assess the wellbeing of fishing communities as follows: 1) livelihood conditions, 2) stakeholder engagements, and 3) educational programs.
Climate change impacts and gender mainstreaming aspects are considered as key cross-cutting dimensions that we include in the frameworks particularly the later one we align with the SEAFDEC Gender Strategy (SEAFDEC, 2019) and GEF Policy Guidance on Gender Equality (GEF, 2017). Nevertheless, the focus of climate change impacts is to ecosystem only, not covering the impacts to other social, economic, and governance dimensions.
3.3 SPECIFYING CRITERIA AND INDICATORS
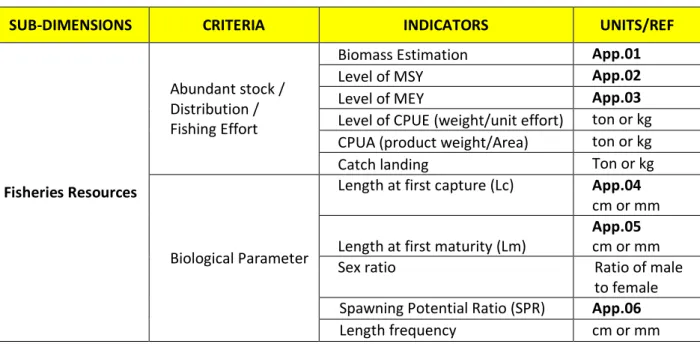
At the fishery level, indicators provide an operational tool in fisheries management as a bridge between objectives and management action. For example, an indicator such as an estimate of current biomass from a stock assessment model may feed into a decision rule that specifies next year’s management measures or other input-output controls. Indicators may also be used to trigger a more general management response, such as achievement with respect to a more integrated coastal management plan. Based on the defined fisheries refugia structural frameworks (see Annex 1), the criteria and indicators are specified as shown in Table 1-5.
Table 1: Specified criteria and Indicators of the Ecosystem Dimensions for fisheries refugia approach
SUB-DIMENSIONS CRITERIA INDICATORS UNITS/REF
Fisheries Resources
Abundant stock / Distribution / Fishing Effort
Biomass Estimation App.01
Level of MSY App.02
Level of MEY App.03
Level of CPUE (weight/unit effort) ton or kg CPUA (product weight/Area) ton or kg
Catch landing Ton or kg
Biological Parameter
Length at first capture (Lc) App.04 cm or mm Length at first maturity (Lm)
App.05 cm or mm
Sex ratio Ratio of male
to female Spawning Potential Ratio (SPR) App.06
Length frequency cm or mm
Page 16 of 36
SUB-DIMENSIONS CRITERIA INDICATORS UNITS/REF
Exploitation rate App.07
GSI (Gonadosomatic Index) App.08
Species composition / Catch structure
Percentage of dominance species %
Number of species Individual(s).
Main economic/commercial species
%
Bycatch Composition %
Habitat (mangrove, coral, seagrass, and
other critical habitats)
Health/condition/
Area
Size Coverage %
Habitat Health Index App.09 Target habitat density (IUCN
reference)
App.10
Environment
Pollution Standard Water Quality (e.g.
COD, BOD)
App.11
Eutrophication Phytoplankton Abundance
App.12 (monitoring) Phosphate, Nitrate
Concentration (Nutrient loading)
App.13 (monitoring) Anthropogenic
(Human activity)
Coastal reclamation area hectare or Km2 Level of maritime activity (If
appropriated)
N/A
Erosion
Level and distribution of sedimentation (If appropriated)
N/A
Loss of area/habitat hectare or Km2
Table 2: Specified criteria and Indicators of the Social Dimensions for fisheries refugia approach
SUB-DIMENSIONS CRITERIA INDICATORS UNITS/REF
Livelihoods
Choice of Occupation
Number of option/ Occupation/
work (Alternative, Permanent work, Subsistence work)
Number
Fish consumption Fish consumption per capita per year
App.14
Nutrition % Animal protein (if appropriate) %
Stakeholder Participation (Indigenous People,
Gender, etc.)
Participation Ratio of number of participations (gender and IP)
%
Local Organization Number of organizations, Number Number of Best practices applied Number
Networking
Number of networking Number
Type /way of direct or indirect communication
Number
Number of agreements Number
Education (Local knowledge, Local
wisdom)
Awareness program (e.g. information center, information education campaign (IEC))
Number of information center or similar.
Number Number of consultations Number Number of best practices Number Number of awareness program Number Number of understandings by
stakeholder
Number
Page 17 of 36
SUB-DIMENSIONS CRITERIA INDICATORS UNITS/REF
Capacity building Number of training/Extension Number
Table 3: Specified criteria and Indicators of the Economic Dimensions for fisheries refugia approach
SUB-DIMENSIONS CRITERIA INDICATORS UNITS/REF
Economic Condition (to community)
Poverty incidence Poverty Index, Income Poverty Multidimensional poverty index
App.15
Capital accessibility Number of financial accessible Number
Income Income per household income/year
Fisheries Production, Fishing
Efforts
Contribution of target species and Availability
Value of contribution or production
ton(s), metric ton(s)
Innovative Fisheries Technology
Effectiveness of fishing gear
level of CPUE App.16
Cost effectiveness Cost reduction, time, human power
App.17
Environment friendly (Green technology)
Reduce of fuel consumption App.18
Reduce bycatch App.19
Investment
• Number of investments
• fishing fleet,
• processing,
• ship builder
• management tools/software
• Number
• Number
• Number
• Availability
• Availability
New domestic products Number
Table 4: Specified criteria and Indicators of the Governance Dimensions for fisheries refugia approach
SUB-DIMENSIONS CRITERIA INDICATORS UNITS/REF
Fisheries management policy (Fishing/User Right,
Precautionary approaches/Science
-based management, and
Synergistic Way/Strategy)
Legal framework Number of law and regulation In place
Harvest strategy/
Limit of fishing effort
Fishing closure by area and seasonal closure,
Zoning
hectare or Km2 Days/months
Number of Input control (Number, mesh size, length of fishing gear, Licensing control, Capacity (e.g. Gross tonnage, horsepower, etc.)
App.20
Number of output control (TAC, Quota, Target species)
App.21
Fisheries
management plan/
strategy/ framework
Available/not available Management plan of Fisheries refugia in place,
Reformed
Habitat rehabilitation, protection and stock enhancement.
Adopted Efficiency fishing
gear Length limit (e.g. crab fishery)
cm or mm
Page 18 of 36
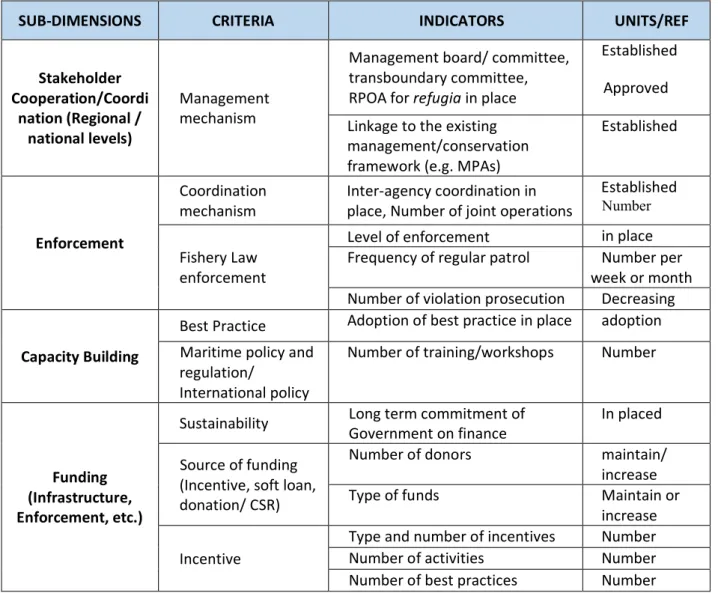
SUB-DIMENSIONS CRITERIA INDICATORS UNITS/REF
Stakeholder Cooperation/Coordi
nation (Regional / national levels)
Management mechanism
Management board/ committee, transboundary committee, RPOA for refugia in place
Established
Approved Linkage to the existing
management/conservation framework (e.g. MPAs)
Established
Enforcement
Coordination mechanism
Inter-agency coordination in place, Number of joint operations
Established Number Fishery Law
enforcement
Level of enforcement in place Frequency of regular patrol Number per
week or month Number of violation prosecution Decreasing
Capacity Building
Best Practice Adoption of best practice in place adoption Maritime policy and
regulation/
International policy
Number of training/workshops Number
Funding (Infrastructure, Enforcement, etc.)
Sustainability Long term commitment of Government on finance
In placed Source of funding
(Incentive, soft loan, donation/ CSR)
Number of donors maintain/
increase
Type of funds Maintain or
increase Incentive
Type and number of incentives Number
Number of activities Number
Number of best practices Number
Table 4: Specified criteria and Indicators of the Cross-cutting (Climate Change) Dimensions for fisheries refugia approach
SUB-DIMENSIONS CRITERIA INDICATORS UNITS/REF
On Fish Stock Impact to Fish Stock
Availability/levels of knowledge abundance, distribution, genetic diversity, recruitment
App.22 Refers to App01-08 Update information impact to
fish stock
Monitoring
Impact to Habitat
Coral bleaching
Area hectare or Km2
Incident/ frequency App.23
Recovery Rate %
Destruction of mangrove
Area coverage hectare or Km2
Recovery Rate %
Destruction of sea grass
Area coverage hectare or Km2
Recovery Rate %
Impact to
Environment Sea level rise
Saline intrusion (if appropriate) App.24 Mean sea level annual (if
appropriate)
App.25
Coastal Erosion (Area) hectare or Km2
Page 19 of 36 Physical/chemical
parameters
Level of physical and chemical parameters (T, Salinity, PH, DO)
App.26
Precipitation (rainfall)
Level of Precipitation (if appropriate)
App.27
Ocean acidification PH level ppt.
App.01 Biomass
Biomass (B) – Weight of an individual or a group of individuals contemporaneous of a stock.
Abundance and biomass estimates are metrics usually taken for phytoplankton assays.
Biomass is a proxy measure today in phytoplankton assays, while relative abundance is broadly used in diatoms investigations and application of ecological indexes.
App.02 Maximum Sustainable Yield (https://www.fao.org/3/y3427e/y3427e07.htm#bm07.3.1) In the 1960s and 1970s, maximum sustainable yield (MSY) was seen as the ideal target to aim for in managing fisheries, and managers attempted to obtain MSY through striving to set the MSY as a target catch level or to determine the fishing mortality rate that would generate MSY (FMSY). The maximum sustainable yield concept is based on a model, referred to as a surplus production or biomass dynamic model (Figure 5), which assumes that the annual net growth in abundance and biomass of a stock increases as the biomass of the stock increases, until a certain biomass is reached at which this net growth, or surplus production, reaches a maximum (the MSY). This biomass is referred to as BMSY, and the fishing mortality rate which will achieve MSY is similarly referred to as FMSY. As the biomass increases above BMSY, density dependent factors such as competition for food and cannibalism on smaller individuals start to reduce the net population growth which therefore decreases until at some point, the average carrying capacity of the stock, net population growth reaches zero.
In reality, an unexploited stock will tend fluctuate about this biomass because of environmental variability.
Figure 5: Schaefer model of surplus production (biomass dynamic) as a function of stock size showing the major reference points. Other forms of surplus production model can have BMSY at a higher or lower stock size than the 50% of B0 of the Schaefer model. MSY = maximum sustainable yield; BMSY = the biomass at which MSY occurs; and B0 = the average unexploited biomass of the stock (the average ‘carrying capacity’).
Page 20 of 36
MSY was such a well-established target for managing fisheries that it is included in the 1982 United Nations Convention on the Law of the Sea (UNCLOS), where it is stated that coastal management agencies should “... maintain or restore populations of harvested species at levels which can produce the maximum sustainable yield, as qualified by relevant environmental and economic factors”.
This requirement of the LOS is equivalent to specifying a limit reference point of BMSY. This is not the same as setting MSY as a target reference point for catch, however, and using MSY as a target reference point has been found to be dangerous. This is because it is impossible to estimate MSY precisely for any stock. If MSY is over-estimated, then a fishery will be allowed to take more than the maximum production of the stock which will cause a reduction in the biomass every year. In a new fishery this could drive the biomass down to the level at which MSY is produced (BMSY) but if continued after that will drive the biomass down further, where annual production gets smaller and smaller, making the situation even worse. Even if average MSY could be precisely determined, the productivity of a stock varies from year to year under the influence of environmental variability. Therefore, if the stock is at BMSY, in some years production may still be less than MSY and, if MSY is taken as the catch, the biomass will be driven below BMSY, possibly driving the stock into a downward spiral. Therefore, MSY is no longer seen as a target reference point for fisheries managers to strive for, although it can still be used as a limit reference point i.e. as an upper limit to the annual catch, which should be avoided.
App.03 Maximum Economic Yield (MEY)
In fisheries terms, maximum sustainable yield (MSY) is the largest average catch that can be captured from a stock under existing environmental conditions. Relating to MSY, the maximum economic yield (MEY) is the level of catch that provides the maximum net economic benefits or profits to society.
Fundamental theory in the science of fisheries economics was presented by a Canadian economist (Gordon, 1954). Later, Schaefer used these ideas to develop a mathematical model in an attempt to establish a relationship between biological growth and fishing activities. This model is known as Gordon-Schaefer model (GSM) and is the basic model of bioeconomic. The maximum capacity of the environment to support the highest fishery stock biomass (B) is referred to as carrying capacity (K). At K, the growth rate of the fishery stock virtually becomes zero. Figure 6 graphically represents total revenue of the fishery with a constant price. In this figure, parabola corresponds to either equilibrium amount of fishing effort or the equilibrium of B. The straight line represents total cash flow when the operating and fixed costs are constant. The slope of this line is equal to the cash flow per fishing effort.
Economic rent is represented by the difference of the cost line and revenue curve. This economic rent is supposed to be derived from the fishery stock. The highest difference between the cost of economic rent is the maximum. The point at which revenue curve is intersected by the coastline is known as the open access equilibrium (OAE).
Page 21 of 36
Figure 6: Total revenue of the fishery with constant price App. 04 Length at First Capture (Lc)
The size of a fish at first capture is the size after the fish has bred for the first time. This size will vary in case of both males & females. This size will not be the same for all the varieties of fish. Hence a fishery biologist will be able to say the size of a variety of fish soon after it has bred. In case fish before first capture is not allowed to breed, it is most likely, that the stocks will dwindle in course of time. They will decline sooner if the life span of fish is small, will take more time if life span is longer, other conditions being the same.
App.05 Length at First Maturity (Lm)
The size of fish at first maturity (Lm50) is the length at which 50% of the fish have reached maturity. In the present study it was noticed that the 50% of observed sexual maturity of male and female fishes were in the matured stage. The large and whitish testis and yellowish orange ovaries are defined as matured
For estimating Lm, different researchers use different methodologies. Some uses the lowest recorded mature fish as Lm. Some researchers estimated it by eye observation of visible egg.
Some estimates from the first peak of GSI. Some uses cumulative percentage of all samples of fully matured egg (Stage v and above) to estimate Lm. But is there any method to calculate Lm based on histological stages (i-vii) and maturity stages i.e., cumulative percentage of samples over certain maturity stages (stages i-vii/viii)
App.06 Spawning Potential Ratio (SPR)
The spawning potential ratio (SPR) of a stock is defined as the proportion of the unfished reproductive potential left at any given level of fishing pressure (Goodyear, 1993; Walters and Martell, 2004) and is commonly used to set target and limit reference points for fisheries. The spawning potential ratio (SPR)—an index developed by marine fisheries scientists to identify and prevent recruitment overfishing—is simply a ratio of the average
Page 22 of 36
lifetime production of mature eggs per recruit in a fished population to what it would have been if the population had never been fished.
App.07 Exploitation Rate
Exploitation rate, applied on a fish stock, is the proportion of the numbers or biomass removed by fishing. If the biomass is 1000 tons and the harvest during a year is 200 tons, the annual exploitation rate is 20%.
App.08 Gonadosomatic Index (GSI)
The gonadosomatic index, abbreviated as GSI, is the calculation of the gonad mass as a proportion of the total body mass. It is represented by the formula:
GSI = [gonad weight / total tissue weight] × 100 App.09 Ocean Health Index
One of the greatest challenges for resource management, including for LMEs, is to understand the condition of human and natural systems within a region and make informed decisions about the best way to improve that condition. Too often, monitoring, assessments, indicator choice, and decisions are made within a single sector or aimed at a single objective, without adequate consideration of the broader implications of proposed actions. Ecosystem-based management and marine spatial planning aim to overcome these management barriers, but there are relatively few tools to inform and support these comprehensive management approaches.
Without a tool to measure overall ecosystem health and track progress towards improving it, one cannot effectively manage towards that objective. Together, the five LME modules capture many of the indicators of a healthy ocean ecosystem, but incompletely and without a transparent and quantitative means to combine the various measures. The Ocean Health Index (OHI) was developed in part to address this need.
Using a common framework, the OHI measures progress towards achievement of ten widely agreed public goals for healthy oceans, including food provision, carbon storage, coastal livelihoods and economies, and biodiversity (Figure 7). Progress towards each goal is assessed against the optimal and sustainable level that can be achieved (Figure 8).
Page 23 of 36
Definitions of the goals and sub-goals of the Ocean Health Index
Figure 8: Ocean Health Index score by LME
App.10 Target Habitat Density (IUCN reference)
The primary goal of the IUCN Red List of Ecosystems (RLE) is to support conservation in resource use and management decisions by identifying ecosystems most at risk of biodiversity loss (Keith et al., 2013). By assessing relative risks of biodiversity loss at the ecosystem level, the RLE accounts for broad scale ecological processes and important dependencies and interactions among species (Keith et al., 2015).
The IUCN Red List of Ecosystems includes eight categories: Collapsed (CO), Critically Endangered (CR), Endangered (EN), Vulnerable (VU), Near Threatened (NT), Least Concern (LC), Data Deficient (DD), and Not Evaluated (NE; Figure 9). The first six categories (CO, CR, EN, VU, NT and LC) are ordered in decreasing risk of collapse. The categories Data Deficient and Not Evaluated do not indicate a level of risk.
The categories Critically Endangered, Endangered and Vulnerable indicate threatened ecosystems and are defined by quantitative and qualitative criteria described in Section 5 and Appendix 2. These categories are nested, so that an ecosystem type meeting a criterion
Page 24 of 36
for Critically Endangered will also meet the criteria for Endangered and Vulnerable. The three threatened ecosystem categories are complemented by several qualitative categories that accommodate: (i) ecosystem types that almost meet the quantitative criteria for Vulnerable (Near Threatened); (ii) ecosystems that unambiguously meet none of the quantitative criteria (Least Concern); (iii) ecosystems for which too few data exist to apply any criterion (Data Deficient); (iv) ecosystems that have not yet been assessed (Not Evaluated). Following the precautionary principle (Precautionary Principal Project, 2005), the overall status of an ecosystem type is the highest risk category obtained through any criterion.
Figure 9: Structure of IUCN Red List of Ecosystem categories
App.11 Standard Water Quality Parameters
Parameters that are frequently sampled or monitored for water quality include temperature, dissolved oxygen, pH, conductivity, ORP, and turbidity. However, water monitoring may also include measuring total algae, ISEs (ammonia, nitrate, chloride), or laboratory parameters such as BOD, titration, or TOC.
App.12 Phytoplankton Composition and Abundance
The phytoplankton is one of the most important communities in aquatic ecosystem, constituting the first step of diverse trophic chain, and being one of the main primary producers in the marine, coastal, and continental water bodies. It provides food for primary consumers from zooplankton, benthos, and nekton communities (Harris 1986; Hernández- Becerril 1993). Accordingly, to Metting (1996) microalgae are primarily responsible for the 40–50% of total global photosynthetic primary production. Another important function of phytoplankton in natural or aquaculture ecosystems is the production of oxygen. It has been demonstrated that a great proportion of oxygen in the atmosphere and the water column come from phytoplankton photosynthesis (Balkanski et al. 1999).
The composition and abundance of phytoplankton vary widely in the diverse aquatic ecosystems, exhibiting sometimes a pronounced seasonal succession, influenced by diverse factors such as temperature and salinity (Muylaert et al. 2000), as well as changes in the concentration and proportion of nutrients, resulting from movements of water masses, upwellings, and continental drains
Page 25 of 36 App.13 Phosphate, Nitrate Concentration (Nutrient loading)
Nitrogen (N) and phosphorus (P) are key nutritional elements for many important life processes such as protein and DNA synthesis, primary production, cellular growth and reproduction. Both have a natural global cycle that includes conversion between different inorganic and organic forms, solid and dissolved (and gaseous for nitrogen) phases that maintained their pre-industrial concentrations within certain natural bounds. During the preindustrial era, the concentrations and fluxes of N and P in rivers were generally small, much less than present day levels, and were mainly sourced from erosion and the leakage of dissolved N and P in their organic/inorganic forms. Today anthropogenic production of N and P to support fertilization and industrial releases has dramatically increased the N and P presence in water bodies. However, in excessive quantities, they may represent a significant source of aquatic pollution. Eutrophication has become a widespread issue rising from a chemical nutrient imbalance and is largely attributed to anthropogenic activities in both inland and coastal waters.
App.14 Fish Consumption Per Capita Per Year
Per capita consumption is the average use of a product, service or other item per person. You can calculate the per capita consumption of a particular food, for example, if you are interested in investing in a commodity. You can calculate per capita consumption as it relates to a country's economic activity, such as Gross Domestic Product. You can make a quick calculation to help you make comparisons by year to see if something you're researching is trending upward or downward.
App.15 Poverty Index/Income Poverty
Literature has been built on the Forster-Greer-Thorbecke (FGT) (1) poverty index to estimate income poverty (2) (Akongyuure et al., 2017). However, the income poverty has several drawbacks that include using income as the lone indicator of measuring the wellbeing of an individual and hence limited since it does not reflect and incorporate the key dimensions of poverty associated with the quality of life. Also, the income poverty approach does not guarantee that households with income at or above the poverty line would use their incomes to purchase the minimum basic needs. This implies that households may be non-poor in terms of income but deprived of basic needs (Kabubo-Mariara et al., 2011). This infers that income poverty is an indirect approach to assess the ability of the household to satisfy basic needs. Therefore, the study focused its analysis on the multidimensional measurement of poverty (3).
1) Forster-Greer-Thorbecke (FGT) poverty index is a poverty measure in a population defined as; yi = z − viz where,
vi = Per capita income of household i,
z = Poverty line; thus, households with income above the poverty line are assigned zero
Yi = Income poverty gap that is a continuous variable ranging between zero and one.
2) Income poverty refers to a failure to satisfy basic needs using per capita income as a threshold.
3) Multidimensional poverty offers an added advantage compared to income poverty since it enables the researcher to directly assess the types of basic needs a household can actually satisfy. Also, the approach allows for decomposability and offers freedom in assigning different weights to different indicators (Kabubo- Mariara et al., 2011). In this sense, multidimensional poverty indicators for
Page 26 of 36
quantitative impact analysis and weighted procedures for the multidimensional poverty index (MPI) were applied. The approach was preferred to factor and cluster analyses because it provides absolute poverty levels and allows for poverty comparison across different settings (Ogutu and Qaim, 2018).
Dimension and indicator
Description and deprivation cutoff
Education
School achievement Deprived if the household head and spouses have not completed the primary level of education
School attendance Deprived if the household has school-aged children not going to school Standard of living
Electricity Deprived if the household has no electricity
Drinking water Deprived if the household does not have access to safe drinking water or they have to walk over 30 min to get safe drinking water
Sanitation Deprived if the household has no descent pit latrine Flooring Deprived if the household house is earth
Assets
Phone Deprived if the household does not own a mobile phone Radio and/or television Deprived if the household does not own at least radio Vehicle Deprived if the household does not own at least a bicycle Health
Nutrition 1 Deprived if the household reports a household dietary diversity score of 6 and below out of the possible 12 food groups
Nutrition 2 Deprived if the household relies on relief food or any case of malnutrition in the past 2 years
Access Deprived if the household has difficulty in meeting basic public hospital bills
Source: Adapted from Ayuya et al. (2015).
App.16 Catch Per Unit Effort (CPUE)
Catch-per-unit effort (CPUE) methods can be used to estimate absolute abundance of closed populations in the presence of successive removals. This estimation is possible because of the proposed relationship between harvest effort and the probability of capture, as well as the observed decline in catch with successive removal events. A minimum of two samples is necessary for abundance estimation and a minimum of three samples for tests of goodness- of-fit. With only a single sample catch of size r, the catch represents, under ideal circumstances, an index to abundance where its expected value is
E(ri). =. Ni x pi where
ri = number of fish caught in the ith population;
Ni = fish abundance in the ith population;
Pi = probability of capture exerted on the ith population
Seasonal and annual CPUE estimates are often used to index abundance and to track the depletion of the fished stock as fishing progresses though the season (see ‘Modelling the Depletion Process’ section). Limitations of CPUE as an index of abundance, however, are well-understood, and they tend to be particularly severe in the case of sedentary organisms.
The assumption is that the number of fish caught per unit of effort expended (often time) is proportional to stock size. However, experience from commercial fisheries shows that CPUE
Page 27 of 36
can remain high in the face of a rapidly declining stock or decline even if the stock is relatively stable (Hilborn and Walters, 1992).
App.17 Cost Effectiveness Analysis
Cost-effectiveness analysis (CEA) is a form of economic analysis that compares the relative costs and outcomes (effects) of different courses of action. Cost-effectiveness analysis is distinct from cost–benefit analysis, which assigns a monetary value to the measure of effect.
The concept of cost-effectiveness is applied to the planning and management of many types of organized activity. The major steps in a cost-benefit analysis
• Step 1: Specify the set of options.
• Step 2: Decide whose costs and benefits count.
• Step 3: Identify the impacts and select measurement indicators.
• Step 4: Predict the impacts over the life of the proposed regulation.
• Step 5: Monetise (place dollar values on) impacts.
App.18 Reduced Fuel Consumption
Compared to a century ago, the world's fishing fleets are larger and more powerful, are traveling further, and are producing higher quality products. These developments come largely at a cost of high-fossil fuel energy inputs. Rising energy prices, climate change, and consumer demand for ‘green’ products have placed energy use and emissions among the sustainability criteria of food production systems. Management decisions, technological improvements and behavioral changes can further reduce fuel consumption in the short term, although the most effective improvement to fisheries energy performance will come as a result of rebuilding stocks where they are depressed and reducing over-capacity.
App.19 Reduced Bycatch
Fishers, fishing gear designers and manufacturers, researchers and government and non- government organizations needs to work together to the development of solutions for reducing bycatch.
Fishers (commercial, recreational and Indigenous) bring an understanding of how to efficiently catch their target species, how their gear works and what is practical and safe at sea. Fishers in high latitudes often design fishing gear and practices to reduce bycatch as it is in their interests to avoid catching non-target species. They also bring their observations and records of when and where they have caught bycatch.
Fishing gear designers and manufacturers contribute by using their knowledge of how their gear works and the different materials that can be used. They can modify gear or design innovations to ensure the gear still catches the target species but not the bycatch. For example, changes to hook shape or net design can reduce bycatch.
A good example of gear innovations is the incorporation of Turtle Excluder Devices (TEDs) into net designs used in tropical prawn trawl fisheries. TEDs allow prawns to enter a net yet prevent large marine animals like turtles from being captured. The device has proven to be highly successful in many fisheries around the world.
App.20 Input Controls or Fishing Effort Management
As defined above, input controls are restrictions put on the intensity of use of gear that fishers use to catch fish. Most commonly these refer to restrictions on the number and size of fishing vessels (fishing capacity controls), the amount of time fishing vessels are allowed
Page 28 of 36
to fish (vessel usage controls) or the product of capacity and usage (fishing effort controls).
Often fishing effort is a useful measure of the ability of a fleet to catch a given proportion of the fish stock each year. When fishing effort increases, all else being equal, we would expect the proportion of fish caught to increase.
For some fisheries, vessels may deploy a variable amount of fishing gear. In these cases the definition of fishing effort would also need to contain a factor relating to gear usage per vessel. In principle, input controls might also refer to limits placed upon other vital supplies of fishing such as the amount of fuel use allowed (energy conservation is desirable, see Paragraphs 8.6.1 and 8.6.2 in the Code of Conduct) but the commonest form of input controls are those put on the various components of fishing effort. In simpler less mechanized fisheries input controls might relate to the