การวิเคราะห์เชิงพื้นที่ของอาชญากรรมในสามจังหวัดชายแดนภาคใต้ของประเทศไทย: ความหนาแน่น ปัจจัย และการเข้าถึง พงศกร ศรีณรงค์ คณะภูมิสารสนเทศ มหาวิทยาลัยบูรพา ลิขสิทธิ์เป็นของมหาวิทยาลัยบูรพา การวิเคราะห์เชิงพื้นที่ของอาชญากรรมใน 3 จังหวัดภาคใต้: ฮอตสปอต ปัจจัยและการเข้าถึง พงศกร ศรีณรงค์ : การวิเคราะห์เชิงพื้นที่ของอาชญากรรมใน 3 จังหวัดภาคใต้: ฮอตสปอต ปัจจัย และการเข้าถึง ประเทศไทยเผชิญกับปัญหาอาชญากรรมและความไม่เป็นระเบียบในสามจังหวัดชายแดนภาคใต้ ปัตตานี ,ยะลี และนราธิวาส ตั้งแต่ พ.ศ. 2547 จนถึงปัจจุบัน
The aim was to explain the criminal cases in three southern border provinces and to find out the patterns of criminal behavior in terms of shooting, bombing, drugs, physical assault and arson. Then the correlation coefficient and regression analyzes were used to find out the relationship between different factors and effects on crime incidents in the southern border of Three. Overall, the fewest criminal incidents and disorder were found in Yala province compared to Pattani and Narathiwat provinces.
The results of this study can be used as guidelines for crime prevention or reduction and are useful for police officers in crime prevention planning in the three southern border provinces.
INTRODUCTION
- Statements and significance of the problems
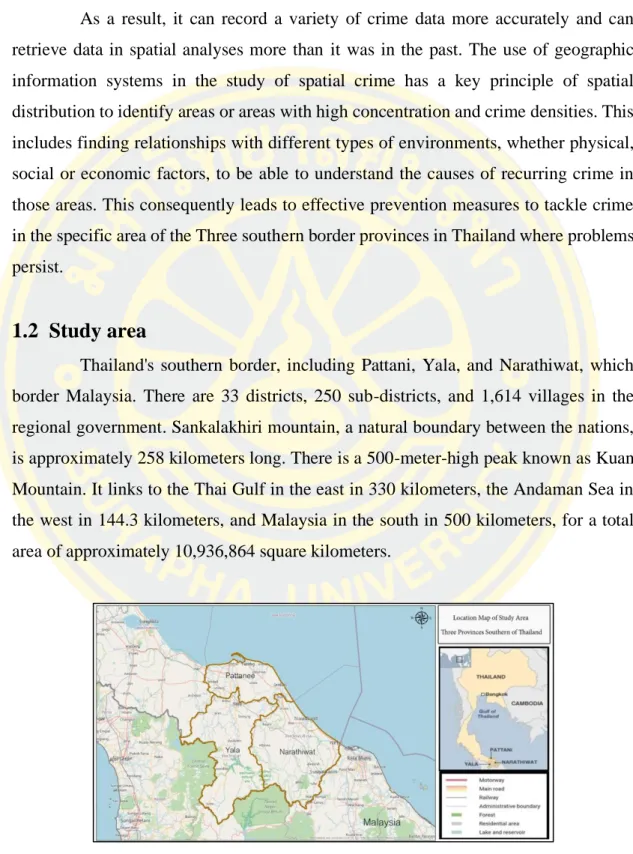
- Study area
- Research questions
- Objectives
- Scope of study
- Thesis structure
Therefore, effective crime prevention is beneficial in reducing social and budget loss and in increasing the quality of life of people in societies. Due to the importance of the criminal problem, various techniques for preventing, resolving and reducing violence from various aspects of criminal acts in the areas are being studied. As a result, it can record various crime data more accurately and obtain data in spatial analyzes more than in the past.
The use of geographic information systems in the study of spatial crime has a key principle of spatial distribution to identify areas or areas of high concentration and crime densities. This consequently leads to effective prevention measures to tackle crime in the specific area of the Three Southern Border Provinces in Thailand where problems persist. As a crime occurs, there will be a point or position of a specific criminal scene, the data obtained can inform the repetition and density of the cases in the studied area.
So the crime theory, The influence of geographical environment on crime, crime mapping, spatial statistics in the study of crime and the Two-step floating catchment method.
LITERATURE REVIEW
- Geographic information systems
- The application of Geo-information technology for crime field
- The ecological theory of criminology
- Influence of the geographic environment on crime
- Research and study on crime and the environment
- Crime Mapping
- Crime Mapping can be divided into 5 types
- Functions of the Crime Mapping
- Crime mapping can be used for 6 main purposes as follows
- Spatial statistics
- Hot Spot
- Research review
On the other hand, Lander is studying the same topic in Baltimore, Maryland, and found the correlation between the physical structure of the area and the number of cases. It is an opportunity for the crime analysts to represent different values of the same variables on the same maps. Crime mapping for police operation: Crime mapping is used to establish levels of responsibility for the planning officers and for decision making by the commanders.
In addition to arresting suspects and controlling disturbances in the responsible parts of police stations, the patrol is one of the main police tasks. In such an analysis, data on the crime situation was taken into account and displayed in a dot map. In the analysis of high-density or crime-risk areas, the clustering and dispersion metric was used to measure the dispersion of the point data, and the results of the analysis were interpreted in terms of the density of crime points in the enclosed area.
Therefore, the understanding of the hot spot is one of the risk zones involved in the impact.
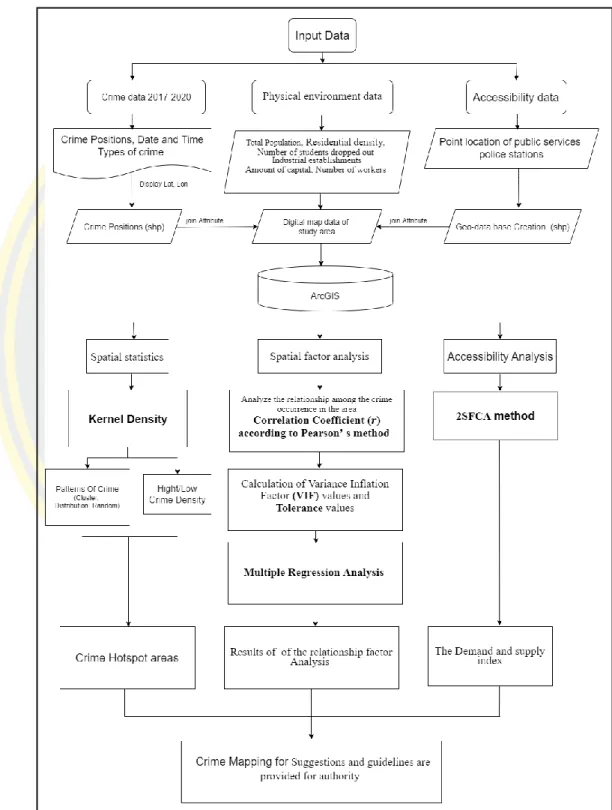
MATERIALS AND METHODS
- Type of research
- Data collection
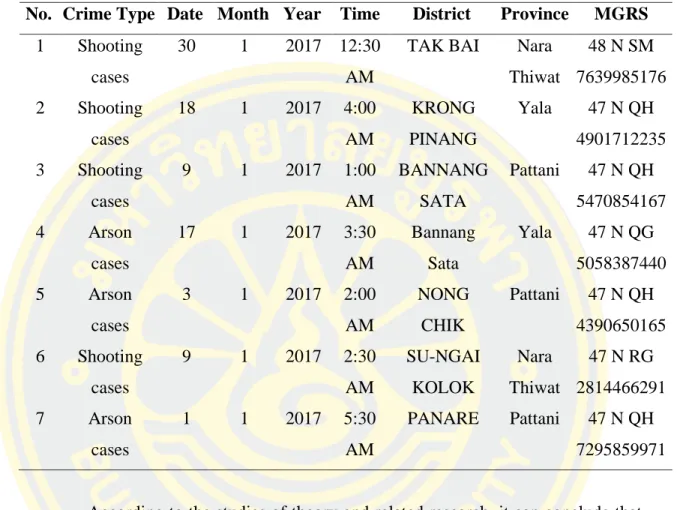
- Crime data
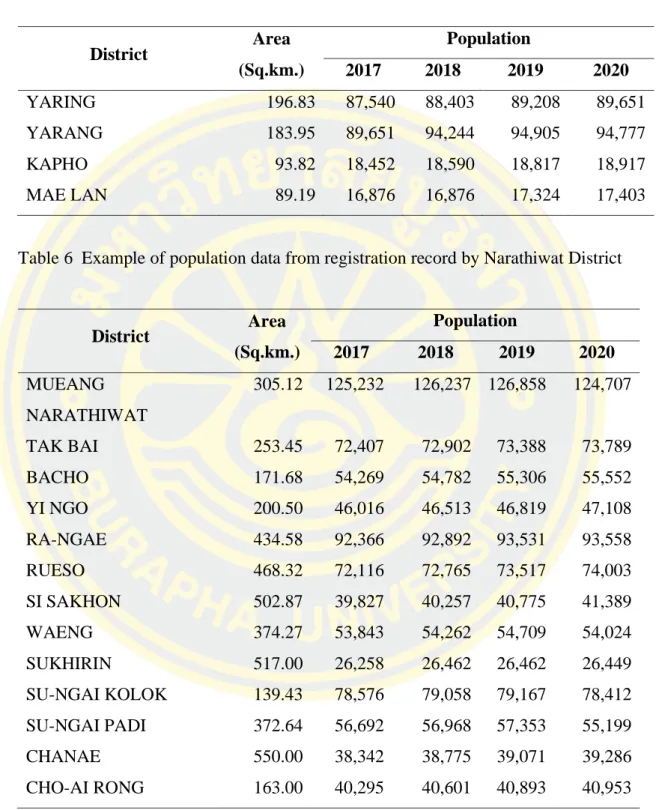
- Population density data
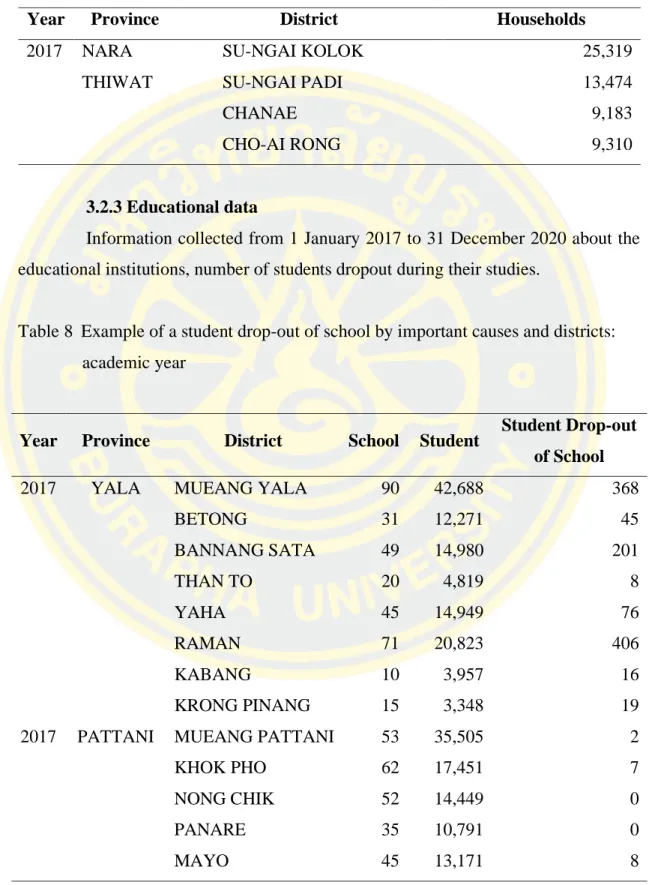
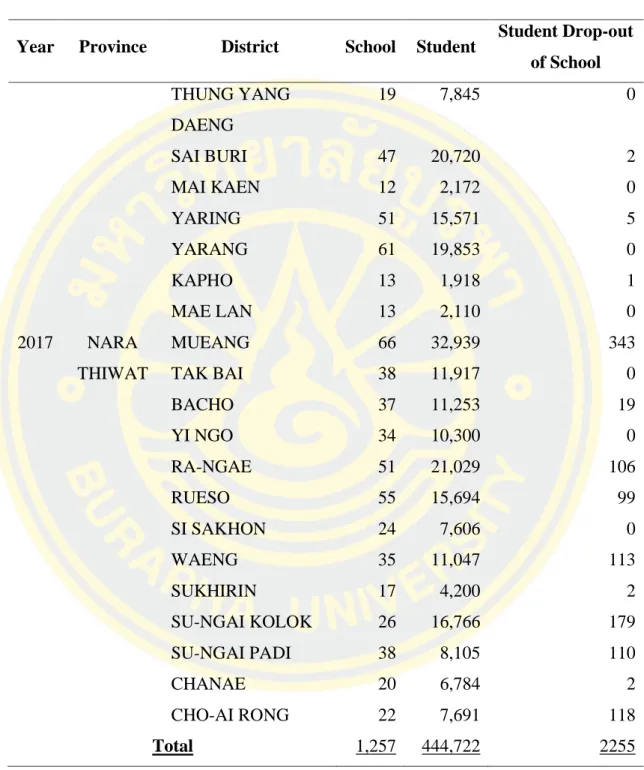
- Educational data
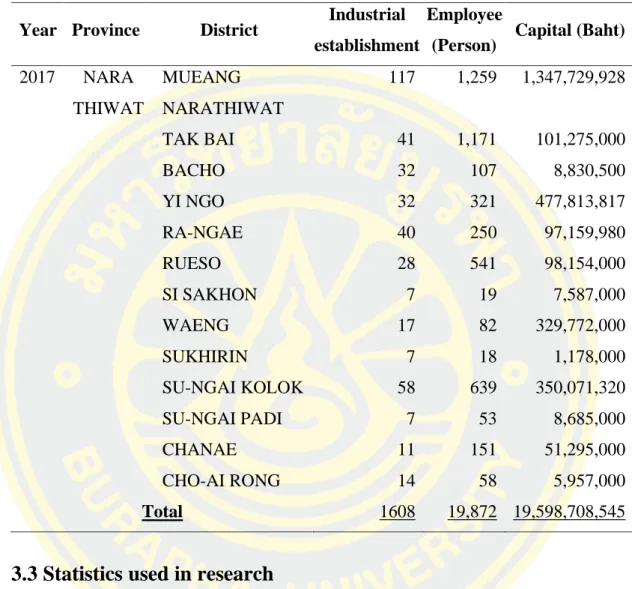
- Industrial establishments data
- Statistics used in research
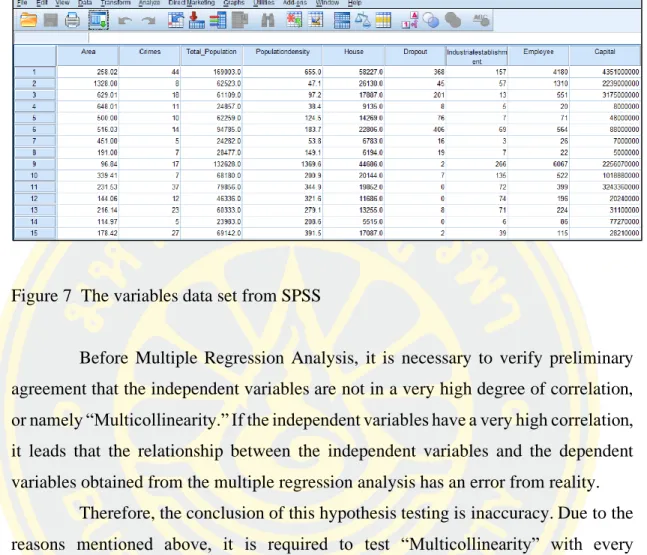
- Data analysis
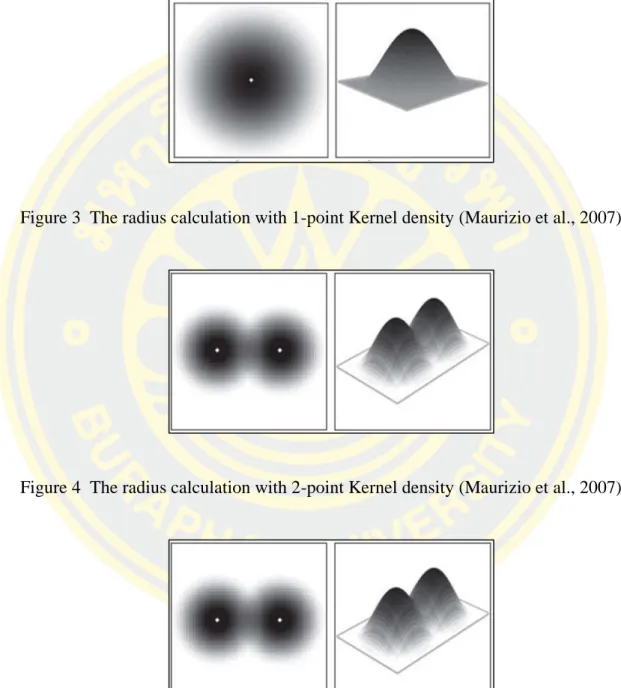
- Kernel density estimation
- The conversion standardization of the crime density
- Analysis of the distribution pattern of the crime scene
- Two Step Floating Catchment Area
In this study of the patterns, characteristics and density of crime cases in space and time in the three southern border provinces of Thailand. The researchers collected data from the Directorate of Intelligence, Royal Thai Army, and compiled the riots from several sources such as trusted media from 2017 to 2020, the researchers selected the type of crime and environmental factors of the area as follows. In addition to crime studies in areas, many researchers are interested in conducting studies in urban areas, suburban areas, or even parts of cities, such as residential areas, modified areas of cities, and empty spaces in urban areas.
The values of the radius and the distance of the bandwidth for the analysis depend on the users and the cases of the analysis. In the case of the crime density area estimate, the density of each case is considered using the technique of point distribution, so that the kernel density estimate must be adjusted in the density base values to obtain the same bases because each case does not have the same frequency (Yiampisan & Srivanit , 2010). For the studies in the area of the Three Southern Border Provinces, the spatial autocorrelation analysis supports the test of crime patterns in the studied areas.
Spatial statistical analysis, divided into 3 forms, describes the distribution of things on Earth as 1) a cluster pattern; 2) random sample; and 3) diffuse pattern. Using mathematical and statistical methods to describe the distribution characteristics in this study, the data to analyze the distribution characteristics of violent points in three southern border provinces of Thailand were collected from 1 January 2 0 1 7 to 3 1 December 2 0 2 0 D̅o is the average of the distance between pairs of points that are observed closest to each other in space.
The results of the calculations show that the averages were clustered near two crime scenes. The results of the calculations show that the averages near one crime scene were a random pattern, or that each area had a different distribution of points. Variables used to find the correlation include, number of crime cases in the area at the district level and physical environment of the Three southern border provinces.
Besides having various advantages in the gravity model, the 2SFCA method is important for interpretation because it essentially uses a special form of the crime ratio. A buffer approached at a certain distance, which was 10 km. from police stations using the following equation 5. 2) Analysis of the average radius of the crime scene surrounding checkpoints and police stations in the area (proximity distance). In this current study, only the proximity calculation was used to analyze the average radius of crime scenes that occurred around checkpoints and police stations.
It leads to effective preventive measures to reduce the incidence of crime in a certain area of the three southern border provinces in Thailand.
EXPERIMENTS AND RESULTS
Spatial data analysis
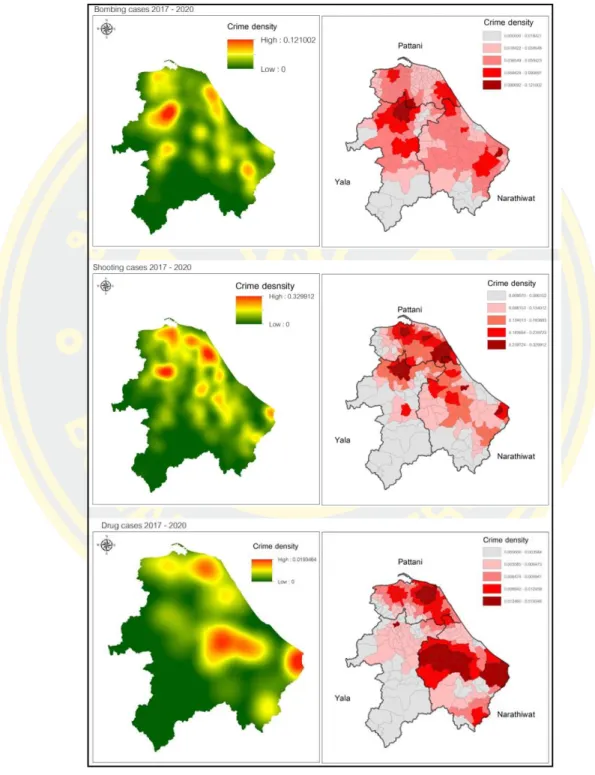
- Consideration of the pattern and density of crime cases classified by the
- Consideration of the density of crime cases classified by year
- Consideration of the pattern and density of crime cases classified by the
Fundamental data analysis
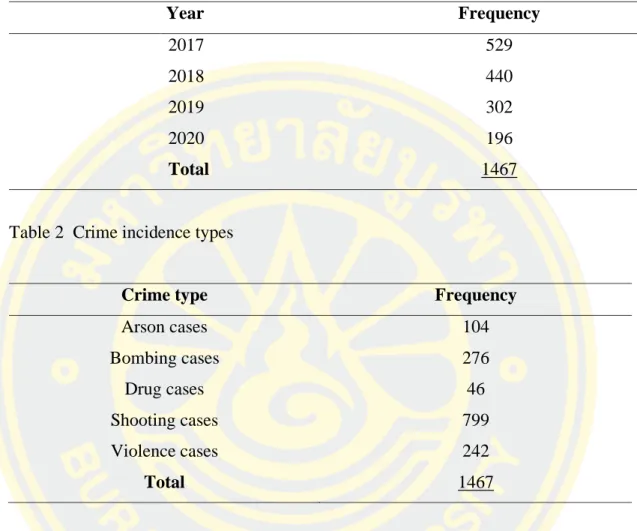
- Crimes in the Three southern border provinces during 2017-2020
- Types of crimes during 2017-2020
- Time of day of crimes during 2017-2020
- Locations of crimes during 2017-2020
- Comparison of types of crimes each year
- Comparison of crimes by provinces
- Comparison of types of crimes by times
Statistical analysis
Spatial accessibility analysis
- The Demand and supply index
Compared to other crimes, the crime of shooting had the highest crime density in the three southern border provinces. A sample of violent crime in the three southern border provinces was combined with a z-score of -10.071614. In Figure 14, which shows crimes in the three southern border provinces during the period 2017-2020, classified by time (day or night), crimes at night were more common than during the day.
When comparing the types of crimes in the three Southern Frontier Provinces by year, province and time, the results were as follows. Multiple regression analysis to study the factors influencing the crime rate in the three Southern Frontier Provinces. On the other hand, the investment amount (capital) was unable to predict the crime rate in the three southern frontier provinces with statistical significance.
In summary, it can predict the number of crimes in the three southern border provinces to be 36.2 according to five factors, while the remaining percentages may come from other factors.
DICUSSION AND CONCLUSION
- Discussion
- Conclusion
- Recommendation
- Recommendation for the government
However, in the terrorist's view, cobwebs or nets connect the lanes to help the perpetrators escape. The majority of physical attacks take place during the day, in public, in living communities and in the economic zone. The second variable, the number of industrial establishments in the area, had an effect on the increase in crime by 40.9%.
As a result, related agencies responsible for peaceful maintenance in the areas should pay attention to the increase of these two factors. These variables should be promoted by relevant agencies to reduce the frequency of crime in the localities. Compared to the situations in 2019 and 2020, the trend of criminal situations in the southern border areas has decreased systematically and noticeably since 2017, and it is expected to gradually improve.
This leads to improvements in solving criminal and disorderly problems in the three southern border provinces. Because these factors have an effect on crime reduction, related agencies should promote them by encouraging the participation of local people in crime prevention in communities and by training local leaders and people to prevent crimes in the area . When facilities such as police stations and security officers increase in the study area, crime rates decrease in proportion to the density of government sectors.
Therefore, these factors must be improved to reduce the number of crimes in the areas. The study should be covered on a small scale for studying more details than on a large scale. These factors may support troublemakers' resistance to being stronger in the southern border provinces, and they are cited by (Ninsri, 2014) as a notable conflict factor.
In order to find the criminal trend in the area, the study period should be longer such as for 10 - 30 years to depict changes and movements in a more manageable way. Measures of spatial accessibility to health care in a GIS environment: synthesis and a case study in the Chicago region.