การศึกษาครั้งนี้มีวัตถุประสงค์เพื่อพิจารณาความเป็นไปได้ของการเปลี่ยนแปลงโครงสร้าง ราคาพืชเศรษฐกิจไทย 4 ชนิด ได้แก่ ข้าวหอมมะลิ เงินยาง มันสำปะหลัง และน้ำมันปาล์ม ในการศึกษาได้ใช้แบบจำลองการเปลี่ยนแปลงโครงสร้างพหุที่เสนอโดย Bai และ Perron/พื้นที่ปลูกทั่วประเทศ จากการศึกษา สรุปว่า มีความเป็นไปได้ที่จะเปลี่ยนแปลงโครงสร้างราคาของพืชเศรษฐกิจทั้ง 4 ชนิดในระหว่างปี ประมาณเวลาที่อาจต้องใช้ การเปลี่ยนแปลงโครงสร้างราคาพืชเศรษฐกิจ ตามแบบจำลองการเปลี่ยนแปลงโครงสร้างหลายประการที่เสนอโดยสำนักเลขาธิการสภาผู้แทนราษฎร Bai และ Perron, 2014) ประมาณเวลาที่อาจต้องใช้ การเปลี่ยนแปลงโครงสร้างราคาพืชเศรษฐกิจตามแบบจำลองการเปลี่ยนแปลงโครงสร้างหลายประการที่เสนอโดย Bai และ Perron
เปลี่ยนโครงสร้างเมื่อไม่ทราบเวลาเกิด เปลี่ยนแปลง โดยแบ่งข้อมูลตัวอย่างออกเป็นแต่ละช่วงเวลาแล้วประเมินค่าด้วยการทดสอบ Chow เพื่อกำหนดระยะเวลา Brown, Durbin และ Evans (1975) เสนอการประมาณเวลา ที่ได้รับการเปลี่ยนแปลงโครงสร้างคล้ายกับของ Quandt (1960) แต่แตกต่างตรงที่ การศึกษานี้ใช้การทดสอบที่เสนอโดย Bai และ Perron เพื่อทดสอบจำนวนครั้งที่การเปลี่ยนแปลงโครงสร้างเกิดขึ้น ราคาเศรษฐกิจของพืชผลและช่วงคาดการณ์ ขณะที่วิธีของ Andrews (1993) สามารถประเมินเวลาในการเปลี่ยนโครงสร้างได้เพียงครั้งเดียว นอกจากนี้ การทดสอบ Bai และ Perron ไม่จำเป็นต้องทราบช่วงเวลา การเปลี่ยนแปลงเกิดขึ้นล่วงหน้า ในขณะที่วิธีของ Chow ต้องรู้ว่าการเปลี่ยนแปลงเกิดขึ้นเมื่อใด เปลี่ยนโครงสร้างก่อนแล้วลองทำดู
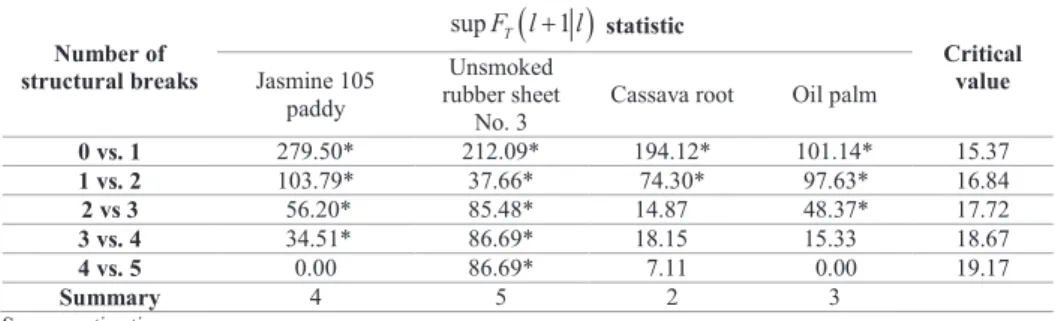
ของกลุ่มตัวอย่างขนาดใหญ่ (Large Sample assymptotic properties) การทดสอบของ Bai และ Perron ประกอบด้วย 1) ทดสอบว่าไม่มีการเปลี่ยนแปลง โครงสร้างเลยหรือมีการเปลี่ยนแปลง (การทดสอบการไม่แตกเทียบกับจำนวนการแตกคงที่) Bai และ Perron (1998) ใช้การทดสอบแบบ supF-type ภายใต้สมมติฐานหลักว่าไม่มีการเปลี่ยนแปลง โครงสร้างที่มีอยู่ ( m = 0) และ สมมติว่าพื้นฐานมีการเปลี่ยนแปลง (หรือทางเลือก) โครงสร้างเกิดขึ้นจำนวนครั้ง (m = k ครั้ง) หรือที่เรียกว่า supF test kT (0) แม้ว่าวิธีการของ Andrews (1993) สามารถประมาณเหตุการณ์ที่เกิดขึ้นได้แต่โครงสร้างจะเปลี่ยนแปลงเพียงครั้งเดียว นอกจากนี้ การทดสอบของ Bai และ Perron ไม่จำเป็นต้องทราบช่วงเวลา
เพื่อทดสอบความเป็นไปได้ของการเปลี่ยนแปลงโครงสร้างและการประมาณการ ระยะเวลาที่สามารถเปลี่ยนโครงสร้างราคาของพืชเศรษฐกิจทั้ง 4 ชนิด การศึกษานี้ดำเนินการตามคำแนะนำของ Bai และ Perron's (2003) โดยการทดสอบแยก ใน 3 ขั้นตอน ดังนี้
การทดสอบค่าสูงสุดสองแบบ (Double Maximum Tests)
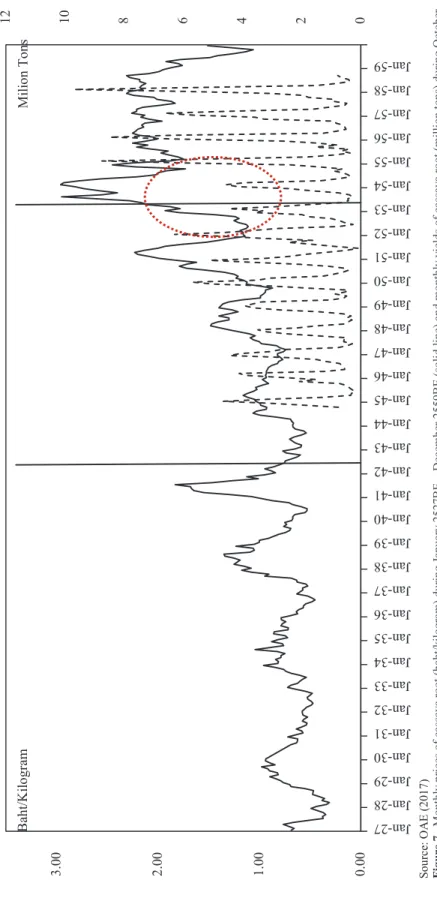
2018, JAN—APRJOURNAL OF ECONOMICS CHIANG MAI UNIVERSITY –22/1 Source: OAE (2017) Figure 2. Monthly prices of jasmine 105 paddy (baht/ton) during January 2527BE–December 2559BE (solid line), monthly yield of paddy jasmine (in millions) tons) between August 2545BE - April 2559Be (dashed line) and monthly jasmine 100% rice exports (million kilograms) (dotted line) Note: Vertical lines indicate potential dates of structural breaks in rice prices, including May 2533BE, March 2540BE and February 2551BE. Annual growth rate of world gross domestic product (%) (solid line) (World Bank, 2017) and annual Thai rice exports (million US dollars) (dashed line) Note: vertical lines indicate possible dates of structural break in paddy prices including May 2533BE, March 2540BE and February 2551BE. 2018, JAN–APR JOURNAL OF ECONOMICS CHIANG MAI UNIVERSITY –22/1 Source: OAE (2017) and Bloomberg (2017) Figure 4. Monthly prices of paddy jasmine 105 (baht/ton) (solid line) and monthly world price of Thai rice ( US$/ton) (dashed line) between January 2527BE-December 2559BE Note: Vertical lines indicate possible dates of structural break in paddy prices, including May 2533BE, March 2540BE and February 2551BE.
3 (Baht/kilogram) (solid line), monthly TOCOM prices of smoked rubber sheets No. Dollar/kilogram) (dotted line) and monthly WTI crude oil prices (US). The vertical lines indicate the potential structural fracture dates of unsmoked rubber at Sheet No. 3 prices including May 2532BE, June 2537BE, April 2542BE, June 2548BE and April 2553BE JOURNAL OF ECONOMICS CHIANG MAI UNIVERSITY –22/1 Source: Observatory of Economic Complexity (2017b) Figure 6. Annual natural rubber imports from Thailand or China (solid line), US (dotted line) and Japan (dotted line) (billion US dollars) Note: The vertical lines indicate the potential structural break dates of prices for non- No. 3 smoked rubber plates, including May 2532BE, June 2537BE, April 2542BE, June 2548BE, and April 2553BE.
JOURNAL OF ECONOMICS CHIANG MAI UNIVERSITY –22/1 Source: OAE (2017) Figure 7. Monthly prices of cassava root (baht/kilogram) in January 2527BE–December 2559BE (solid line) and monthly yields of cassava root (million tons) in October 2544BE – September2558BE(dotted line) Note: The vertical lines indicate the possible structural break dates of cassava root prices, including May 2542BE and April 2553BE. 2018, JAN – APRJOURNAL OF ECONOMICS CHIANG MAI UNIVERSITY –22/1 Source: OAE (2017) Figure 8. Monthly exports (million kilograms) of cassava chips (solid line) and of cassava pellets (dotted line) during January 2541BE – December 2559BE Note: The vertical lines indicate the potential structural break dates of cassava root prices, including May 2542BE and April 2553BE. JOURNAL OF ECONOMICS CHIANG MAI UNIVERSITY –22/1 Source: OAU (2017) Figure 9. Monthly oil palm prices (>15 kg fresh fruit branch) (Baht/kilogram) in February 2534BE – December 2559BE (solid line) and monthly oil palm yield ( 10,000 tons) (dotted line) during January 2548BE – December 2557BE Note: The vertical lines indicate the potential structural break dates of oil palm prices, including January 2541BE, November 2544BE and October 2555BE.
2018, JAN—CHIANG MAI UNIVERSITY ECONOMIC EXPECTATION –22/1 Source: OAE (2017) and Bloomberg (2017) Figure 10. Monthly prices of palm oil (>15 kg.fresh fruit branches) (Baht/kilogram line) (solid line) and Bursa Crude Palm Oil Prices (Malaysian Ringgit) (dashed) February 2534BE–December 2559BE Note: Vertical lines indicate possible dates of structural break in palm oil prices, including January 2541BE, November 2544BE and October 2555BE. Reports on key agricultural price trends in southern Thailand.fromhttps://www.bot.or.th/Thai/MonetaryPolicy. Techniques for testing the stability of regression relationships over time.Journal of the Royal Statistical Society.