Tourism Demand and Corruption:
Are the Impacts of Relative Corruption on International Tourist Arrivals in Thailand
Relevant?
Wanvilai Chulaphan
Faculty of Economics, Maejo University, Chiang Mai, Thailand
Jorge Fidel Barahona Caceres
Faculty of Economics, Maejo University, Chiang Mai, Thailand
Abstract
This article evaluates the impact of relative corruption on international tourist arrivals in Thailand using a generalized least squares estimator. We compile a panel dataset that consists of data from 29 countries from 2010 to 2017. The results suggest that relative corruption has a detrimental impact is greater as the distance of corruption between Thailand and the country of
marketing strategies based on the relative levels of corruption exhibited in the tourist market. Furthermore, governments should build long-term and short-term tourism policies that aim at improving tourist perception of corruption in Thailand.
Keywords: relative corruption, tourism demand, Thailand, international tourist arrivals
JEL Codes: Z30, Z38
1. Introduction
The importance of the tourism industry is evident in Thailand since it is a generator of income and employment, and is a source of economic growth (Chancharat, 2011; Chulaphan & Barahona, 2018). The tourism sector driver of economic recovery (OECD, 2020; World Bank, 2021). However, sectors. OECD (2018) reported that the perception of corruption in Thailand
corruption could be detrimental to the development of the tourism industry
tourism demand in Thailand.
Research in international tourism demand has undergone several phases. Early studies focused on measurement issues related to the proper
variables. Later the focus shifted to modelling and forecasting techniques to study tourism demand (Dogru et al., 2017). As of late, there is a growing
likely to stimulate economic growth and encourage tourism stakeholders to invest and develop more tourism-related products, programs, and infrastructure (Tang, 2014). Among governance indicators, the absence of corruption, the rule of law that protects property rights, and bureaucratic quality are among the most relevant traits (Lee, 2015). Furthermore, countries with lower levels of corruption are associated with greater democracy and economic freedom
well-being (Poprawe, 2015). Consequentially, corruption is detrimental to the
of corruption are likely to attract more tourist arrivals (Poprawe, 2015; Tang,
tourism demand. For example, using the corruption perception index from transparency international, Poprawe (2015) argued that a traveler’s decision to
2013). Tang (2018) said that better control of corruption would increase tourism
processes to attract bribery.
A growing literature investigates how relative measures of corruption
similar levels of corruption, but would be less comfortable visiting a relatively more corrupt nation. However, what is not known is whether the impact of relative corruption on tourism demand varies between origin countries who are exceedingly less corrupt to origin countries who are moderately less corrupt.
economy depends on the tourism sector’s performance and has a corruption
international tourist arrivals in Thailand. For this, we measure relative corruption based on the Control of Corruption index provided by the World
form of international tourist arrivals to Thailand from 29 major countries using an autoregressive distributed lag model (ADLM). This research contributes to the body of literature by providing evidence that international tourists are
Furthermore, the impact of corruption on tourism demand is more prominent as relative corruption widens.
2. Materials and Methods
2.1 Modelling Tourism Demand
In contrast to the demand for tangible goods, tourism demand is a
measures have been used in the literature to represent tourism demand, including tourist arrivals, tourism receipts, and length of stay at the tourist destination
demand is subject to data availability as well as the goal the research wishes to accomplish. To investigate the impact of corruption on tourism demand, we use tourist arrivals because corruption more likely will discourage tourists from traveling to the destination if they perceive it as being too corrupt or unstable.
Following Tang (2018), we model tourism demand based on the theory of consumer behavior, which states that tourism is a function of income in the origin country, tourist prices, exchange rate, and a set of determinants of tourism (as shown in Equation 1).
where TDit represents tourist arrivals from country i in year t. Yit is the PIit represents the price levels in Thailand relative to those in the origin country, and PSit is a weighted price index consisting of the prices of competing tourist destinations. In turn, ERit is the exchange rate, and Xit is a set of tourism demand shifters. Based on a
In the literature, several authors have posited that tourist prices are separately in the demand models because tourists might be more responsive
including these variables separately could bring about problematic results.
For this reason, we adjusted tourist prices with the exchange rate (Balli et al.,
PI, measures the cost of living at a destination relative to the origin country. PI is included in the model to
country and will help determine whether tourists prefer domestic or international tourism. In turn, the second price variable, PS
tourists’ preferences for competing destinations.
Following Dogru et al. (2017), we constructed two versions of PI (PI and PI2it). PI equals the CPI in Thailand divided by the CPI of the origin country i. In turn, we estimate PI2it by adjusting the price levels with the bilateral exchange rate using Equation 3.
CPITHt is the consumer price index (2010 = 100) in Thailand in year t, and CPIit is the consumer price index of the origin country i in that same year, and EXit is the bilateral exchange rate.
et al. (2012) to measure PSit it was measured by constructing a price index REXjt) and is weighted by the share of international tourist arrivals to a k group of substitute tourist destinations ( ijt) using Equation 4:
In the literature, two hypotheses underpin the theory of corruption
through setbacks in investment caused by bribery payments. The second hypothesis, “greasing of the wheels,” states that bribery facilitates the development of the tourism sector through accelerating tourism investments by avoiding bureaucratic hurdles. The former is more in line with the aim of this research decision to visit a tourist destination (Poprawe, 2015). For this reason,
variables that measure absolute levels of corruption or the perception of corruption in the demand model.
The perception of corruption plays a vital role since a person’s decision to travel to a destination may be informed by the levels of corruption at the
experienced in the tourist’s own country. Visitors would decide whether to visit a tourist destination based on the levels of corruption in the destination country relative to the corruption levels they experience in their own country (Demir &
(high ranking in terms of control of corruption) would be discouraged from traveling to countries with greater levels of corruption (low ranking in terms of control of corruption). For this reason, we included relative corruption as a shifter of demand in Equation 2.
We measured relative corruption based on the conceptualization of
corruption can be measured by measuring the distance between the corruption index of the two countries (Duanmu, 2011). However, the index used to measure
the Corruption Perceptions Index are built based on these risk measures (Rao, 2012) and have good performance in reporting overall corruption (Hamilton
& Hammer, 2018). Therefore, we decided to use aggregate indicators instead of risk indicators.
they are estimated. We will not go through a full review of the advantages and disadvantages of the aggregate indicators of corruption because it is out of the scope of the paper. However, Budsaratragoon and Jitmaneeroj (2020); Hamilton and Hammer (2018), and Treisman (2007) provide insights into this issue.
Although Control of Corruption and the Corruption Perception Index center on
Control of Corruption and Corruption Perception index are highly correlated, and with recent developments in the measurement of both indexes, the correlation has strengthened (Ahmad, 2001; Hamilton & Hammer, 2018; Treisman, 2007).
Therefore, they can be used as proxies. Based on this discussion, we follow inbound tourism demand in Malaysia.
between the world ranking of control of corruption for the origin country and Thailand’s corruption ranking. Later we build two dummy variables (
and CorrD2
, groups the slightly better countries than Thailand at controlling corruption. will equal one if it is not lower than zero and not greater than 30 ranking points. Otherwise, is equal to zero. In turn, CorrD2
better than those reported by Thailand. CorrD2
between the ranking of control of corruption between the country of origin and Thailand is more than 30 ranking points. CorrD2 is equal to zero when Linearizing Equation 2 and substituting and CorrD2 for Xit,
We proceeded to estimate two models to test the most appropriate price index
contains the relative tourist prices adjusted for the exchange rate (PI2).
A problem comes in the selection of what countries are competitive tourist markets for Thailand. Based on closeness and similarity to Thailand, tourist competitors. Furthermore, despite having several economic and
may arguably be considered competitors for Thailand. For this reason, three PS were constructed (PSASE, PSNE, and PSALL) and included
PSASE
and the Philippines). In turn, PSNE
PSNE because the country shares more similarities in terms of economic development and
PSALL is the weighted average of prices from countries in both areas.
distributed lag model (ADLM) of the forms shown in Equation 7 and 8.
(7)
(8)
7 and 8 (using a maximum k lag of 2 for each determinant of tourism demand).
We then proceeded to eliminate the lags of independent variables that were
avoid issues related to heteroscedasticity, we proceeded to estimate Equations 7 and 8 using a generalized least squares estimator.
2.2. Data
The dataset compiled for this study covers 29 countries that provide the highest number of tourists to Thailand over the years 2010 to 2017. International tourist arrivals from each of the 29 nations were gathered from the Ministry competitive countries (Indonesia, Malaysia, Philippines, China, Hong Kong, Bank Open Data website. The bilateral exchange rate was extracted from the
The rankings of control of corruption for the 29 countries and Thailand were
the previous section. The descriptive statistics for the variables used in this study are shown in Table 1.
Table 1.
Variable Obs Mean Max Min
232 1195703.000
232 1221032.000 710282.400
232 99.103 7.201 113.250
232 4742.940 28571.430 1.882
232 18.294 53.505 0.004
232 0.194 1.000 0.000
232 1.000 0.000
232 107.518 5.110 117.048 100.000
232 117.218 139.028 100.000
232 103.995 2.494 109.241 100.000
TD is the total international tourism arrivals to Thailand, Y PI is the relative price levels of Thailand to origin countries, and PI2 is the relative prices levels of Thailand to origin countries adjusted by the bilateral exchange rate. ER is the bilateral exchange rate (baht per local currency), and CorrD2 are dummy variables representing relative corruption. Finally, PSALL, PSASE, and PSNE are weighted price indexes of major
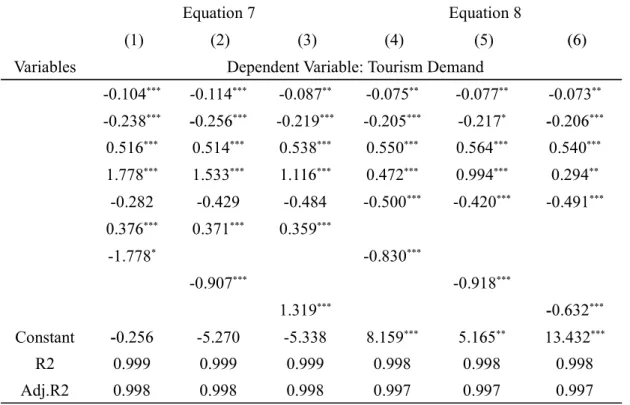
Columns 1, 2, and 3 of Table 2 report the estimates of the tourism demand model where the tourist prices and exchange rate are included separately
and CorrD2
other variables constant, countries with a lower level of corruption compared
CorrD2 was considerably more negative than . As can be ranged from -0.07 to -0.11. In turn, CorrD2 ranged between -0.20 to -0.23, which is more than indicate that as the distance of relative corruption is greater, so are the impacts
Thailand and the tourist’s homeland is further.
corruption is a complex phenomenon brought about by low levels of democratic
role in shaping a tourist’s perception because he/she will associate the levels of corruption experienced in their country with the country’s democratic and economic freedom and use that as a point of comparison whenever they decide corruption on tourist arrivals may vary depending on the distance of corruption between the origin and destination country.
Table 2. Determinants of tourism demand
Equation 7 Equation 8
(1) (2) (3) (4) (5)
Variables Dependent Variable: Tourism Demand
-0.104*** -0.114*** -0.087** -0.075** -0.077** -0.073**
-0.238*** *** -0.219*** -0.205*** -0.217* ***
*** 0.514*** 0.538*** 0.550*** *** 0.540***
1.778*** 1.533*** *** 0.472*** 0.994*** 0.294**
-0.282 -0.429 -0.484 -0.500*** -0.420*** -0.491***
*** 0.371*** 0.359***
-1.778* -0.830***
-0.907*** -0.918***
1.319*** ***
Constant -5.270 -5.338 8.159*** ** 13.432***
R2 0.999 0.999 0.999 0.998 0.998 0.998
Adj.R2 0.998 0.998 0.998 0.997 0.997 0.997
et al., 2010; Tang, 2018). Furthermore, results show that income in the form level and exchange rate were separated, an increase in the income of tourists are analogous to previous tourism demand studies where income was the factor
model consisted of the relative tourist prices adjusted for the exchange rate.
point to the importance of standardizing the price levels with the exchange rate when conducting tourism demand studies.
PS were reasonably consistent throughout the results. It is shown that most of the cross prices included in the model were complementary, as seen in the negative sign of the estimates for PSALL and PSASE. The results also show that when the exchange rate was included in the model, PSNE was positive. However, when the exchange rate was excluded from the demand model, PSNE
the Asian region were complementary.
Providing some context about the Asian tourism industry would help
generated by the tourism industry. Therefore, tourism development is a central issue when countries develop national and regional policies. A policy transport market. Policies that promote liberalizing the air transport industry in Asia during the last decade. The region experienced a massive expansion of
packages for tourists (for example, AirAsia’s travel program). These developments facilitated the creation of a tourist hub in Asia where tourists would use traveling to Thailand as an opportunity to visit neighboring countries known for their major tourist attractions and vice versa. Consequently, tourists would see a fall in PS
they would decide to visit multiple countries in the region, thereby increasing the number of tourist arrivals.
PS was near unit elastic when PSASE was included in the model. However, the magnitude was considerably lower when PSNE
geographically close to each other, are famous for their tourist attractions, and are known to have low living costs in comparison to other tourist destinations
nations led to more air routes passing through Thailand, further integrating the country’s tourism industry with the region. In contrast, the tourist industry of
region.
4. Conclusions
increases, the number of tourist arrivals in Thailand also increases. Furthermore, when relative prices were adjusted with the exchange rate, the tourist prices tourist destinations in Asia and Thailand were complements. Interestingly, the
found that nations that exhibited lower levels of corruption in comparison to
of the level of corruption relative to their home country showed a greater arrivals may vary depending on the distance of corruption between the origin
Consequently, it is worth considering collaborative initiatives with other nations in the region that would promote and enhance travel to multiple Asian
dynamics of tourism price levels when developing tourism development policies.
The Thai government must pay careful consideration to the country’s corruption since a lack of control of corruption deters visitors from traveling to Thailand. Control of corruption is often associated with the
pandemic). Therefore, to continuously expand the number of tourists, control of corruption must be at the center of the nation’s long-run development agenda.
Furthermore, smart technology could be expanded in the tourism sector as a means to enhance transparency and accountability. Moreover, indicators of corruption and transparency in the Thai tourism sector could be established and made publicly available as a way to monitor tourists’ perception of corruption
tourist operators and policymakers can use relative corruption as a factor to prioritize and distinguish the type of marketing campaign used to promote Thai tourism. Regular marketing strategies can reach potential tourists in countries with equal or lower levels of corruption relative to Thailand.
For countries whose corruption is vastly lower relative to Thailand, visitor numbers. For example, tourists from Europe are the biggest group to and hospitals could form strategic partnerships to advertise Thailand as a med-
ical tourism destination, which could help attract a larger number of visitors from Europe. Furthermore, there is a possibility that tourists who have a high preference for alternative forms of tourism like adventure, ecotourism, etc., could help investigate whether the preferences for these types of tourism lessen
4), 813-830. https://EconPapers.
repec.org/RePEc:pid:journl:v:40:y:2001:i:4:p:813-830
Low cost airlines and international tourism demand. The case of Porto›s airport in the northwest of the Iberian Peninsula. Journal of https://doi.org/https://doi.
Intelligence Center. https://www.scbeic.com/en/detail/product/2953 Balli, F., Balli, H. O., & Cebeci, K. (2013). Impacts of exported Turkish soap
operas and visa-free entry on inbound tourism to Turkey. Tourism man.2013.01.013 Budsaratragoon, P., & Jitmaneeroj, B. (2020). A critique on the Corruption
Perceptions Index : An interdisciplinary approach.
https://doi.org/https://doi.
state of research. Kasetsart Journal of Social Sciences, 2), 340-351.
Cheng, K. M. (2012). Tourism demand in Hong Kong : income, prices, and
visa restrictions. https://
Chulaphan, W., & Barahona, J. F. (2018). Contribution of disaggregated tourism on Thailand’s economic growth. Kasetsart Journal of Social kjss.2017.07.012
impact of the relative corruption on the inbound tourism to Turkey.
https://
doi.org/10.1002/jtr.2118
Dogru, T., & Bulut, U. (2018). Is tourism an engine for economic recovery?
Theory and empirical evidence. , 425-434.
tourism demand : Old theory and new evidence. Tourism Management, , 47-55.
gap? Corruption, knowledge and foreign ownership (Working eprint/18513/1/1019.pdf
Journal of
intman.2011.01.003 ECA. (2017). Cost of living
from https://www.eca-international.com/insights/white-papers/
november-2017/eca-global-perspectives-cost-of-living
Australian Economic Papers, 2), 121-133.
Hamilton, A. J., & Hammer, C. (2018).
corruption (Policy Research Working Paper, 8299). World Bank.
Retrived from https://openknowledge.worldbank.org/bitstream/
competitiveness. 4), 881-888. https://doi.
Kong against its competitors? An econometric study. Tourism Man
of democracy promote corruption and high levels diminish it. Political Research Quarterly, 4), 893-907
OECD. (2018). . https://
OECD. (2020). . https://doi.org/
doi:https://doi.org/10.1787/ad2e50fa-en
tourism. (23), 2399-2412. https://doi.org/10.
Country Risk Indices. Retrieved from https://doi.org/10.13140/
freedom matter for inbound tourism? A cross-national panel data
estimation. (2), 221-234. https://doi.
International Journal of Tourism Research, (3), 272-281. https://doi.org/10.1002/jtr.1985
of growth? https://doi.org/10.1007/
s11127-005-3988-0
A review of Recent research. Tourism Management, 29 (2), 203-220.
the Demand for Thai Tourism. Tourism Economics, 9 (
and their adverse economic and marketing implications - Evidence
from China. 2), 397-412. https://doi.
demand modelling and forecasting: how should demand be
measured? https://doi.org/Doi
tourism demand forecasting.
income in the tourism sector: Role of tourism demand and human
capital investment. https://doi.
Tang, C. F. (2018). The impacts of governance and institutions on inbound tourism demand: evidence from a dynamic panel data study. Asia (10), 1000-1007. https://doi.
in Malaysia: another visit with non - stationary panel data approach.
2), 189-200. https://doi.org/10.1080/13032917.2015.1084345 Tang, J. J. (2018, Oct). Evaluation of the Forecast Models of Chinese Tourists
(4), 3825-3833. https://doi.
org/10.1007/s11277-018-5413-2
Perspective of Property Rights Economics.
3), 275-287.
Treisman, D. (2007). What Have We Learned About the Causes of Corruption
1), 211-244.
polisci.10.081205.095418 World Bank. (2021).
Incomes, Recovering Jobs. https://openknowledge.worldbank.org/
Unesco Heritage? A Cross-Country Panel Estimate. Tourism Analysis, 5), 587-599. https://doi.org/10.3727/108354213X13782245307911