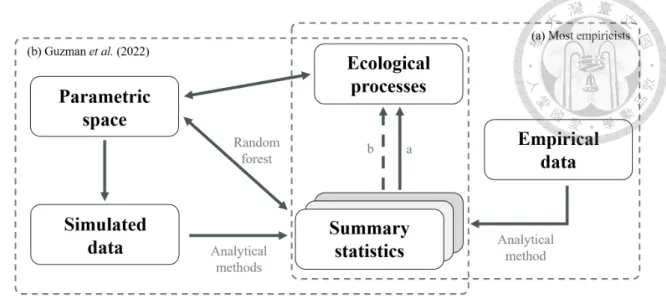
By adjusting the model parameters in the process-based model, the strength of the ecological processes underlying the observed metacommunity can be disentangled. The parameters of the process-based model can regulate the strength of the ecological processes. The model parameters that regulate the strength of the ecological processes can be predicted based on the summary statistics derived from the observational data.
Stegen’s framework
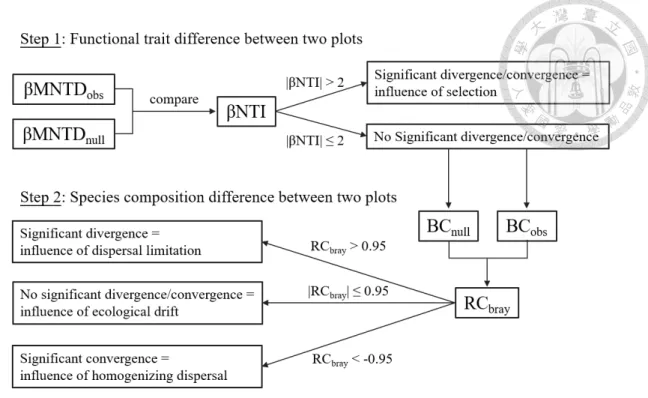
Compared to most of the null model-based methods that can only disrupt the presence of some ecological processes (Ulrich & Gotelli, 2010; Chase & Myers, 2011), Stegenet al.(2013) applied two-step null model to each pair of plots within the metacommunity. The significance of the divergence or the convergence of the phylogeny structure and species composition between the two sites was tested. The relative importance of the four ecological processes is summarized by the meanings derived from all pairs (Fig. 4).
Ford & Roberts (2020) modified Stegen's framework and used community-level functional trait data instead of phylogenetic data to quantify the relative importance of selection in a fish metacommunity. To calculate the deviation of the observed βMNTD from the expected null model, the species properties are permuted, and the βMNTD is recalculated with the permuted species properties. The total abundance and number of species in each plot and the abundance of species in the entire metacommunity are consistent in the permutation.
The observed Bray-Curtis distance and the set of Bray-Curtis distances generated by the null model are combined and standardized to range from -1 to 1. In our study, we applied this two-step null model to all possible patch pairs in a simulated metacommunity and calculated the relative importance (fraction) of selection, dispersal limitation by movement, homogenizing dispersal, and net drift based on species composition and species traits.
Dispersal-niche continuum index (DNCI)
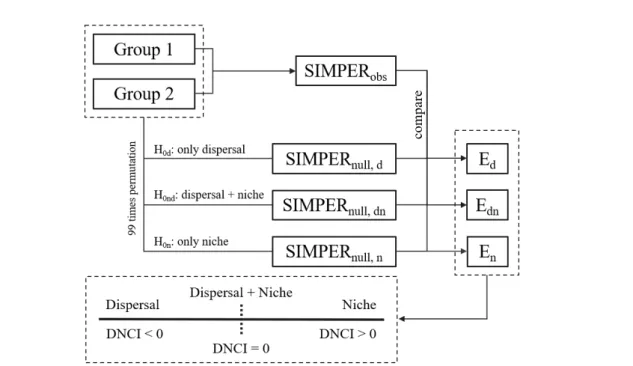
The raw contribution of species to OAD δi is defined as the average of the contribution of species to the disparity between each pair of spots in different groups, i.e. The OADδ is defined by the addition of the raw contribution of all species, i.e. The SIMPER profile is derived from the decreasing rank of the species contribution ratio γi = δi/δ.
In addition, the sum of the abundances of all species in each plot is bounded to zero. The second null hypothesis was H0n: only processes of niche assembly drive species turnover within the metacommunity. In this case, the sum of the abundances of all species on each patch was constant, but the total abundance of any one species was likely to change with each permutation.
In our study, we treated the DNCI and its standard deviation as the summary statistics of the metacommunity. By studying the contribution of the species to the disparity within the metacommunity, the relative importance of dispersal and niche assembly processes can be identified by the dispersal niche continuum index (DNCI).
Random forest approach linking summary statistics with parametric
For predicting competition type, the importance of the explanatory variables was defined by the mean decrease Gini (Hanet al., 2016), which was derived from the component importance of the object randomForestinR. For predicting niche breadth and spreading power, the importance of the explanatory variables was defined by the permutation variable importance measure (Janitza et al., 2016), which was derived from the component varimp of the object ordforinR. Only the samples with no missing summary statistics in all 20 periods were used to construct and evaluate the RFs.
Missing statistics in some samples in some periods may be caused by strong stochasticity, which produced low metacommunities, diversity and abundance, and sparseness of species composition, which resulted in missing DNCI.
Sensitivity analysis to sampling effort and choice of time steps
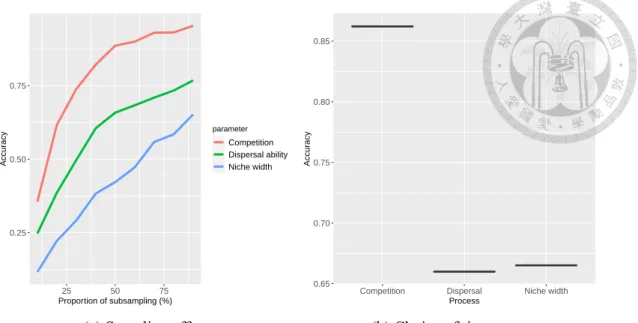
Without interpolating, a complete set of data (with no missing values) is required for the construction and evaluation of the RF. For different sampling efforts, the summary statistics were recalculated based on the subsampled species composition and inserted into the trained RF to calculate the accuracy in predicting the model parameters. We evaluated the robustness of the same RF after choosing the time steps to be the training data.
The explanatory variables of the RF were the summary statistics derived by the three analytical methods from the snapshots att. For each model parameter (niche breadth, diversification power and competition type), we covered the summary statistics in randomly chosen four time steps from t = 1.2. The distribution of accuracy for predicting three model parameters is shown in the box plot.
Application on Fushan Forest Dynamics Plot
Individuals that were missing (state = −1) or lost a stem without a DBH of its branches≥1 cm (state = −2) were removed from the quadrat in the species composition. Details of environmental conditions information and field survey are available in Suet al. (2007). Leaf traits were measured on randomly selected 6-12 individuals for each species found in the FDP.
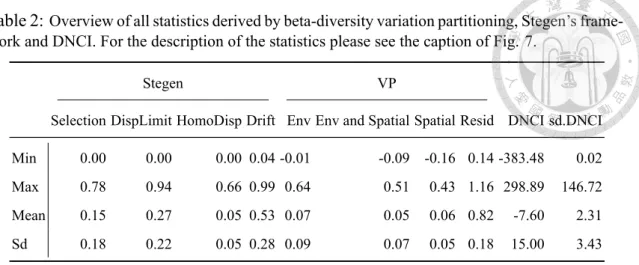
Total organic nitrogen mass per leaf mass unit (N mass) and total organic phosphorus mass per leaf mass unit (P mass) was obtained for 99 of the 103 species based on two microplate methods. The species composition, topographic data and coordinates for each quadrat and trait data for each species were used to calculate the summary statistics of beta diversity variation partitioning, Stegen's framework and DNCI. We obtained four sets of summary statistics based on the four snapshots of species composition in the FDP.
These summary statistics were entered into a trained random forest involving three analytical methods and four snapshots with tested performance and robustness to sampling and time step selection. Then, the species competition, niche width, and dispersal ability of the species in the Fushan Forest were evaluated.
Results 31
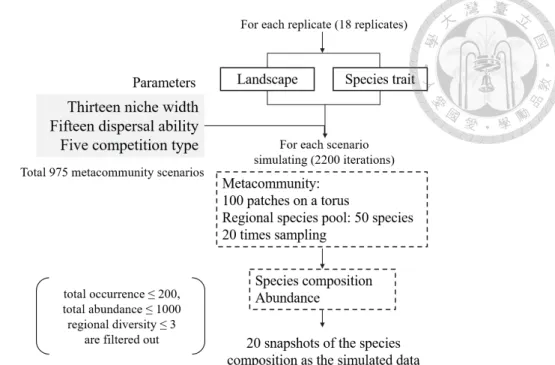
Summary statistics of the simulated metacommunity
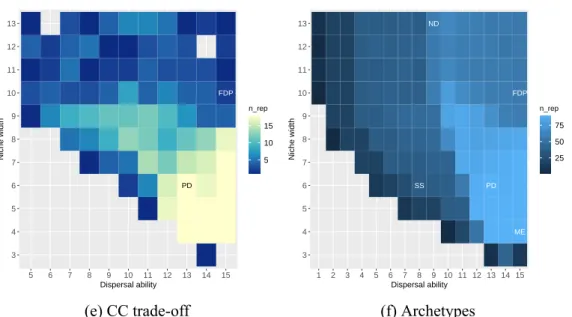
The number on the two axes represents the level of niche width and dispensing ability. On the x-axis, the numbers from 1 to 15 are the scattering ability from weak to strong. Values in tile plots represent the number of replicates remaining after excluding those with too low species abundance, diversity and occurrence, or those too rare to calculate DNCI.
If the scenario has no repeats after filtering, the values are displayed as missing in the tile charts. Panels (a)-(e) show the parameter space defined by niche width and dispersal ability with different types of competition. Labels in the tile plot indicate the subjective definition of four metacommunity archetypes in parameter space: species classification (SS), neutral dynamics (ND), mass effect (ME), and patch dynamics (PD).
The species in the Fushan Forest Dynamics Plot (FDP) are predicted to interact with each other with competition-colonization trade-off, medium strong dispersal ability and broad niches. The maximum value of the residual derived from variation partitioning could be greater than 1 because the residual was calculated by 1 minus the sum of the explained variation by environment or space.
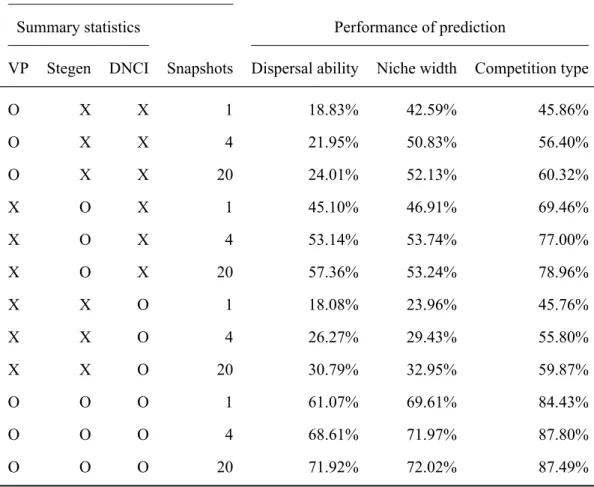
Performance in prediction model parameters
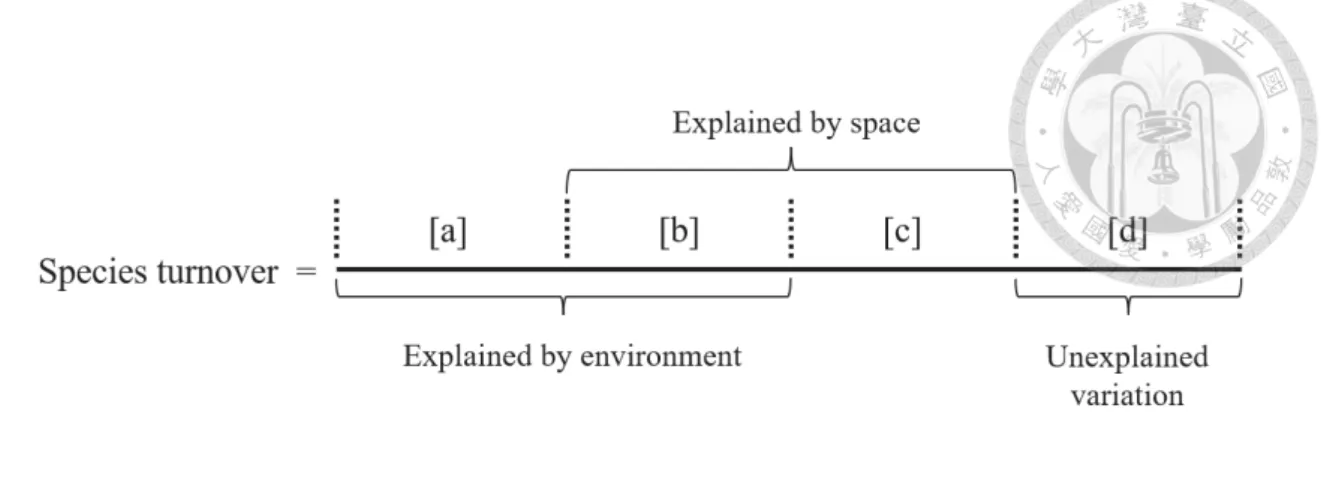
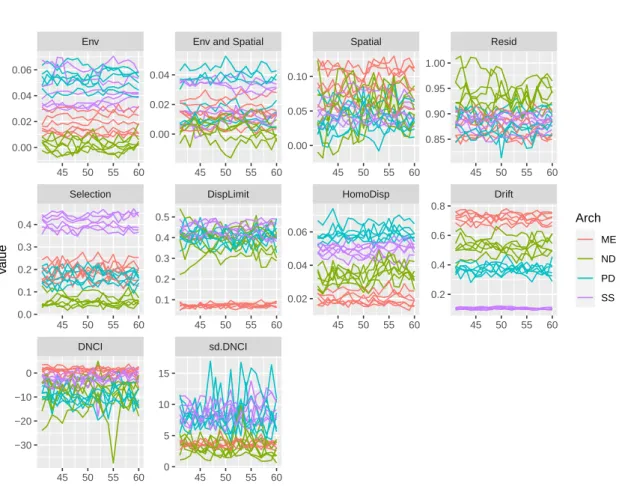
The reason that the minimum value of the variation explained by environment alone, space alone, and environment and space obtained by partitioning the variation was negative was that the explained variation was calculated by the adjusted R2 which can be negative when R2 is extremely close to zero (Legendre & Legendre, 2012, p. 633). Within each panel, the curve shows the dynamics of the values of each summary statistic over time. The first row shows the dynamics of variation explained by environment alone [a], by environment and space [b], by space alone [c], and unexplained variation [d] derived from the beta diversity variation partition.
The second row shows the dynamics of the fraction of selection, dispersal limitation, homogenizing dispersal and drift derived from Stegen's framework. The importance of the explanatory variables of the RF including the summary statistics derived from three different analytical methods based on the four snapshots was quantified (Tab. S1). The fraction of homogenizing dispersal and selection derived from Stegen's framework and the standard deviation of DNCI were the most important three statistics for predicting the type of competition.
The fraction of selection, homogenizing dispersal, and dispersal limitation derived from Stegen's framework and the variation explained by space derived from variation partitioning were the most important statistics for predicting dispersal ability. Variation explained only by environment, the fraction of selection and drift derived from Stegen's framework was the most important statistic for predicting niche breadth.
Robustness to the sampling effort and choice of time steps
The variance in accuracy is considerably small, which is not visible in the boxplots shown.
Application to Fushan Forest Dynamics Plot
The fourth column represented how many snapshots of the species composition are used to calculate the summary statistics and considered as the explanatory variables in the RF. First, the assumptions of the process-based simulation model must match the observed metacommunity. In Guzmanet al.(2022) the descriptive statistics are included as the explanatory variables of the RF.
Third, the incompleteness of the observed data may affect the accuracy of the parameter estimation. We showed that incompleteness of species composition reduced the performance of trained RF in predicting model parameters. The size of the deviation is determined by the robustness of the analysis methods themselves.
In addition, the sets of analytical methods for predicting the strength of ecological processes can be considered based on the availability of the data. The performance of this framework in quantifying the strength of the ecological processes can be evaluated. For predicting the competition type, the importance of the summary statistics is determined by the average decrease Gini.
To predict dispersal ability and niche breadth, the significance of the summary statistic is defined by the significance measure of the permutation variable.