United Arab Emirates University
Scholarworks@UAEU
Theses Electronic Theses and Dissertations
2008
Assessment of Noise Impact of Air Traffic at Dubai International Airport
Maryam Ali Ahmad Al Balooshi
Follow this and additional works at:https://scholarworks.uaeu.ac.ae/all_theses Part of theEnvironmental Sciences Commons
This Thesis is brought to you for free and open access by the Electronic Theses and Dissertations at Scholarworks@UAEU. It has been accepted for inclusion in Theses by an authorized administrator of Scholarworks@UAEU. For more information, please contactfadl.musa@uaeu.ac.ae.
Recommended Citation
Al Balooshi, Maryam Ali Ahmad, "Assessment of Noise Impact of Air Traffic at Dubai International Airport" (2008).Theses. 121.
https://scholarworks.uaeu.ac.ae/all_theses/121
United Arab Emirates University Deanship of Graduate Studies
M. Sc. Program in Environmental Science
Assessment of Noise Impact of Air Traffic at Dubai International Airport
By
Maryam Ali Ahmad Al Balooshi
Supervised by
Dr. Munjed Maraqa and
Dr. Vasser Hawas
Department of Civil and Environmental Engineering, College of Engineering, United Arab Emirates University
----- ---.. --- --
ABSTRACT
The aviation industry in UAE has experienced rapid expansion over the past decade due to increase in economic growth and technological advancements. UAE's total fiscal investment on airport development over the coming 20 years is estimated to exceed Dh7 1 billion (U $ 1 9.35 billion). Civil aviation now a day is considered one of the greatest en ironmental concerns which lead to many different environmental problems. The International Aviation Organization (lCAO) secretariat considered aircraft noise as the most significant cause of adverse community reaction related to the operation and e pansion of airports. This is expected to remain the case in most regions of the world for the foreseeable future.
Dubai International Airport (DIA) was established in 1 959. The site was chosen not j ust for its proximity to town but also with future expansion in mind. Since 1 992 the growth rate of i ncoming aircraft at DIA has been exponential, and the airport capacity has doubled between 1 980 and 200 1 . Aircraft movement is further expected to increase in the next 20 years with the already constructed new terminal. The negative impacts of noise resulting from airport operations are known and documented globally. However, a difficulty arise in predicting the variations and changes in airport operations and aircraft noise.
The specific objectives of this study were to assess the noise exposure levels, contour the noise profile within the surroundings of DIA, and depict long-term future noise exposure.
Field measurements of aircraft noise were undertaken close to the runway l 2L130R end points as well at 7 key locations in the vicinity of DIA. The aircraft noise was modeled using the Integrated Noise Model (INM) which is developed by the US Federal Aviation Administration (FAA) to simulate the current and future noise levels based on steady increase in flight operation. A future annual growth rate of 1 0.3% till the end of 20 1 0 and 3 .5% till the end of 20 1 5 was used based on feedback from local authorities.
The local order 6 11 1 99 1 of the Emirate of D ubai states that "noise level should not exceed 5 5 dBA between 7: 00 am and 8 : 00 pm and 45 dBA between 8 : 00 pm and 7 :00 am", Values for community noise set by WHO state that the equivalent noise level for outdoor living area should not exceed 55 dBA. Noise measurement in the vicinity of DIA shows that the
e qui a lent noi e Ie el aries from 45-65 . 1 dBA during normal flight hours and from 43.8- 69.4 dB during bu y flight hour . Iso, there was a reduction in the noise Ie el by almost
dBA between da and night time measurements. Measured noise levels in the icinity of the airport were close to tho e predicted under the current conditions.
Predicted noi e level at the end of 20 1 0 at Al Rashidiya and Mirdif are 62 .3 and 65.2 dBA, re pectivel . The predicted noise level at the end of 20 1 5 at the two community locations will ri e to 63 and 65.9 dB ,respectively. Hence, the noise level under cu rrent and future flight condition i 7- 1 1 dBA higher (especially at night time) than the regulatory limits at certain locations urrounding D lA.
Mitigation cenarlO were imulated to develop guidance and mitigation measures to minimize aircraft noise impact in the vicinity of D lA. This was achieved by utilizing the runway end usages and considering wind direction. Results of the mitigated cases lead to a change in noi e contour and shapes and reduction of the noise level at the most affected areas by distributing the noise to other areas (mainly at commercial areas like Al Khabaisi). The results also illustrate a reduction in the noise level by 3-8 dBA at Mirdif and Al Rashidiya.
The second objective of the study was to assess the impact of aircraft noise from D lA on the su rrou nding communities by conducting an individual noise survey at seven areas with consideration of distance and population density. A total of 1 72 respondents filled the distributed question naire. About 78% of the respondents were annoyed by the noise level due to aircraft movement at DIA, mainly in the areas which are inline with the flight path.
There is also a difference in the percentage of people annoyed among the surveyed areas due to differences in the distance from the ai rport as well as the location within the path of
the runway and the flight tracks. The most affected areas based on respondents ' input were
A l Tawar and Mirdif.
Fina lly, several recommendations were presented by studying other airports mitigation
procedures, pl ans and legislations and considering the respondents ' suggestions. The noise
abatement was one of the most recommended procedures by lCAO Committee on Aviation Environment Protection (CAE P). Thus, noise abatement procedures are used to redistribute the noise produced during the flight to alleviate the impact of noise on the most sensitive
IV
areas. hang ing runways and routes, spec ia l no i e abatement maneuvers dur ing take-o ff and app roach, reduces the number of people e posed to no ise at spec ific areas around
a irpo rt .
D E D I C T I O
�� � wi
� �.JJJ-ll
I�� wi
�wlS
cJ.t�l
..��L... c}
U.J:! ��
cJ.t�l
.. (�I �..>:) (jyWI
�1...,. A....1...,.i
(J.J�l
To whom v ho never he ld back in his support, a nd was looking for this work to be comp leted
et left few months before it was.
To the sou l of Osama Sa lem A l-Ameri l (rest in peace)
1 Chief Safety and Security, General Civil Aviation Authority (GCAA), UAE
VI
KNOWLEDGME T
I v,ould l ike to e tend my spec ial thanks to th pat ient , prayer and k ind words of my
fam il especially m brother and s i ter ; they were the pass ion insp ir ing my way.
I \vould l ike to expre my deep apprec iat ion and spec ial grat itude to my D iv is ion ( afety and r i i Manag ment- Duba i Internat ional A irport) general manager l ine managers
pec ia l ly Mr. Thamer Hab ib , and officer for be ing so pat ient w ith me and support ive. All
the people who contr ibuted to the certa in of th is thes is espec ially Mr. Alan kennerton
(D irector - Department of A iat ion ecur ity) , Also those work in the A ir Traffic Control
of Duba i Internat ional A irport, Meteorology Office Mr. Gha ith Al Gha ith , Execut ive V ice
Pre ident , Commerc ial Operat ions Worldw ide- Em irates A irl ine , and Duba i Wor ld Centre
pec ially Eng. Osama aleh and Eng Mohammed Al Mustafa, for the ir efforts in help ing me in collect ing all necessary data for the model ing and present ing the results. All have been upport ive and never hes itate to prov ide useful informat ion.
I would l ike to than k Dr. Munjed Maraqa for h is c l ose superv is ion and support. He has
been so helpfu l in g iv ing me necessary adv ice to complete my work. Also I wou ld l ike to
than k Dr. Yasser Hawas for h is support. My thanks also extend to the UAE Un ivers ity
Research Affa irs ector, the Roadway , Transportat ion and Traffic Safety Research
Center and the Deanship of Graduate Stud ies at the UAE Un ivers ity for fund ing the no ise
co ll ect ion measurements. Furthermore, I would l ike to than k Duba i Mun ic ipal ity and
Duba i Traffic Department for allow ing me to do the commun ity measurements.
Spec ia l than ks go to Eng ineer Omar Al Zaffin (Em irates Petroleum) for h is cont inuous
encouragement and support through my career in the fie ld of Env ironment as well as
throughout th is study.
TABLE O F CO TE T
Page
b tract. . . .. . III
Dedicatio n .. . . , . . . .. . Ack no \vledgme nt. . . Vll
Li t of Table . . . ... x
Li t of Figure . . . X III bbre \ iation . . . x
y rnbols . . . ... XVI HAPTE R 1 : I TROD CTIO 1 . 1 vervlew. . . .. . 1
1 .2 bjectives . . . 3
1 .3 pproach . . . .. . 3
1 .4 cope of Work . . . .. 5
1 .5 The i tructure. . . 6
CHAPTER 2: LITERATURE REVIEW 2. 1 Definitions and Terminology. . . 7
2.2 Aircraft Noise. . . . . . . . . . . . . .. . . . . . . . . . . . . . . . . . . . . . . . 1 1 2.3 Effect of Aircraft Noise. . . 1 4 2.4 Noise Guidelines. . . . . .. . 2 1 2.5 Review of Pre ious Studies. . . 28
2.6 Mitigation Measures. . . 29
CHAPTER 3: DATA COLLECTION AND METHODOLOGY 3 . 1 ite Description. . . 30
3 . 1 . 1 Location and surroundings . . . 3 0 3 . 1 .2 Metro logical Conditions. . . 3 3 3 . 1 .3 Runways. . . ... . 3 5 3 .2 Noise Modeling. . . 36
3.3 Fleet Mix and Flight Paths. . . 38
3 .4 Noise Simulation Cases. . . 50
3 . 5 Noise Data Collection. . . .. . 5 3 3 . 6 Community Noise Survey. . . 56
CHAPTER 4: MEASUREMENT AND SIMULATION OF NOISE AT AND IN THE VICINITY OF DIA 4. 1 Noise Level at the Airpo rt. . . . . . ... . . . . . 5 7 4.2 Noise Level in the Vicinity o f the Airport. . . 6 1 4.3 Simulation of Noise Level under Current Conditions . . . 67
4.4 Simulation of Noise Level in the Future . . . . . . . . . . . . .. . 70
4.5 Compliance with Regulatory Limits. . . 75
4.6 Mitigation Measures. . . 76
v m
H PT R 5: RE "LT T HE OMM 1 ITY 0 1 E R VEY
5 . 1 enera ) 82 Descr iption ..... . ...... . ....... · · · . . · · · . . · . . · · · . . · · · · . . . ·
5 .2 Health tatus . ....... ....... ...... . ..... · · · 83 5 . 3 Impact of ircraft o i e on Da ily ct iv it ies .................... ...... ... . · 85 5. 4 Impact of oi e on ocial ct iv it ies . . . 90
H PTE R 6: CO L 1 0 A D RECOMM DAT I ON
6. 1 onclu ion . . . 95 6.2 R commen dat ion ........... .......... . ... ...... .......... .......... .. ........... 96
R E FERE CE ......... ............. .... ............... . . .................. . . .. 98
APPE DI ES . ...................... ........ . · . · · · . . . . 1 03
AB T RACT I N ARABIC... 1 43
LI T O F TABLE
Table 2. 1 Em ironmental problems/impacts associated with operation of ci il
Page
aviation. .. . . . . . . . . . . . . . . .. . . . .. 1 4
Table 2.2 oise exposure limits set by DM. . . .. . . 22
Ta ble 2.3 Guideline alue for community noise in specif ic environments . . . 24
Ta ble 2.4 T pical ound transmission loss through glazing systems and corresponding external noise limit. . . . . . . . . . . . .. .. . . . . . ... 25
Tab le 2.5 HA noi e exposure limits for the work environment . . .. . . .. . . . . . . . 26
Table 2.6 oi e and land-use compatibility guidelines . . . 27
Table 3.1 Physical characteristics of the runways at DIA. . . .. . . 3 5 Tab le 3.2 Days considered for the selection of a representative day. . . ... . . . 43
Table 3.3 Aircraft types at DIA and their grouping according to the noise identifier. . . .. . . .. . . . 43
Table 3.4 Percent of SID used at DIA .... . . .. . . 46
Table 3.5 Percent of STAR used at D IA ... . ... . .. . . .. . . . .. . . 46
Table 3.6 Names of the tracks used in the INM . . . . .. . . .. . . .. . . ... . 49
Table 3.7 Simulated cases for current, future and mitigation scenarios . . . ... . 5 0 Table 3.8 Meteorological conditions at DIA for winter and summer seasons . . . . 5 1 Ta ble 3.9 INM parameter values used in Case 1 with one runway 1 2L130R. . . . .. 52
Ta ble 3.10 Location points coordinate close to the runway 1 2L130R at D IA . . . 53
Table 3.1 1 Location points coordinate for the communities measurements. . . . . . 5 5 Table 3.1 2 Time of noise measurements . . . .. . . .. 5 5 Table 3.13 Individual response form distribution areas . . . . .. . . . ... 56
Table 4.1 Noise level at runway ends 1 2L130R of DIA during 2006 . . . .. . 5 8
x
Table 4.2 Prediction of noi e level away from the runway end points under the
condition of 1 5 . 10/ D and 9 1 .60/ at I 2L A and 84.90/ 0 and 0 0 0
.4 1 at 30R (C e 2) . . . .. . . ... 58
Table 4.3 E qui alent noise level (LAeq) mea ured during norma l and busy
flight period in the vicini t of D I . . . . " . . . . . . . . . . . .. . . . . . 63
Table 4.4 Maximum noi e I el (LAmax ) during norma l and busy fl ight period
in the icinity of D IA . . . .. . 64
Table 4.5 Predicted and mea ured noise Ie el in the icinity of D rA Jan 2008. 67
Table 4.6 oi e leve l 70 during winter (Case 4) and sum mer (Case 5) time 2006.
Table 4.7 LAeq (dB ) at community locations under current and future flight peration at D rA using different runway operations. . . . . . 72
Table 4.8 LAmax (dBA) at community locations under current and future flight
op rations at D rA using runway 1 2L/30R. . . .. . . .. . . .. . . .. ... 73
Table 4.9 LAmax (dBA) at community locations under future flight operations at D rA with different runway usage . . . ... . . '" . . . . . . .. .. . . 73 Table 4.10 Affected area (km 2) with an associated LAeq surrounding D rA under
current and future conditions . . . 74
Table 4.11 Affected area ( km2) with an associated LAmax surrounding D rA under current and future conditions. . . 75
Table 4.12 Noise le 79 ve l under 20 1 0 mitigation scenarios . . . . . .
Table A1 F l ight operation used in the INM simu lations arranged by aircraft
type. .. . . . . . . ... . . .. . . ... . . . .. . . ... ... . . . .. . .... 1 03
Table E.1 C l 1 2 1 assification of noise re lated surcharges . . . . . .
Table E.2 App lic 1 22 ation of noise surcharges at selected airports. . . . . .
Table F1 Noise individua l 1 27 response survey summary data sheet. . .
Figure 1 . 1 Figure 1.2 Figure 2 . 1
Figu re 2.2
Figure 2.3 Figu re 3.1 Figure 3.2 Figu re 3.3 Figure 304 Figure 3.5 Figure 3.6
LI T O F F I GURE
Page
Grov,,1h rate of aircraft movement at Dr . . . 2 Work plan for the noise modelling activities . . . 5
10 H noise exposure limit for continuous or intermittent noise expo ure. . . . . . . . . 1 8 Qualit of p ech communication as a function of sound level and distance . . . " . . . . . . . . . 1 9 Relationship between exposure to aircraft noise and annoyance . . . 20
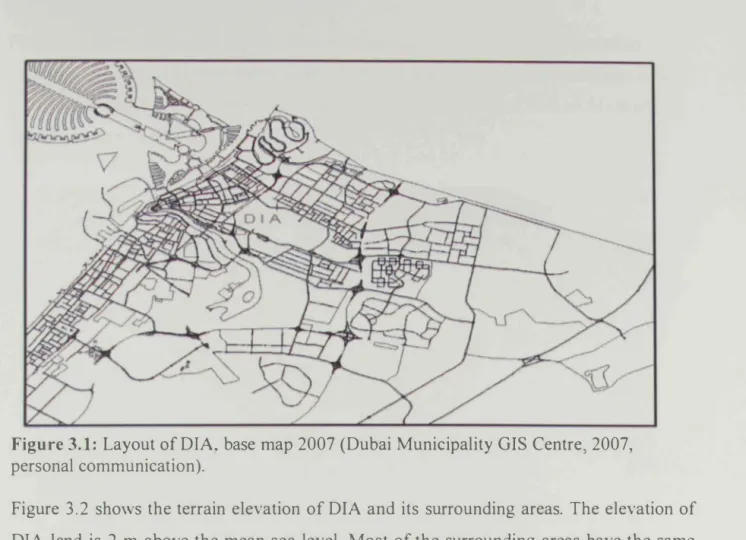
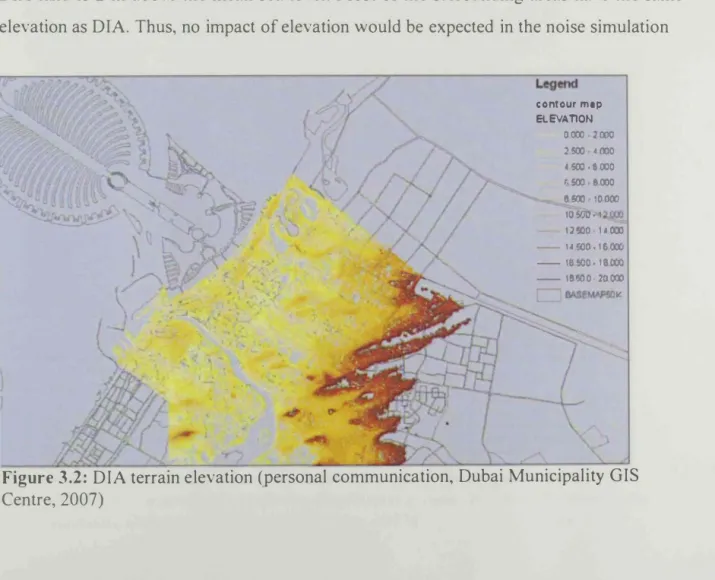
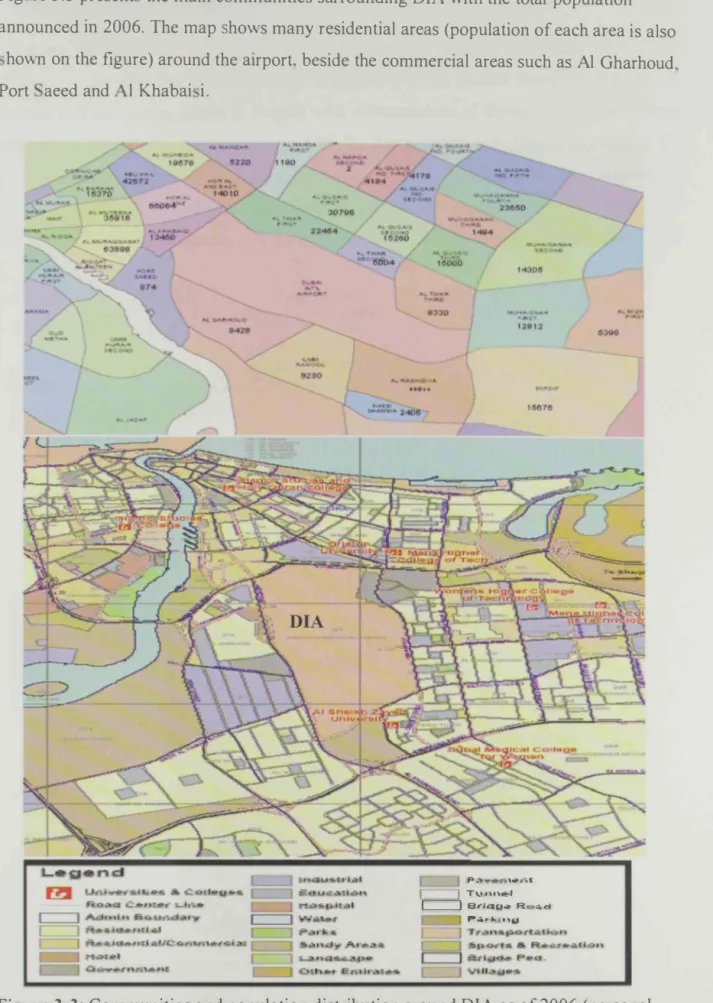
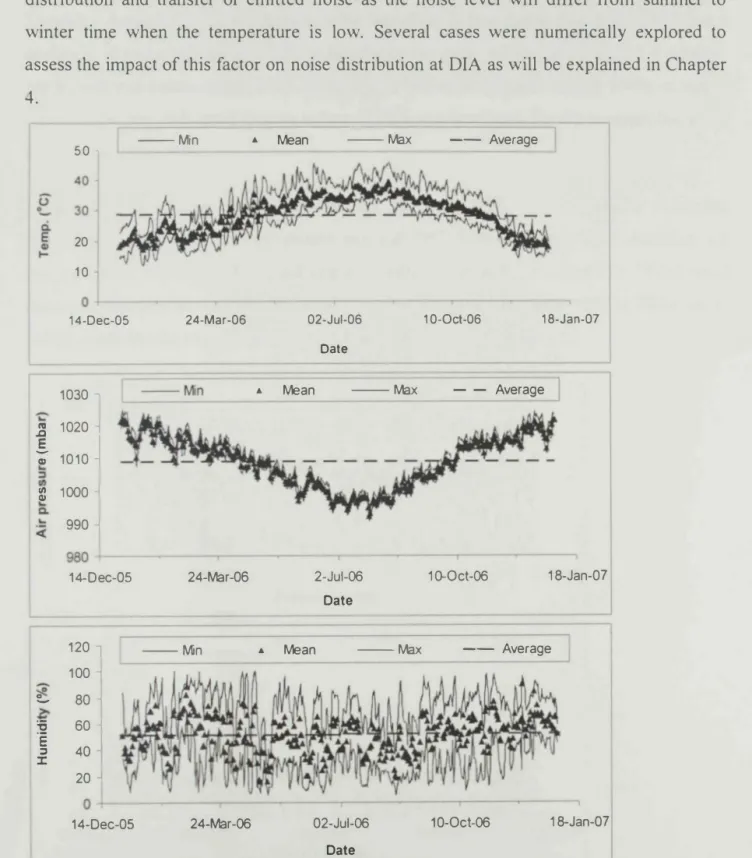
Layout of DIA base map, 2007 . . . . . . . . . . . . . . . 3 1 DI terrain elevation. . . . . .. . .. . . . . .. . . .. . . .. . . 3 1 Community and population distribution around DIA as of 2006 . . .. . 3 2 Temperature, air pressure and humidity at DIA during 2006. . . .. . . 3 3
Wind direction (top) and speed (bottom) at DIA during 2006 . . . '" 34 Schematic of the DIA runways reflecting the development over the years . . . 3 5
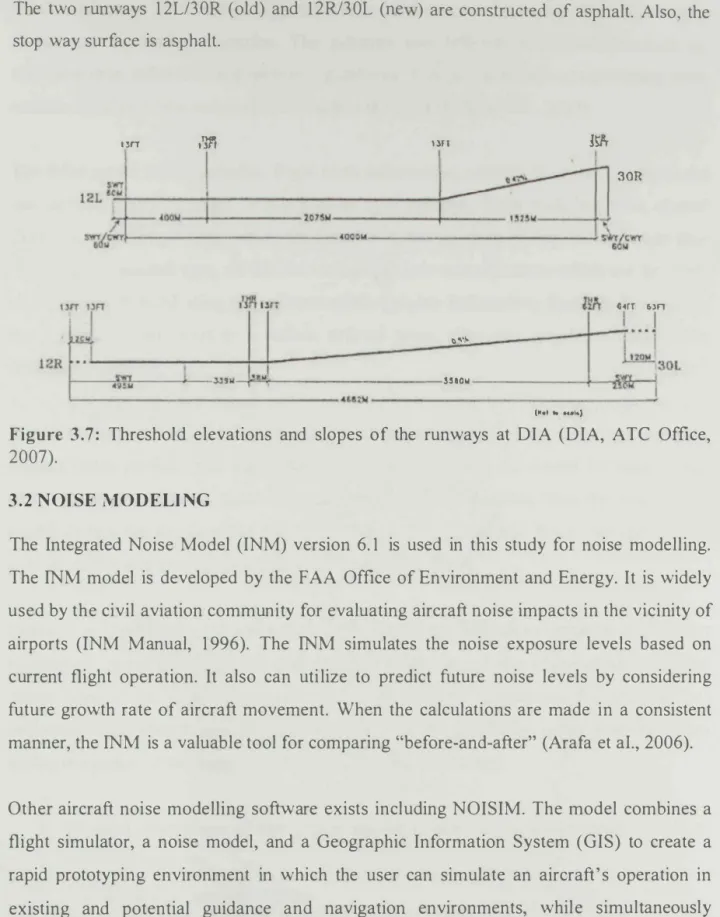
Figu re 3.7 Threshold elevations and slopes of the runways at DIA . . . .. . 36
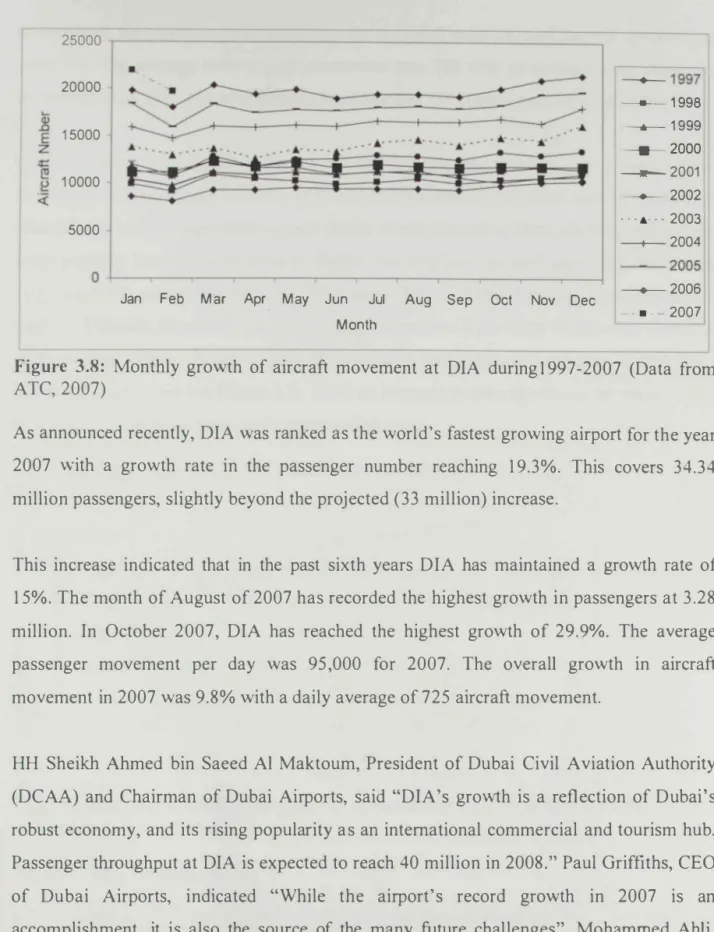
Figure 3.8 Monthly growth of aircraft movement at DIA during 1 997-200 7 . . . . 39
Figure 3.9 Projected average daily aircraft movement at DIA . . . . . . . .. . 40
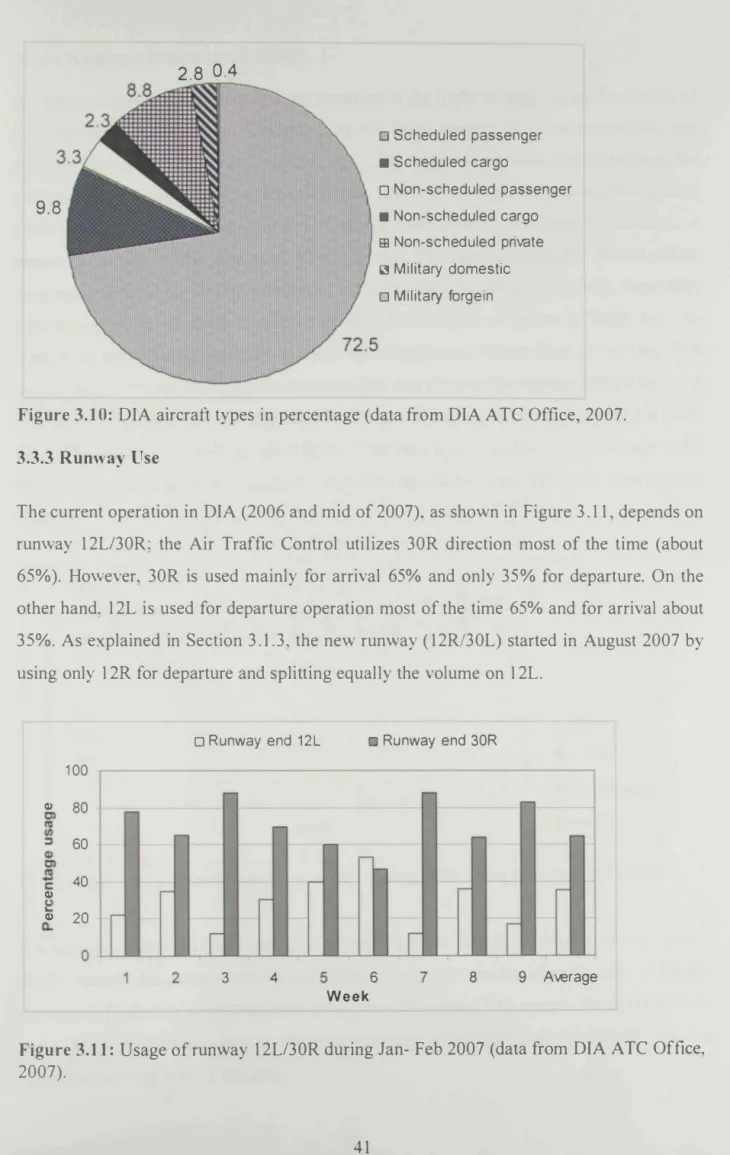
Figure 3.10 D IA aircraft types in percentage. . . . . . .. . . 4 1
Figu re 3.11 Usage of runway 1 2L130R during Jan- Feb 2007 . . . . . . . . . 4 1
Figu re 3.12 Daily aircraft movement at D IA during 2006 . . . , 42
Figure 3.13 Percentage of runway usage at D IA for the year 2006 and 2007 . . . 46
11
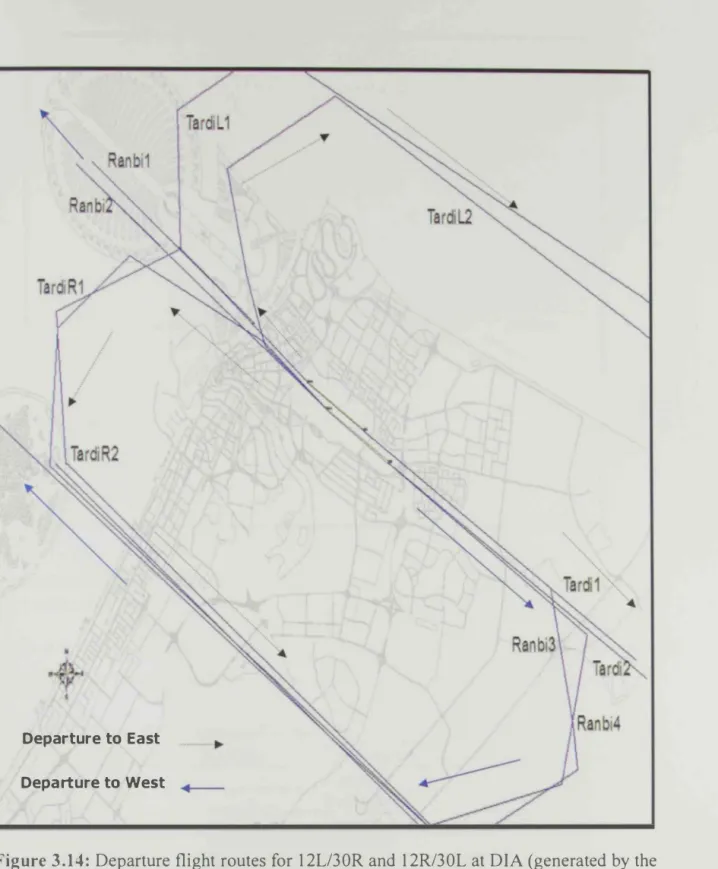
igur . 14 Departure flight route for 1 2L130R and 1 2RJ30L at DI . . . 48
Figure 3. 15 Arri al flight rout for 1 2L130R and 1 2RJ30L at D I . . ... . . 49
Figure 3. 16 27 u ed in noise asse ment of the surrounding communities (right) and the acou tic calibrator C74 (left) . . . .. . 54
Figure 3. 17 oi e measurement locations around D IA, Jan 200 8 . . . .. .. 55
Figure 4. 1 ois mea urement at runway end 1 2L (top) and 30R (bottom) . . . 57
Figure 4.2 Hypothetical locations of the arrival and departure points . . . '" 59
Figu re 4.3 Impact of different percentage of departure and arrival on the noise Ie el at the runway end points . . . 60
Figure 4.4 Impact of different percentage of departure and arrival on the noise Ie el at community locations in the vicinity of DIA . . . .. . 6 1
Figure 4.5 Changes of LAeq and LAmax in the vicinity of DIA as a function of aircraft movement during the noise measurement period . . . 65
Figu re 4.6
Figure 4.7
Figure 4.8
Figure 4.9
Noise level at normal (top) and busy (bottom) operations at DIA, 2 1 st Jan 200 8 . . . . . . . . . .. . 66
Simulation of current noise level (dBA) using runway 1 2L130R (Case 1 ) in the vicinity of D IA. Top figure is for LAeq and bottom is for LAmax. . . . .. . . 68
imulation of the LAeq (dBA) under different percent usage of the runway, using one runway 1 2RJ30L (top) and two runways (bottom). . . .. . . 69 LAeq contours under (a) current (b) 20 1 0 and (c) 20 1 5 flight conditions (Case 1 ). . . 7 1
Figure 4.10 Noise level in the vicinity of DIA using one runway 1 2L130R. . . 76
Figu re 4.11 LAeq at DIA as a result of switching the runway end points of the departure and arrival. Using 1 2L 1 00%D, 30L 1 00%A - Case 1 2 (top) and 1 2R 1 00% D , 30R 1 00% A- Case 1 3 (bottom) . . . 78
Figure 5.1 Age of the survey respondents. . . 82
igure 5.2 Figure 5.3
Figure 5,4
Figure 5.5
Figure 5.6
Figure 5.7
Figu re 5.8 Figure 5.9
umber of years respondents Ii ed in the urveyed area . . . .. 83 Health a p cts of the respondents. Percent acquired di eases (top, percent under medication (middle), and percent using hearing aids (botton1). . . 84 Percentage of noi e annoyed respondents . . . 85
Percentage of re pondents annoyed from aircraft noise as per the urvey area, (top) along with the a sociated annoyance level (bottom) . . . 87 Di tribution of annoyance from aircraft noise during the day as per the survey area. . . .. . . 88
leep disturbance level due to aircraft noise as per the survey area (top) and distribution of sleep disturbance during the day as per the survey area (bottom) . . . 89
Effect of aircraft noise on reading and communication. . . 90 Effect of aircraft noise on watching TV (top) and time of the effect during the day (bottom) . . . 9 1
Figure 5.10 Effect of aircraft noise on daily and social activities (top) and time of the effect on the daily activities (bottom). . . . . . . .. . . . . . . . . . . . . . . . .. .. 92
Figu re 5.11 Percent respondents indicating other effects of aircraft noise on their daily activities. . . . . . . . . . . . . . . . . . . . . . . . . . . 93
Figure 5.12 Relationship between predicted noise level and reported annoyance . . . . . . 94
Figure B1 Jeppesen map for arrival (STAR), 1 2L/ 1 2R . . . 1 1 1
Figure B2 Jeppesen map for arrival (STAR), 30L/30R. . . . . . 1 1 2
Figure B3 Jeppesen map for departure (SI D), 1 2L/ 1 2R . . . 1 1 3
Figu re B4 Jeppesen map for departure (SID), 30L/30R. . . 1 1 4
Figure D1 S imulated LAeq under (a) current, (b) 20 1 0, and (c) 2 0 1 5 (c) using
runway 1 2RJ30L, Case 2 . . . 1 1 7
Figu rer D2 Simulated LAeq under (a) current, (b) 201 0, and (c) 20 1 5 (c) using
runway 1 2RJ30L, Case 3 . . . .. . 1 1 7
Figure E1 Progress in aircraft noise reduction. . . . . . . . . . . . . . . . . . . . 1 1 9
XIV
BBR EV I T I O
'EF u tralian oi e Exposure Forecast
P uxiliary Power nit
T irport Traffic Control
T ir Traffic ervice
AEP Committee on viation En ironmental Protection
EP I 0' ommittee on A iation Environment Protection.
EO hief Ex cuti e Officer
D Dubai i il iation Authority DI Directi ity Index
D I Dubai International Airport
DM Dubai Municipality
EC European Commission
EP Effective Perceived Noise Level
EP Environment Protection & Safety Section FAA Federal Aviation Administration
GI Geographic Infonnation System
ICAO International Civil Aviation Organization IFR I nstrument Flight Rule
INM Integrated Noise Model
MAGENTA Model for Assessing the Global Exposure to the Noise of Transport Aircraft
NEF NIOSH OSHA SEL SID STAR TC WHO
Noise Exposure Forecast
National Institute of Occupational Safety and Health Occupational Safety and Health Administration Sound exposure level for A-weighted
Standard Instrument Departure Standard Instrument Arrival Tone Correction parameter World Health Organization
YMBOL
't Period
Iv \i ave length Arri al e2
3 e4
e5
Ae6 D dB f Hz I
kmIhr
knots LAm ax Ldn LEP Leq Lp
�\
m mbar mm-Hg
°c
P r T
p
ttenuation b adsorption in air due to humidity Attenuation due to rain, snow and fog
ttenuation due to barriers
Att nuation due to grass and trees
ttenuation due to wind and temperature gradients Departure
Decibel. noise unit Frequency
Hertz
Intensit of sound
kilometer per hour, speed unit Wind peed unit
Maximum noise level
Da -night average sound level effective perceived noise level Equivalent steady sound level
ound pressure level Sound power at the source meter
milli bar, pressure unit
millimeter mercury, pressure unit Degree Celsius
Individual pressures Distance
Temperature Density
XVl
1 . 1 0 RVIEW
HAPT E RI I TROD CT I O
The aviation indu try in the UAE has e perienced rapid expansion over the past decade due to an increa e in economic growth and technological advancements. The UAE s total fi cal in estment on airport de elopment 0 er the coming 20 years is estimated to exceed Dh7 1 billion (U 1 9.35 billion). This figure includes Dh25 billion for redevelopment of Abu Dhabi International Airport (ADlA) Dh 1 5 billion being spent on the expansion of Dubai International Airport (DlA) and Dh30 billion estimated for the development of the new Jebel Ali International Airport (JAlA), the DAE's seventh airport (DAE at a Glance 2006).
DlA was established in 1 959 by the order of HH Sheikh Rashid bin Saeed Al Maktourn. It is located 4 km away from the centre of the city of Dubai, keeping in mind the future expected expansion as of today. The initial airfield consisted of a 1 ,800-m compacted runway, an apron area, a small but adequate terminal building and a fire station (About D IA, 2006). Today, DIA is one of the fastest growing airports in the world, and it became the hub of the Middle East by being at the threshold of the top 1 0 airports. The government of Dubai has set a major expansion plan costing almost DS$ 4. 1 billions for DlA and its affiliated divisions in order to turn DIA to be the most user-friendly and efficient airport and to maintain the position of the Emirates as the aviation and business hub of the region (New Project 2006).
Since 1 992 the growth rate of incoming aircraft at DIA has been exponential, and the airport capacity has doubled between 1 980 and 200 1 . Aircraft movement is further expected to increase in the next 20 years with the already constructed new terminal. Figure 1 . 1 shows the growth of aircraft movement at DIA from 1 996 unti l 2008. This increase is not without its complications on the surroundings; one of which is aircraft noise. In fact, aircraft noise is considered the single major environmental problem associated with aviation operations. Although such a problem does not produce visible effects, many
tudie how that n01 hann human h alth and decrea e quality of life. In thi connection, irport ouncil International recently tated .. the e treme difficulty encountered in the con truction of ne\\ airport , the expan ion of exi ting airport and the cheduling of aircraft operation . e pecially at night. i primaril, the re ult of community oppo ition to aircraft noi e at many airport ".
250000
en 200000
... s::
Q) E 150000
>
:!E 0 100000
... C'O
0 50000
�
0
1996 1998 2000 2002 2004 2006 2008 Year
Figure 1.1: ircraft movement at DIA (data from Airport Traffic Control (A TC), DIA, _007).
\Vhile the negative impacts of noise re ulting from airport operations are known and do umented globall , there is no systematic tudy and research that has been done to noi e expo ure levels and related/associated impacts in the vicinity of major airports
\\ithin the UAE. In the absence of such, it becomes apparently difficult to predict the variations and changes in airport operations and aircraft noise which occur from year to year and to forecast the likely environmental effects of proposed future changes in aircraft and airport operations, and further to control de elopment within the vicinity of airports.
Therefore. detailed studies of aircraft noise level at major airports in the country are greatly needed. This study is thus planned to investigate and assess noise levels resulting from aircraft traffic at DIA with considerations of anticipated future expansion.
2
1.2 BJ TIVE
The pecific objective of thi stud were:
1 . es the nois e posure Ie el , contour the noise profile" ithin the surroundings of DIA, and depict long-t rm future noise exposure.
2. es the impact of aircraft noi e from Dr on the surrounding communities by conducting an individual noi e survey.
3 . Develop guidan e and mitigation mea ures for minimizing the impact of aircraft noi e in the vicinity of DI .
1.3 APPROACH
To achie e the tated obj ectives, the major tasks that were w1dertaken are outlined below:
1.3.1 Literature Review
This task includes re iew of noise impact, legislative laws, previous studies conducted to as ess noise levels at other airports, and local efforts pertinent to the study. The literature re iew also includes a background of available noise measuring devices.
1.3.2 DatalInformation Collection
The study describes the baseline information of DIA and its relationship to the surrounding communities, which could be used in later stages as a basis of noise compatibility planning process. It comprises:
a) A description of the setting, local climate, and historical perspective of the airport.
b) A description of airspace and air traffic control.
c) A description of fleet mix.
d) A description of existing land uses in the study area.
Three types of data were collected for the study:
1 . Noise level measurement. A set of acoustical instrun1entation were placed at the end of each runway at DIA to determine aircraft noise from the source. Noise data
were col lected for 24-ru a day over a period of at least 1 week. In addition, community noi e levels were determined at several locations surrounding the airport.
2. Input data for the elected modelling software including airport and tudy area de cription. activity data, fleet mix, database selection, time-of-day, runway use, flight profile , flight tracks, and assignment of aircraft to flight tracks. Data pertinent to aircraft traffic were collected for the same period noise data were collected for.
3. urvey wa carried out for residents of areas surrounding the airport in order to identify public perception on noise due to aircraft movement at DIA.
1.3.3 l\1odelling
The Integrated Noi e Model (INM) was used in this study. The INM model utilizes flight track information aircraft fleet mix, standard and user defined aircraft profiles and terrain as inputs. The INM model produces noise exposure contours. The program includes built in tools for comparing contours and utilities that facilitate easy export to commercial Geographic Information Systems. The model also calculates predicted noise at specified site . Inputs to the INM wil l include runway configuration, flight track locations, aircraft fleet mix stage length (trip length) for departures, and numbers of daytime and night time operations by aircraft type. The INM computes typical flight profiles for aircraft operating at the assumed airport location, based upon the field elevation and lapse rate temperature.
The modelling exerCIse included simulation of noise levels under current air traffic conditions and simulation of noise levels for future conditions (considering airport expansion). Additional simulation efforts were conducted subject to mitigation scenarios.
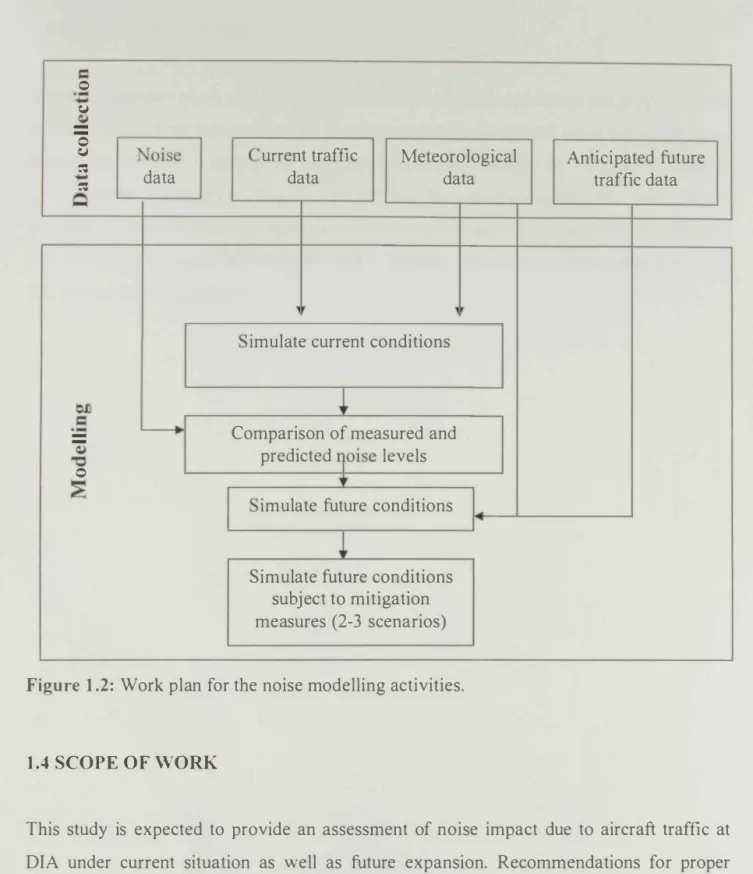
A schematic diagram of the work plan undertaken to complete the study is demonstrated in Figure 1 .2.
4
c: 0
.-�
(.J (.J
- -0
(.J
[;J
urrent traffic Meteorological Anticipated future� � � data data data traffic data
Q
imulate current conditions
OJ)
�
c: �
.- Comparison of measured and
--
(.J predicted
�
oise levels'0 0 ..
�
imulate future conditions�
ISimulate future conditions subject to mitigation measures (2-3 scenarios)
Figure 1.2: Work plan for the noise modelling activities.
1.4 SCOPE OF WORK
This study is expected to provide an assessment of noise impact due to aircraft traffic at DIA under current situation as well as future expansion. Recommendations for proper noise management with potential mitigations measures were provided at the end of the study. Overall, this study is expected to provide guidance to professionals i n the field and decision makers to evaluate the adequacy of Dubai's existing noise regulation to formulate new policy and prevent further deteriorations of the environment near "hot spots areas".
1. 5 THE I TR T RE
The thesi of i chapt r . This chapter de cribe the objecti e and scope of work of the tudy. hapter tv.·o re iews the literature pertaining to aircraft noise and its impacts.
Factor that affect and control the noi e level were al 0 explored in this chapter. hapter three provide information related to the site and the surrounding land use. This chapter al 0 d crib the data and method used for noise simulation. The results of this study are pre ented and di cu ed in Chapter 4 and 5. Finally, Chapter 6 concludes this work and set orne recommendations.
6
H P T E R2
LITE RAT R E REVI EW
Thi chapter include revIew of the nOIse impact, legi lati e laws, prevIOus studies conducted to a sess noise Ie els at other airports, and local effort pertinent to the study.
The chapt r tarts "vith orne definition and terminologies used in the area of noise pollution including the principles of noi e measuring de ices.
2.1 DEFI ITION D TERMINOLOGY 2.1.1 Definition of oi e
The word noi e comes from the Latin word nausea meaning seasickness (Noise Pollution, 2006). Physically, th re is no distinction between sound and noise. Sound is a sensory perception and the comple pattern of sound waves is labelled noise, music, speech, etc.
oise is thus defined as unwanted sound (Berglund et aI, 1 995). In general, noise can be defined as unwanted human sound created by different sources and impact the quality of our environment and life. The main sources of noise are transportations, specifically motor vehicle aircraft noise and rail. Also, there are other sources such as: factories, amplified music, air conditioners and construction work. The regulation of noise has been started in U. in 1 972 under the Federal Noise Control Act (Noise Pollution, 2006).
Aircraft noise is defined by the Wikipedia as sound produced by any aircraft on run-up taxiing, take off, over flying or landing. Aircraft noise is a significant concern for approximately 1 00 square kilometers surrounding most major airports. It is a major source of noise after that caused by road traffic. Take off itself can produce a noise level more than 1 00 dBA while the airplane i s still on the ground. Also, aircraft landing in cities results in a noise level above 1 00 dBA, as landing typically occurs with lower than 60 m above roof level (Aircraft Noise, 2006).
2.1.2 Fundamentals of Noise
Sound waves cause alternating pressure changes (compaction and refraction) which are then detected by the human ear. Such sinusoidal behaviour is characterized by a period ('t) and a wave length
(A):
'f =-1
f
}. = c
f
(2. 1 )
(2.2)
\\ here, f is th frequenc and c i the sound velocity which can be estimated at 1 0 1 .3 kPa u ing c = 20.05 T; \ here c i in m1s and T is temperature in oK.
The average ound pre sure 0 er time is commonly expressed in terms of the root-mean
quar (P mls) of the indi idual pressure (P):
The inten it of sound (1) is expressed as 1=
P!ms
pc
where p is air density.
The sound pre sure level is gi en as:
p2
L P = 1 0 log � p2 ; Po=20 j.lPa
o
From the above equation we have (Davis and Cornwell, 1 99 1 ) :
2.1.3 Noi e Metrics
(2.3)
(2.4)
(2.5)
(2.6)
In general, the sound exposure is determined with reference to a wei ghting network. There are three weighting networks : A, B, and C. In the A-weighted very low frequencies are filtered severely, but hardly filtered in the C-weighted metric. The following metrics are typically used for expression of noise level :
A. Sound exposure level for A-weighted (SEL) = LAE
8
B. Equivalent stead sound I el (Leq):
(2.7 (2.8)
F r continuou ound event with duration of t each over a period of T
L,q � 10 10g
U �
)Ol"" I)
L,q � 10 IOg
(
_1t
lOL"II')
(2.9) (2.10)
For separate sound e ents like the case with several aircraft at different times within a time period T:
c. Day-night average sound level (Ldn):
L tin = 10 10 g 86 400
(
, 1�
LJ I 1 O(LA,+W)IJO)
(2.11)
(2.12)
where, 86,400 corresponds to the number of seconds in 24 hrs and W is denoted the weight factor which is taken as 0 for noise events between 7 am-I 0 pm and 10 dB for noise events between 10 pm-7 am.
D. Perceived noise level:
Typically, the perceived noise level is 13 dB higher than the Sound Exposure Level (SEL).
The effective perceived noise level (LEPN) is determined from individual perceived noise
level with the incorporation of a tone correction parameter (T ) that ranges between 0-6 dB.
\vith To =10 ec and t=0.5 sec.
E. 01 e e po ure foreca t:
(2.13)
The noi exposure foreca t (NEF) is defined as (Horonjeff and McKelvey 1994):
2.1A oi e Mea urements
(2.14)
All noi e measures consider the frequency content of the sOUfids the overall sound pre sure Ie els and the variation of these levels with time. SOUfid pressure is a basic measure of the ibrations of air that make up sOUfid. The levels of sOUfid pressure are measured on a logarithmic scale due to the wide range of sOUfid pressures that humans can detect. Thus, sOUfid pressure can not be added or averaged arithmetically (BerglUfid et aI., 1995).
As defined by BerglUfid et a1. (1995), sOUfid is 'the number of vibrations per second of the air in which the sOUfid is propagating '. SOUfid is measured in Hertz (Hz), and varies from 20 to 20,000 Hz for UfIpaired younger's hearing. The sensitivity of human ear to noise varies widely, thus various types of filters or frequency weighting have been used to determine the relative strengths of frequency component making up noise. The most used one is the A-weighted because it detects low frequencies which are considered more important than the middle and high (B and C- weighted) frequencies. Moreover, the A
weighted frequency is intended to approximate the frequency of a human hearing system (BerglUfid et aI., 1995).
10
T, pically the LAeq T i u ed to mea ure continuous ounds. The LAeq,T i defined as the energy average equivalent Ie el of the -weighted sound over a period T. The use of L,o\.max,T and the ound expo ure Ie el ( EL) will be more sufficient for individual event a they are good indicator of leep disturbance and other acti ities be ide other practical advantage uch a , economy and the benefits of a standardized approach (Berglund et aL 1995).
2.1.5 oi e Mea uring Device
The mo t important component of a sound pressure meter is the microphone which can be produced with different de ired sensitivity and frequency response characteristics. The quality of the microphone i an important factor to detect the required frequencies level, with lower quality microphones are limited to survey type measurements of overall A
weighted measurements. Most sound pressure devices also are provided with both A- and C-weighted response curves. Also most meters include fast (0.125 s) and slow ( 1 s) re ponse times.
ccording to the IEC (1979) standards the pressure meters are classified as type 1 and type 2. Type 1 sound meters are expensive and commonly used where more precise results are needed. In contrast, type 2 meters are used for broad band A-weighted measurements where very high precision in not needed and where very low sound pressure levels are not to be measured. Nonetheless all modem sound pressure meters integrate the sound pressure for a period of time, leading to an accurate LAeq, T measurements (Berglund et al.
1995).
2.2 AIRCRAFT NOISE
2.2.1 Mechanisms of Sound Production
The pressure wave which is produced by the movement of different aircraft types Get and propeller engine) can produce a sensation of hearing if it is strong enough. Aircraft noise can be produced by different sources:
1. Aerodynamic noise
2. Engine and other mechanical noise 3. Noise from aircraft systems
erodynamic noi e can be defined as the airflovv' around the aircraft fuselage and control surface \\ hich increase with the increa e of aircraft speed and at 10\ altitudes. Low flying military aircraft with high peed produces an intense aerodynamic noise \ hich should be controlled over residential areas. High exposure to such noise may re ult in hearing damage. It hould b noted that the shape of nose, \ indshields or canopy of an aircraft play a major role in producing sound.
Engine nOIse can be found more in propeller aircraft. The helicopter nOIse can be con ider d a unique pectral content produced mainly from the main and tail rotors and from the main gearbox.
Different aircraft systems such as, cockpit, cabin pressurisation and conditioning systems produce different noise level for both civilian and military aircraft. One of the nosiest y tern for jet aircraft is the Auxiliary Power Unit (APU) which is used to start the main engines, to provide electrical power on ground. The noise produced by an APU could reach
1 1 3 dBA (Aircraft Noise, 2006).
2.2.2 Noise Transfer and Attenuation
The sound level away from the source will be reduced due to wave divergence according to the following equation:
Lp = Lw -20 log r - 1 1 (2.1 5)
where, Lp is the sound level at a distance r from the source, Lw is the sound power at the source. Note that the derivation of the above equation comes from the fact that 1= W I( 4m2).
If the sound level is not known at the source but known at a point (PI ), then the sound level at a different point (P2) can be calculated as:
(2.1 6)
There are several factors then need to be considered that could affect the noise level at a point including:
1 2
a. Directi ity index which is a measure of the directivity of a sound ource in a logarithmic [onn.
b. Effects of difference in air density (p) and sound velocity (c) due to change III
temperature, denoted as e l . This is usually determined as:
Ae1 = 1 0 10g -pc (2. 1 7)
400
c. ttenuation by ad orption in air due to hwnidity (Ae2).
d. ttenuation due to rain now and fog (Ae3).
e. Attenuation due to barriers (Ae4), which ranges between 0-30 dB.
Meloni and Fischer (2000) carried a field study to investigate 13 different types of noise barrier . They found that the acoustic effectiveness of noise barriers is mainly responsible for the reduction of annoyance as it can reduce the noise level to by 5 dBA.
f. Attenuation due to grass and trees (Aes), which ranges between 0-30 dB.
Vegetation with high density also can attenuate the noise level, thus for example com crop has an excess attenuation of 6 dBAJI 00ft. Also, hemlock, pine and brush can reduce noise by 5 dBAJI 00ft. The maximwn attenuation depends mainly on the soil permeability to air.
cattering and ground attenuation is considered to be the main principle factors for noise attenuation (Aylor, 1972).
g. Attenuation due to wind and temperature gradients (Ae6).
Thus, the above equation can be written with consideration of the above environmental conditions as:
L p I = Lp2 -20 log r2 - 1 1 + DI -
(2: Ae, i)
r. I
(2.18)
Note that some of the Ae,1 values could be positive or negative (Davis and Cornwell, 1991).
2.3 EFF T O F IRCRA FT 01 E 2.3. 1 Overvie\
ivil a"\ iation now a day i considered one of the greatest environmental concerns which lead to man different en ironmental problem . Therefore, the International Aviation rganization (I ), which has more than 190 memberships, and works with UN bodies, ha recently e tabli hed three main en ironmental goals as follows:
• Limit or reduce the number of people affected by significant aircraft noise;
• Limit or reduce the ad erse impact of aviation emissions on local air quality· and
• Limit or reduce the impact of aviation greenhouse gas emissions on the global climate.
The I 0 secretariat in its 2007 en ironmental report stated that: 'Aircraft noise is the most ignificant cause of adverse community reaction related to the operation and expan ion of airport both in developed and developing countries. This is expected to remain the ca e in most regions of the world for the foreseeable future. Reducing or limiting the effect of aircraft noise on people and the communities they live in is therefore one of ICAO's main priorities and one of the Organization's key environmental goals"
(ICAO, 2007). In a nutshell the environmental problems associated with aviation operations are summarized in Table 2.1. Since the scope of this study focuses on aircraft noise, an overview of the problem is given below.
Table 2.1: Environmental problems/impacts associated with operation of civil aviation, (Crayston, 1992; Morrissette, 19961
Problem Explanation
Air pollution near the • The aircraft engine emission
airport • Emission from the airport motor
• Emission from the other airport sources
G lobal emission • Long-range air pollution (i.e., acid rain)
• Greenhouse effect
• Depletion of ozone layer
Aircraft noise • Noise in the vicinity of the airports caused by the aircraft movements.
• Engine testing and other noise sources at the airport
• Noise caused by the aircraft en-route (not including sonic boom)
• sonic boom caused by supersonic aircraft
14
Aircraft incidenlJaccidents • Accident or incidents involving the passenger death, injury and damaging of dangerous goods carried as cargo
• Other environmental problems that may raise from aircraft
accidents.
• Emergency procedures in olving fuel dumping
Congestion and delays • A irport and en-route congestion and delays Airporv Infrastructure • Loss of land
construction • oil erosion
• Impact on water tables, river sources and field drainage.
• Impact on flora and fauna
Water Soil pollution near • Water pollution caused by inadequate treatment of contaminants
airports in the airport waste water
• Water and soil pollution cased by leakage from storage tanks
A irport waste management • Disposal of environmentally harmful materials used in the aircraft servicing and maintenance
• Disposal of waste from the airport and incoming aircraft.
As mentioned earlier , aircraft noise is one of the main environmental problems threaten the e pansion of airports, As such, Airports Council International, an international body representing airports worldwide, recently concluded that "Aircraft noise can be very disruptive to the lives of those who live close to airports. The effects are not uniform around the world and can be influenced by the type of aircraft that operate at an airport, the location and type of housing under a flight path, the hours that an airport operates and the number of flights. As airport operations continue to grow their impact on the community may also grow" (Noise, 2007).
Horonjeff and McKelvey (1 994) indicated that the way people perceive the noisiness of a sound is dependent on several factors. These factors include the sound level, the varying sensitivity of the ear to different frequencies, the frequency of aircraft noise intrusions, the time of these intrusions within a day, and the number of intrusions within a period of time.
Consequently, several metrics of noise have been developed in the last years.
Quantifying aircraft noise is almost difficult. Nonetheless, many tools and models have been developed for such purpose such as MAGENTA. MAGENTA is a Model for Assessing the Global Exposure to the Noise of Transport Aircraft. It is a computer based model that is used to simulate the number of people who are exposed to significant aircraft
n01 e. � GE T A was de eloped by the Committee on viation Environmental Protection ( EP) under the IC 0, and its computational core is the Integrated Olse ModeJ- INM (M GE TA 2006).
orne people belie e that noise does not pose a serious health impact. uch perception is due to the fact that noise often does not produce visible effects and because there is not u ually a distinct cau e-and-effect relationship between noise and health effects. A study conducted by ftandilian (1999) showed that noise harms human health and decreases the quality of life.
The American Academy of Paediatrics has released a report in October of 1997 stating that
"(1) exposure to exces ive noise during pregnancy may result in high-frequency hearing 10 s in newborns, and may be associated with premature and intrauterine growth retardation, (2) exposure to noise in the neonatal intensive care unit (NICU) may result in cochlear (inner ear) damage, and (3) exposure to noise and other environmental factors in the NICU may disrupt the normal growth and development of premature infants" (A Hazard for the Fetus and Newborn 1997).
Evans of Cornell University and his co-workers in 1995 found that "chronic exposure to aircraft noise in elementary school children can raise blood pressure and stress levels and cause defects in reading abilities and long-term memory". Other studies showed that children exposed to noise from elevated trains and highways at school also perform worse on starldardized reading tests than do students at the same schools in quieter classrooms (Aftandilian 1999).
Bronzaft et al. ( 1998) conducted a nOIse survey and found that nearly 70 percent of respondents to a questionnaire especially who live inline with flight paths of a major airport were bothered by the noise. Also, "subjects who were bothered by aircraft noise were more likely to complain of sleep difficulties and more likely to perceive themselves to be in poorer health." Other studies conducted by Bronzaft have linked noise to industrial accidents, sleep loss, decreased ability to concentrate, and gastrointestinal problems.
Staudacher of Vancouver's Right to Quiet Society says "By arIy starIdard of health, from infarIt mortality to life expectarIcy, statistics will show that people are healthier in quiet
16
areas than in nois ones (all else being equal). The reason I believe, is that noise destroys the en e of public peace and tranquillity that nourishe healthy social interaction"
( ftandilian, 1999).
2.3.2 Effect of oi e on Hu man Health
It i recognized recently that noise can cause and lead to a serious health impact. As a matter of fact, about 120 million of people worldwide have disabling hearing difficulties.
In Europe, one-third of the citizen are experiencing sleep disturbance as they live because of a noi y urroundings. In 1990, 30 million people in the U A were exposed to more than 85 dB on a dail basis due to occupational noise exposure. In Germany and other de"\'eloped countrie about 5 million are armoyed by noise of more than 85 dBA ( ccupational and Community, 2001).
Excessive exposure to noise can cause hypertension and ischemic heart disease. Noise can also adver ely affect performance in reading, attentiveness, problem solving and memory.
It was also found that noise above 80 dB may increase aggressive behavior (Occupational and Community, 2001 ).
Specifically, aircraft noise is responsible for a significant health effect on people; this can be classified into two categories: (1 ) auditory effects and (2) psychological! sociological effects. Auditory effects include hearing loss and speech interference. Psychological effects cover armoyance, sleep disturbance, performance effects and acoustical privacy (Davis and Cornwell, 1991).
It is recognized that exposure of high noise level can cause a heart diseases, blood pressure, immune deficiencies, neurodermatitis, asthma and other stress related diseases (Aircraft noise 2006).
2.3.2.1 Auditory
A. H earing Loss or H earing Impairment: This is typically defined as an increase in the threshold of hearing. Hearing deficits may be accompanied by tinnitus (ringing in the ears).
The impairment can occur in a high frequency range of 3,000-4,000 Hz. But with increasing LAeq as well as the exposure time, the impairment can occur at lower frequency
(i.e. 2,000 Hz). With lower than 75 dB of LAeq, 8ill hearing impairment is not expected to occur. The impairment of hearing is considered as irre ersible occupational hazard and as a fact it is estimated that the number of people worldwide having disabling hearing difficulties will reach 120 million according to WHO (Berglund et aI., 1995).
The ational Institute of Occupational Safety and Health (NIOSH) stated that workers exposure to the limit defined by line B (Figure 2.1) should be controlled, and a new insulation should be done for any limits below line A.
8 fi -1
- J
.§ z
2 �
� 1
- o n
� 0.6
c:: 0.4
0.:1
0.2
Lin!' .\
Formu lo: T = 1 6 'Z{L t\,), '
Range. flO to 1 1 :; dBA-Slow Li J '" J3
Form In. T _ Hi'Z{t M�\ � H,lJlge' 135 10 1 1 5 d l3 ... \-S low
130 /35 no 95 1 00 J 05 1 1 0 1 1 :1 Eflel" t i ve 'oise Lpv£' I L
(dOA-Slo\,,,)
Figure 2.1: NIOSH noise exposure limits for continuous or intermittent noise exposure (from Davis and Cornwell, 1991).
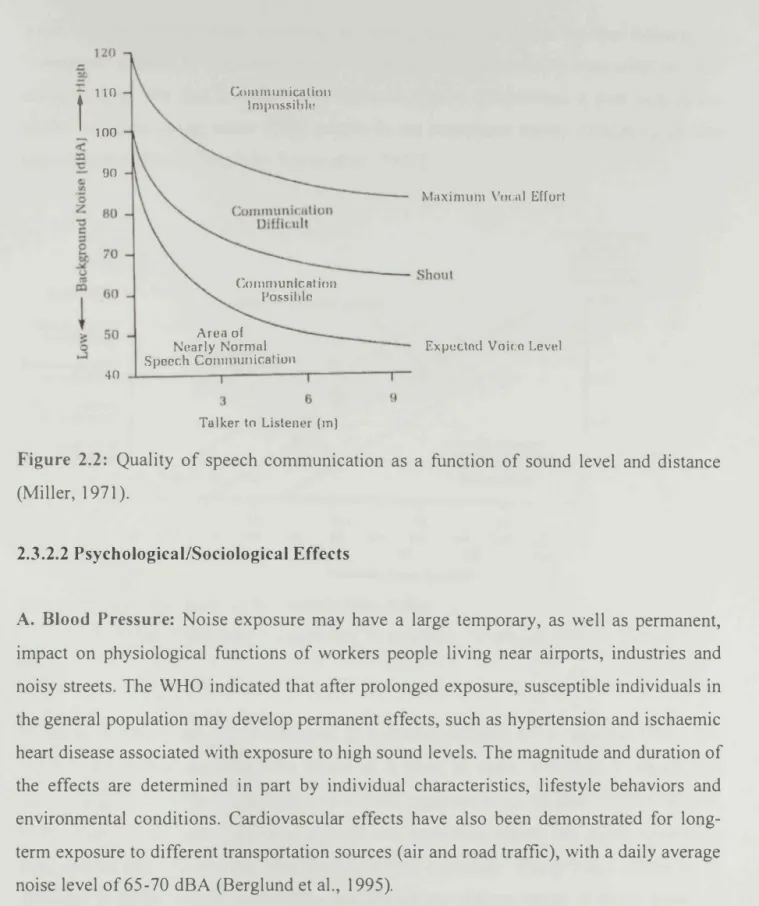
B. Speech Interference: this is an interference with communication between people. It is a complicated function of distance between the speaker and the listener, as well the frequency components of the spoken words (Davis and Cornwell, 1991) as shown in Figure 2.2. The WHO defmes speech interference as the inability to understand speech and results in a large number of personal handicaps and behavioral changes (Berglund et al., 1995).
18
1 20 - 1 1 0
t
1 00<
� -c:
Cl; 90
'"
z: 0 80
-::I c: ::l
�
0 u 70 '"CD
�
� (i0 50...:l 0
40
Co IH III u n ical loll I mpnssihlp
COll1n1unicat ion Possibln
Area of Near l y Norma l S pooch COIllIllUTl icat ioll
3 6
Ta l ker to Listener (m)
l\laxi m llIll Vocn l Effort
--- Shout
Ex pectod Volco I .evel
9
Figure 2.2: Quality of speech communication as a function of sound level and distance (Miller, 1971).
2.3.2.2 Psychological/Sociological Effects
A. Blood Pressure: Noise exposure may have a large temporary, as well as permanent, impact on physiological functions of workers people living near airports, industries and noisy streets. The WHO indicated that after prolonged exposure, susceptible individuals in the general population may develop permanent effects, such as hypertension and ischaernic heart disease associated with exposure to high sound levels. The magnitude and duration of the effects are determined in part by individual characteristics, lifestyle behaviors and environmental conditions. Cardiovascular effects have also been demonstrated for long
term exposure to different transportation sources (air and road traffic), with a daily average noise level of 65-70 dBA (Berglund et al., 1995).
B. Mental Illness: It is not yet justified if environmental noise could lead and cause mental illness directly. However, noise may accelerate and intensify the development of latent mental disorders (Berglund et aI., 1995).
C. Annoyance: It can be defmed as feelings of mild anger and impatience. Annoyance has a base in the unpleasant nature of some sounds, in activities disturbed or disrupted by