The statistical assessment of the data provides meaningful information about the deterioration and its effect on the structural elements. The assessment and the interpretation using statistical analysis and modeling of the structure together with design helps to understand the effect of deterioration on structural elements in semi-arid environmental conditions.
INTRODUCTION
- BACKGROUND
- RESEARCH SIGNIFICANCE
- RESEARCH OBJECTIVE
- RESEARCH METHODOLY
- RESEARCH GAP
- RESEARCH CHALLENGES
- DISSERTATION OUTLINE
There are several factors that lead to the deterioration of the concrete, which is caused by unfavorable climatic conditions. Furthermore, the research progresses to the analysis of the structure with the obtained data to understand the overall effect of deterioration on the structure.
CONSTITUENTS OF REINFORCED CEMENT CONCRETE
- EVOLUTION OF CONCRETE
- CEMENT
- TYPES OF CEMENT
- WATER
- AGGREGATES
- REINFORCEMENT
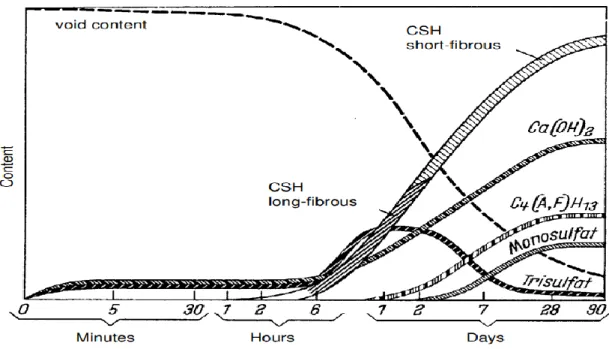
- MICRO COMPONENTS
Concrete is the second most used substance in the world after water (Crow & Mitchell 2008). In the case of reinforced cement concrete, steel reinforcements are also added to improve the tensile strength of concrete.
DETERIORATION OF REINFORCED CEMENT CONCRETE
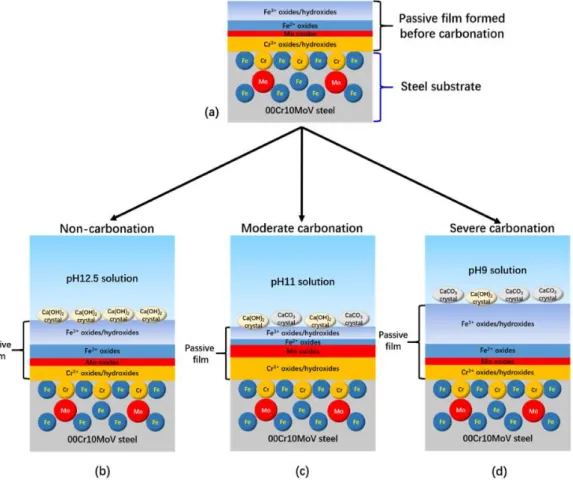
- CARBONATION
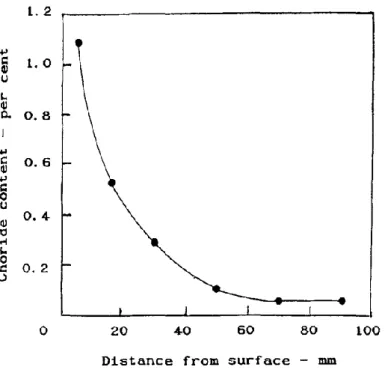
- CHLORIDE ATTACK
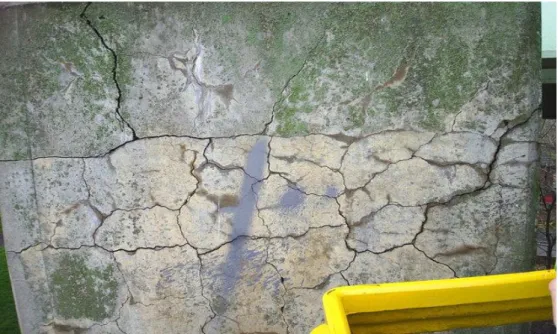
- ALKALI AGGREGATE REACTION
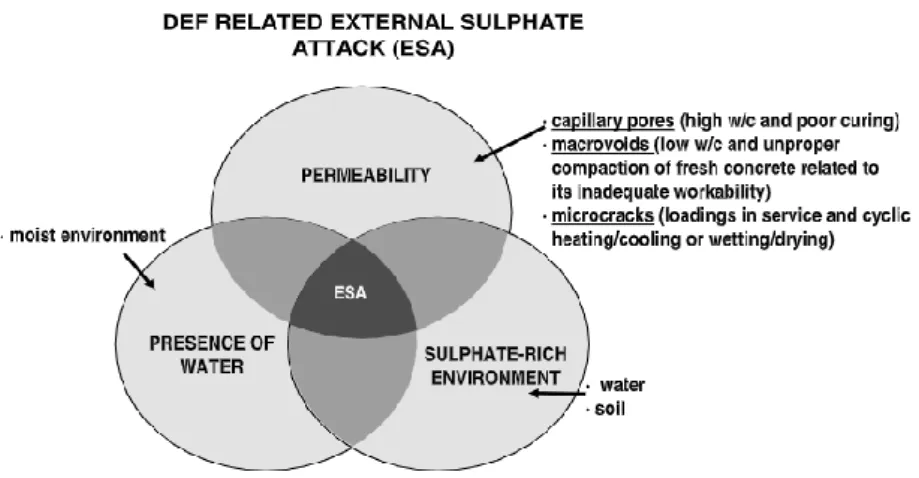
- SULPHATE ATTACK
- FREEZE –THAW
- ABRASION
- ADVERSE HEAT
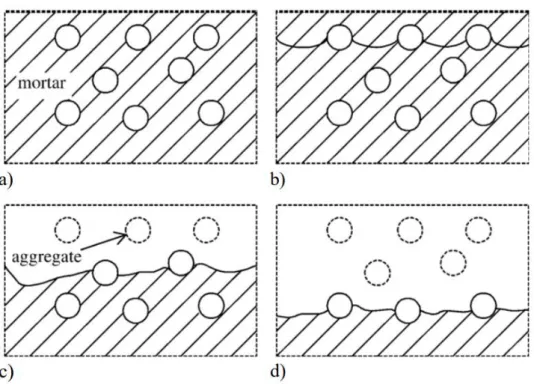
In (c), wear results in loss of mortar and coarse aggregate from the surface of concrete structures. The resistance of the concrete cover is reduced due to the vapor pressure created and the water loss caused.
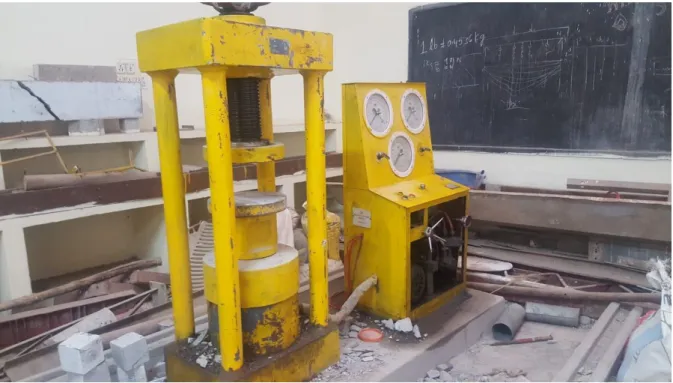
TESTING OF REINFORCED CEMENT CONCRETE
NON-DESTRUCTIVE TESTING
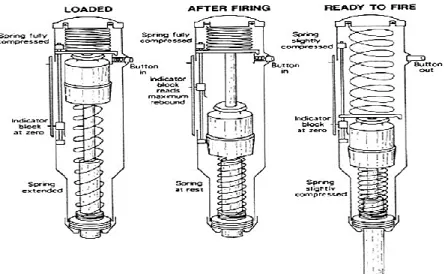
- PENETRATION METHODS
- SCHMIDT HARDNESS TEST
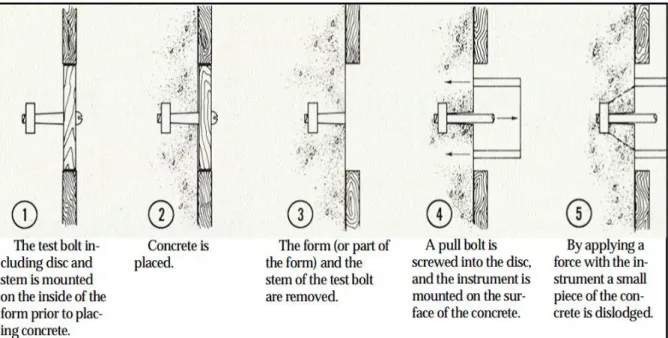
- PULL OUT TEST
- ULTRASONIC PULSE VELOCITY
- RADIOACTIVE METHODS
The penetration depth of the probes gives an idea of the compressive strength of the concrete using already established correlations. We can also get an idea of the density of concrete based on the speed we achieve.
DESTRUCTIVE TESTING
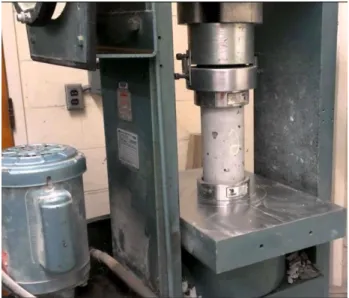
- COMPRESSIVE TEST
- SPLIT TENSILE TEST
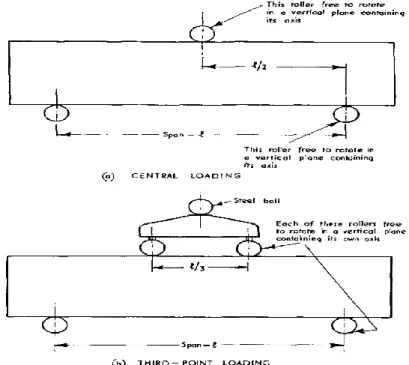
- FLEXURAL STRENGTH TEST
The maximum load applied to the specimen is noted and the appearance of the concrete in light of the type of failure must be observed. This load shall be given until failure occurs and the load shall be recorded along with the type of failure.
DATA ANALYSIS AND INTERPRETATION
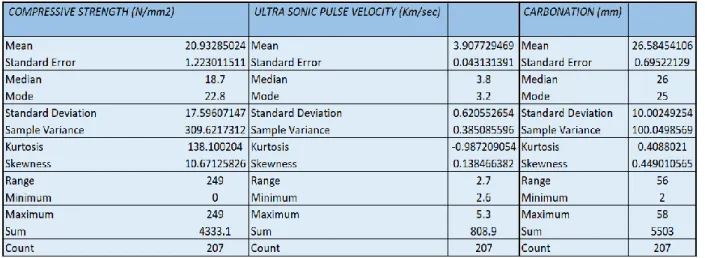
STATISTICAL ANALYSIS
Moreover, before the study, we can notice that the speed of the ultrasonic pulse of the concrete through the structural elements has less deviations from its average, which also reflects the good quality of the concrete. The average compressive strength is 18.7 N/mm2, most structural elements have a strength of 22.8 N/mm2.
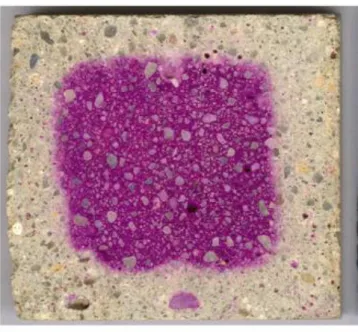
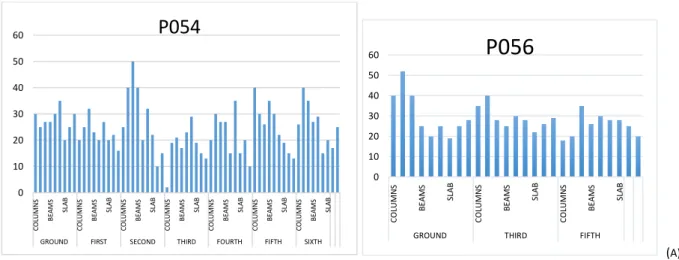
ANALYSIS OF CARBONATION
COLUMNS BEAMS SLAB COLUMNS BEAMS SLAB COLUMNS BEAMS SLAB COLUMNS BEAMS SLAB COLUMNS BEAMS FLAT COLUMNS BEAMS FLAT COLUMNS BEAMS FLAT. COLUMNS BEAMS SLAB COLUMNS BEAMS SLAB COLUMNS BEAMS SLAB COLUMNS BEAMS SLAB COLUMNS BEAMS SLAB COLUMNS BEAMS SLAB.
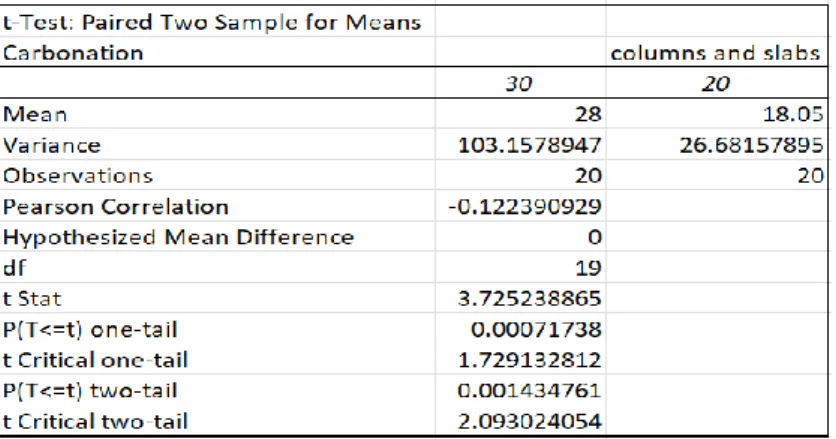
T - TEST
- PROJECT P054
- PROJECT P056
- PROJECT P068
- PROJECT P069
Ultrasonic pulse velocity t-test results for project P054 for columns &. Ultrasonic pulse velocity t-test results for project P056 for columns and. Ultrasonic pulse velocity t-test results for project P068 for columns &.
The results of the t-test for Ultrasonic pulse velocity for the project P068 for columns & slabs are shown in table 25. The results of the t-test for Ultrasonic pulse velocity for the project P069 for columns &.
ONE WAY ANOVA
- PROJECT P054
- PROJECT P056
- PROJECT P068
- PROJECT P069
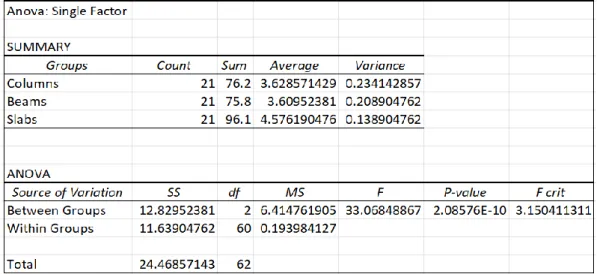
From Table 45 we can clearly observe that the p-value is less than the standard significant level and therefore the null hypothesis is rejected. From Table 48 we can clearly observe that the p-value is less than the standard significant level and therefore the null hypothesis is rejected. From Table 49, we can clearly observe that the p-value is less than the standard significant level.
From Table 51, we can clearly see that the p-value is less than the standard significant. From Table 54, we can clearly see that the p-value is lower than the standard significant level.
NORMAL DISTRIBUTION CURVE
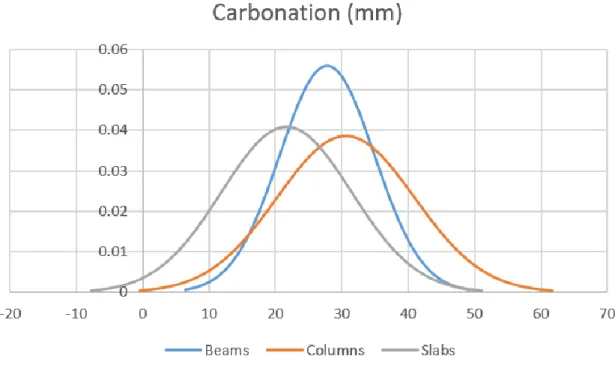
From the anova test, we can observe that the carbonation rate, post-deterioration compressive strength, and post-deterioration ultrasonic pulse velocity are not the same for columns, beams, and slab. Furthermore, the beams are the second most carbonated elements, the peak of the normal distribution with the highest frequency of 27.8 mm. From this we can understand that the columns tend to be more exposed to carbonation than beams and slabs.
So we can say that the beams and columns show similar effect after deterioration of the structure. It is observed from the normal distribution curve that for the highest probability frequency the slabs exhibit the maximum compressive strength of 25N/Sq.
CO-RELATIONS
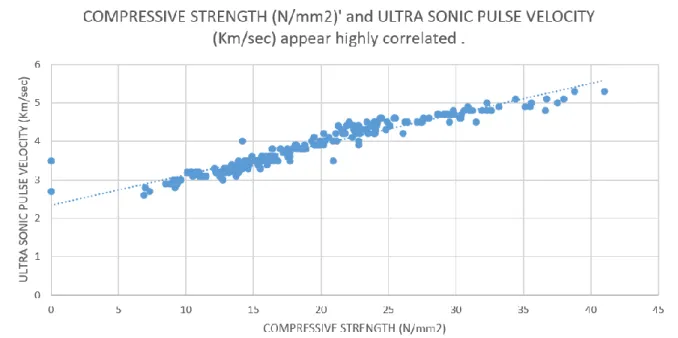
It can be observed that compressive strength and ultrasonic pulse velocity have a positive correlation with each other, while the other two pairs, viz. compressive strength - carbonization and ultrasonic pulse speed - carbonization have a negative correlation with each other. This shows that the relationship is proportional to each other, which means that with higher values of ultrasonic pulse speed, the compressive strength is higher. When observing the correlation graph between the speed of the ultrasonic pulse and the carbonization shown in Figure 27, we notice that the two parameters are inversely proportional to each other.
Further, by observing Figure 28, which shows the relationship between compressive strength and carbonation, it is observed that they are inversely proportional to each other. In some cases we can see that there are high compressive strength values for carbonation, these plots show the points in the initial carbonation stage where the strength of concrete increases due to the formation of calcium carbonate.
STRUCTURAL ANAYLSIS
MODELLING
- DATA ACQUISITION
- MATERIAL DEFINATION
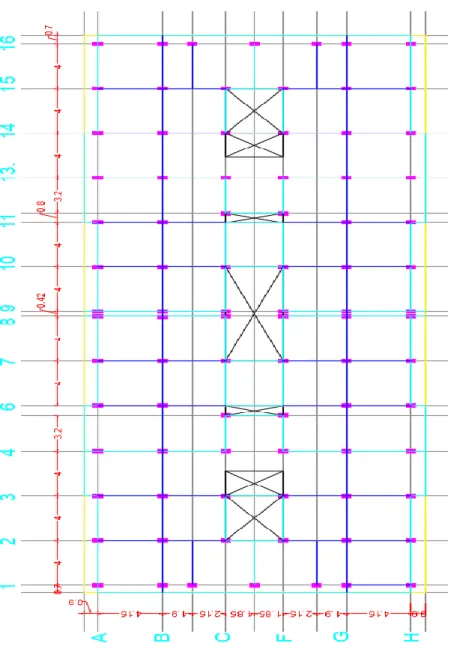
- STRUCTURE MODELLING
- LOAD APPLICATION
- MODAL ANALYSIS
- DESIGN FORCES
While from figure 51 it can be observed that there is a significant difference in the moments gained. It can be observed that there is no significant difference in the axial forces of both models. It is noted that there is a difference in the design strength values, although very small and may.
It has been observed that there is a difference in the design force values, although they are very small and can be considered negligible for axial forces. It is noted that there is very little difference in the design forces between the two models.
STRUCTURAL DESIGN ASSESMENT OF DETERIORATED COLUMNS
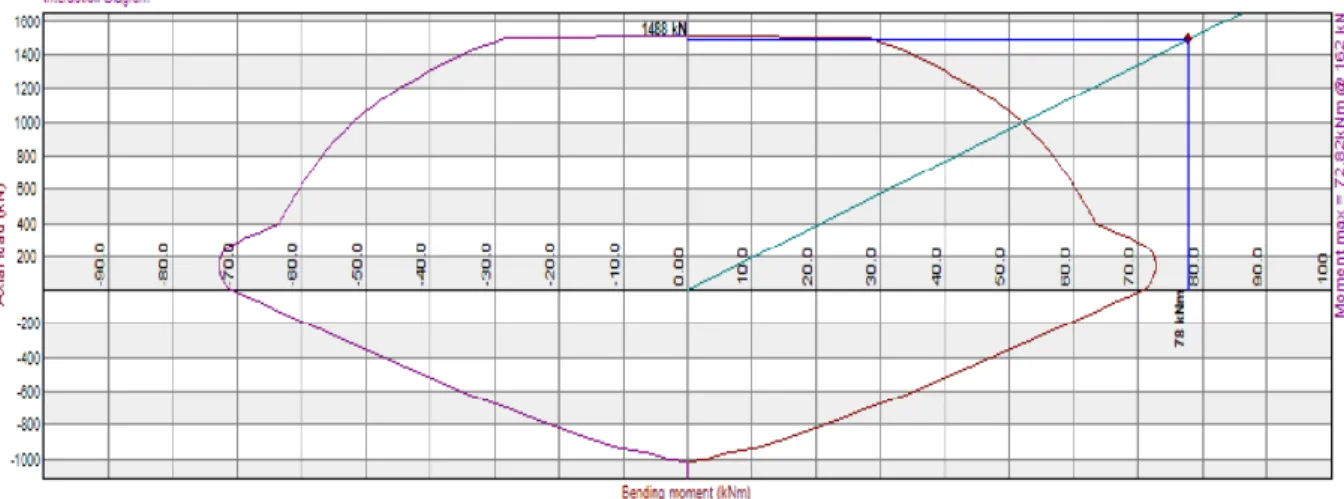
CORNER COLUMNS
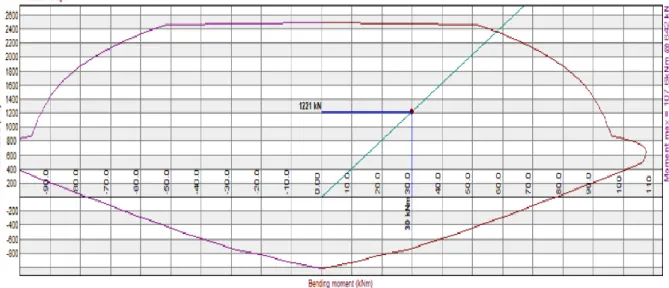
The figure 65 is an interaction diagram for corner column on ground floor for the compressive strength of 28 Mpa. The figure 67 is an interaction diagram for corner column on first floor for the compressive strength of 28 Mpa. Further in the interaction diagram for corner column on second floor for the compressive strength of 28 Mpa, it is observed that it has a maximum moment capacity of 107.5 KNm at 642 KN axial force.
Figure 70 is the interaction diagram for the angle column at the sixth floor for a compressive strength of 7.20Mpa. In the interaction diagram for the sixth floor corner column for a compressive strength of 28 Mpa, it is observed that it has a maximum moment capacity of 131 KNm at an axial force of 421 KN.
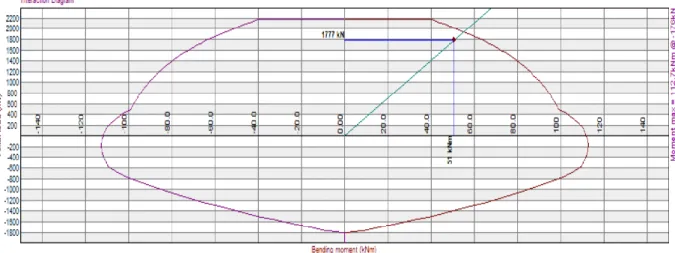
INTERMEDIATE COLUMNS
In the interaction diagram of intermediate column on the first floor for the compressive strength of 28 Mpa, it is observed that it has a maximum moment capacity of 329.3 KNm at 479 KN axial force. In the interaction diagram of second floor intermediate column for the compressive strength of 28 Mpa, it is observed that it has a maximum moment capacity of 536.8 KNm at 523 KN axial force. In the interaction diagram of intermediate column of fourth floor for the compressive strength of 28 Mpa, it is observed that it has a maximum moment capacity of 499.6 KNm at 767 KN axial force.
In the interaction diagram for intermediate column at Fifth floor for the compressive strength of 28 Mpa, it is observed that it has a maximum moment capacity of 375.5 KNm at 764 KN axial force. In the interaction diagram for intermediate column at Sixth floor for the compressive strength of 28 Mpa, it is observed that it has a maximum moment capacity of 424.1 KNm at 853 KN axial force.
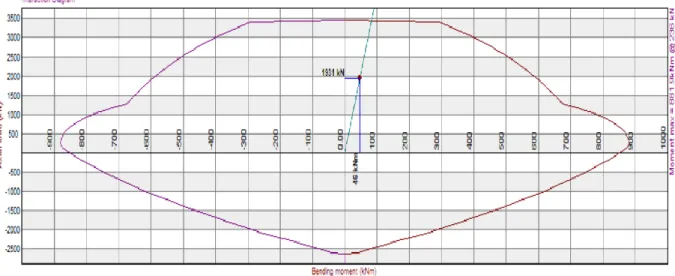
MIDDLE COLUMNS
Furthermore, in the interaction diagram for Middle Column on first floor for the compressive strength of 28 Mpa, it is observed that it has a maximum moment capacity of 292.1 KNm at 552 KN axial force. In the interaction diagram for Middle Column on second floor for the compressive strength of 28 Mpa, it is observed that it has a maximum moment capacity of 421.4 KNm at 598 KN axial force. In the interaction diagram for Middle Column at Fourth floor for the compressive strength of 28 Mpa, it is observed that it has a maximum moment capacity of 287 KNm at 610 KN axial force.
Furthermore, in the interaction diagram of Middle Column on 5th floor for the compressive strength of 28 Mpa, it is observed that it has a maximum moment capacity of 164.4 KNm at 436 KN axial force. In the interaction diagram for the sixth floor center column for the compressive strength of 28 Mpa, it is further observed that it has a maximum moment capacity of 237.9 KNm at 474 KN axial force.
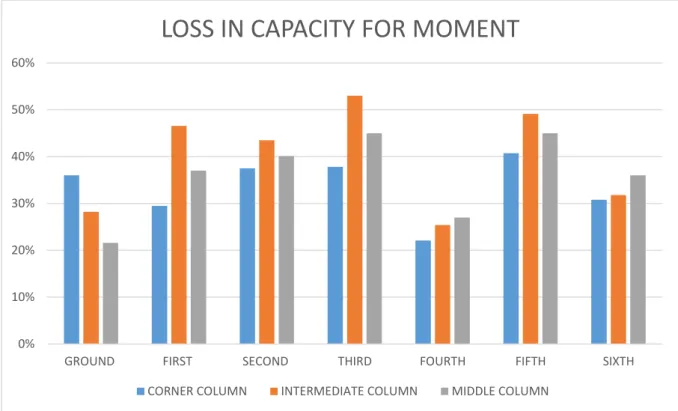
OVERALL COMPARISION
Furthermore, it can also be understood that for the same loss in compressive strengths it is not necessary to have the same loss in axial force capacity for different types of columns. The study also provides an overview of the loss of moment capacity for all the column categories simultaneously. On further observation of the graphs, we can deduce that the loss in moment capacity is different for all the different categories of columns.
It is also observed that the greater the loss of compressive strength, the greater the loss of moment capacity of the columns. Based on these observations, we can assume that the loss of axial force has a different impact for columns located at different locations in the structure, although the loss of compressive strength is proportional to the total loss intensity.
CONCLUSION
RESEARCH CONCLUSION
In the last part of the statistical analysis, a correlation was plotted to observe the effect of carbonation, ultrasonic pulse rate and compressive strength on each other. The structural analysis showed that the parameter change in the properties does not affect or cause a significant difference in the design forces obtained in the beams, although deterioration affects the columns slightly more than the beams. In the final stage of the study, the data obtained from the structural analysis and modeling is used to further study the capacity loss in the columns as it is the most affected structural element due to deterioration.
It has been found that the capacity loss of the columns not only depends on the rate of carbonation and compressive strength, but also depends on the position of the column in the structure. Capacity loss was observed highest in the corner column than in the intermediate column and least in the middle columns.
FUTURE SCOPE OF RESEARCH
Strength assessment of reinforced concrete structures through Ultrasonic Pulse Velocity and Schmidt Rebound Hammer tests.