Furthermore, the impact of banking concentration on economic growth is found to be dependent on country income, but not on corruption levels. This brings the issue of banking concentration and its impact on economic growth to the forefront of academic discussion. Having said that, this paper aims to remedy these issues through analysis of existing literature and contribution to this growing research field by exploring the impact of banking concentration on economic growth within OIC member countries.
The global trend of banking consolidation brought another critical dimension to this topic by exploring the relationship between banking concentration and economic growth. One of the rare studies that focuses on the causality between banking concentration and economic growth and covers some of the OIC countries in the sample is a study by Ghasemi & Abdolshah (2014). Therefore, this study offers an exciting opportunity to advance our knowledge of the banking concentration-economic growth relationship by examining the issue using the OIC countries as a sample.
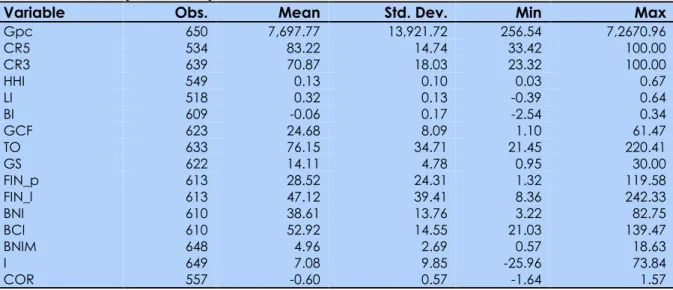
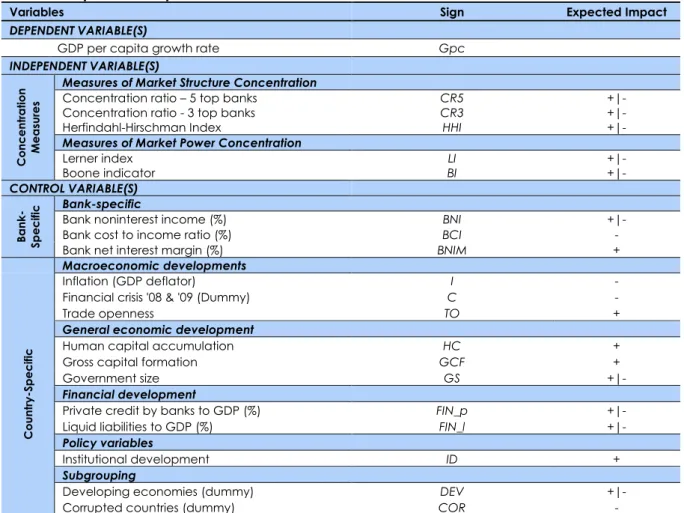
One of the most popular non-structural measures of market power is the Lerner Index (LI), developed by Abraham P. In this study, we use the ratio of government consumption expenditures to GDP. It requires the value of one for years 2008 and 2009 and zero otherwise to capture the effect of the global financial crisis on economic growth.
The general level of socio-economic development of a country can cause different effects of bank concentration on economic growth.
Methodology
Baseline Empirical Methods
Gpci,t=αGpci,t−1+β1CONi,t+β2CONi,t2 +δBi,t+θCi,t+νi+𝜀𝜀𝑖𝑖.𝑡𝑡 (3) In this case we want to see if the effect of bank concentration is only demonstrated up to a certain limit, after which its effect may change. CON= β1+ 2∗ β2CON (4) The above equation represents a line with an intercept (β1) and a slope (2*β2), indicating that for each value of CON, the value of marginal effect will be different. 4 above, the marginal effect would be positive or negative for any concentration value higher or lower than the inflection point value.
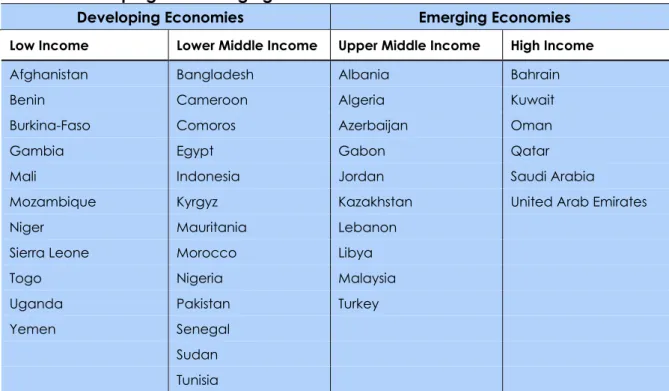
Finally, since there is a discrepancy between the sample countries and their socio-economic and financial development, we will also investigate whether these relationships differ when we divide the data set into two sub-categories, namely: (i) emerging and developing economies; and (ii) corrupt and less corrupt countries. To test this claim, we introduce a dummy variable that takes the value 1 for developing economies/corrupt countries and 0 for emerging economies/less corrupt. Introducing the interaction term between CON and DEV/COR dummy will take into account a potential difference in the concentration-growth relationship between developing and emerging economies on the one hand and corrupt and less corrupt OIC countries on the other.
Gpci,t=αGpci,t−1+β1CONi,t+β2DEVj+β3(CONi,t× DEVj) +δBi,t+θCi,t+νi+εi.t (5) where j refers to growth and developing economies, 0 for emerging and 1 for developing economy. Gpci,t=αGpci,t−1+β1CONi,t+β2CORj+β3(CONi,t× CORj) +δBi,t+θCi,t+νi+εi.t (6) where j refers to corrupt and less-corrupt Country. CON = 𝛽𝛽1 (7) In other words, the sign of 𝛽𝛽1 indicates the sign of the relationship between banking concentration and economic growth for emerging/less corrupt economies.
94 In short, the significance or insignificance of 𝛽𝛽1+𝛽𝛽3 will determine whether there is a relationship between bank concentration and economic growth for developing economies/corrupt countries. Finally, by comparing 𝛽𝛽1 with 𝛽𝛽1+𝛽𝛽3 which represents the marginal effect for emerging/corrupt and developing/less corrupt economies respectively, we can see the difference between both types of income and corruption level countries in terms of a concentration-growth relationship.
Estimation Method
In short, dynamic panel techniques, such as GMM methods, meet the requirements of our proposed study, as we have a relatively low number of years and a large number of cross-sections per year, i.e., due to the structure of our dataset, overall superiority of the system GMM and for the consistency of our interpretations we will use the system GMM for all models in the text.
Empirical Results and Discussion
Main Results .1. Baseline Results
- Income Levels, Bank Market Structure & Economic Growth Relationships
- Corruption, Bank Market Structure & Economic Growth Relationships
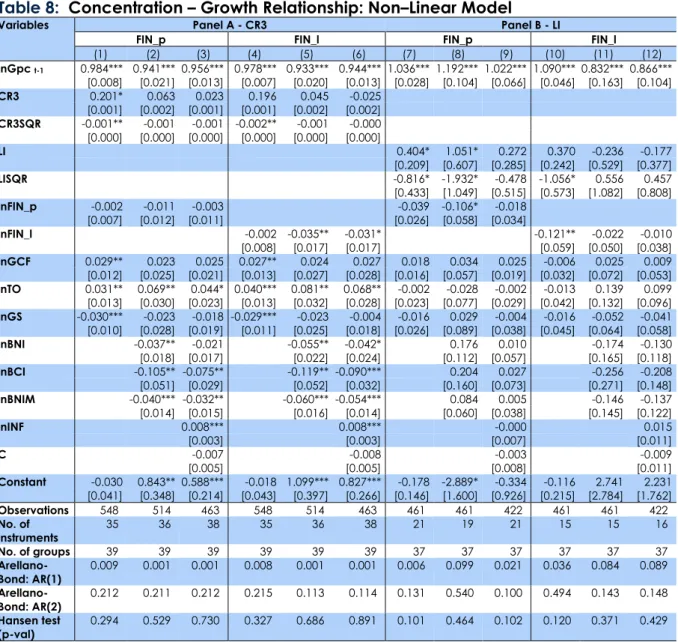
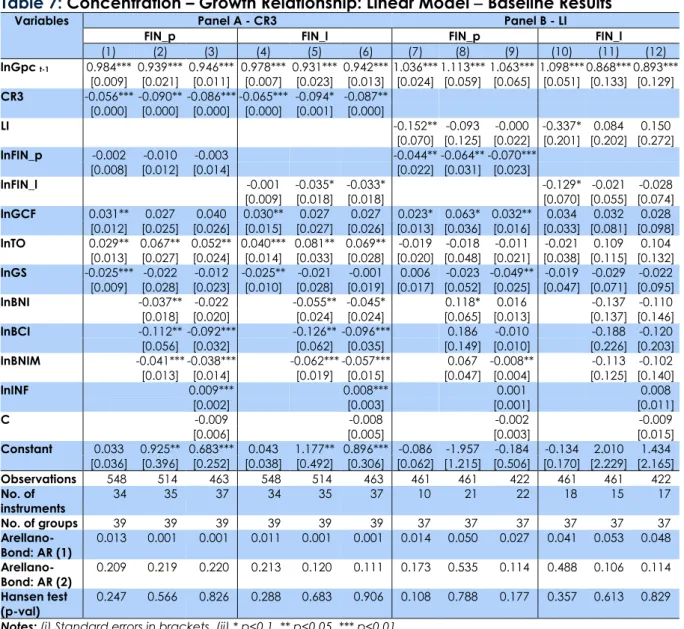
Moreover, autocorrelation tests of first differenced residuals suggest the presence of order 1 autocorrelation (AR1) in all cases, but fail to reject the null of absence of order 2 autocorrelation (AR2). Finally, we use the J Hansen test to test the significance and validity of the instruments used. CR3 is the 3-bank concentration ratio (due to low values, we multiplied the coefficients by 100).
In other words, the impact of GS depends on the relative size of the public sector and the level of Gpc. In panel B, where LI is used as a proxy for bank concentration, GCF is the only control variable that is positively significant in models (7–9). It seems that the composition of credit has changed over the years and the results are negative, as the majority of credit goes to financial assets and thus does not contribute to growth. 2017) found that thresholds mark the relationship between economy and growth and it depends on income level, political regime, institutional quality and region of a given country.
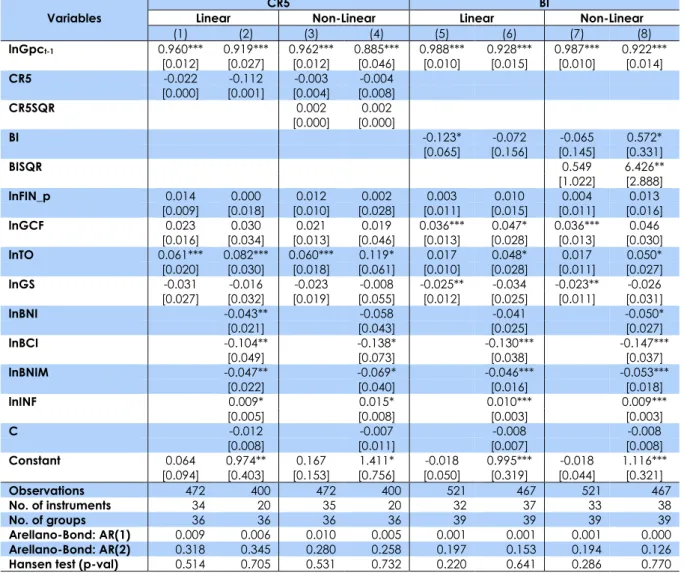
By investigating the non-linearity of this relationship, we are simply testing whether the effect of bank concentration on economic growth depends on its degree/level. With the addition of the quadratic terms, CR3SQR and LISQR, most of the linear coefficients of the banking market structure turn out to be insignificant. However, in general, most countries (80% of the data) lie above this cut-off point, indicating that the banking concentration-economic growth relationship is clearly negative.
Given that the concentration measurements in many sample countries are above the threshold value, it means that the concentration of banks primarily reduces economic growth within the sample. The discussion so far has focused on the general equations of the basic and non-linear models, making the effect of bank concentration on economic growth the same even though a country may be classified as a developing or emerging economy. In other words, the impact of market structure and market power are not significant for emerging economies, but have a negative impact on growth for developing economies.
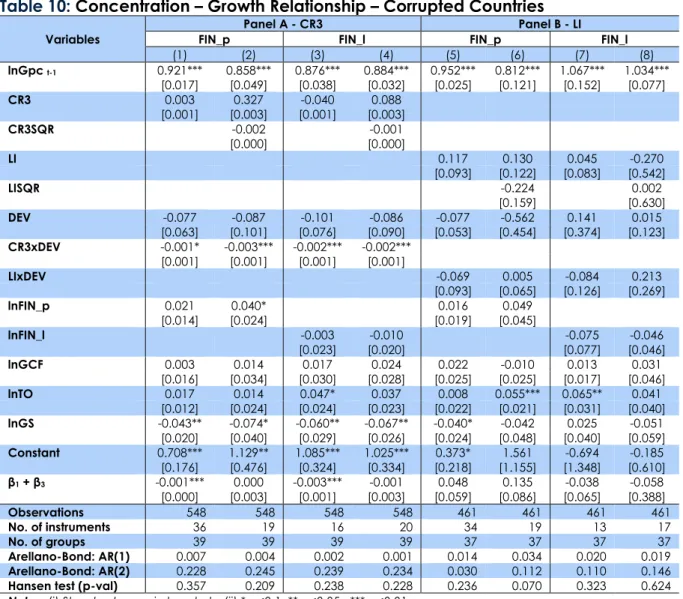
Thus, it is possible to interpret the sign of an interaction term when both coefficients are jointly significant, even if the coefficient of the interaction term alone turns out to be insignificant—in other words, testing whether CR3 + CR3xDEV = 0 is more crucial than observing the significance/insignificance of itself interaction term.12 In particular, in emerging economies, bank concentration has no effect on Gpc, while it has a negative effect on Gpc in developing economies, according to the results in Table 9. In other words, this interaction model argues that the effect of a change in CR3 on Gpc depends on the value of the conditional variable DEV. Finally, as briefly mentioned in the previous subsection, we want to investigate whether the effect of bank concentration on economic growth produces the same results for countries classified as corrupt or less corrupt, or whether it would produce relatively similar results.
Thus, in these cases, we can interpret the signs of the coefficients of the interaction terms to be positive. Overall, the table confirms the importance of the market structure measure of bank concentration and the non-linearity of its relationship with economic growth.
Robustness Checks
- Baseline and Non-Linear Models
- Income and Corruption Level Models
At the same time, all other linear and non-linear terms for banking market structure/power measures are insignificant. According to the main results, the interaction terms are significant in models (1) and (2), but the joint significance test is confirmed only in model (1). This is in contrast to the findings previously reported in Table 10 where both linear and non-linear terms are significant.
Conclusion
Banking Concentration, Financial Stability and Public Policy Paper presented at The Structure and Resilience of the Financial System, Sydney. How Institutions and Regulations Shape the Impact of Bank Concentration on Economic Growth: International Evidence. The relationship between banking competition and financial stability: a case study of the Mexican banking sector.
The Economic Impact of Banking Structure: A Review of Recent Literature Economic and Financial Review, Second Quarter, 11-25. Bank commercial loan markets and the role of market structure: evidence from commercial loan surveys.