Geopolymer concrete beams reinforced with glass fibers were cast and tested to verify their shear behavior. Analytical models were established to predict the mechanical and durability properties of glass fiber reinforced geopolymer concrete.
Introduction
Background
The main objective was to evaluate the effect of fiber addition on the fresh and hardened properties of geopolymer concrete. In addition, no studies were reported, to the author's knowledge, on the structural shear behavior of glass fiber reinforced geopolymer concrete (RGC) members.
Scope and Objectives
Evaluate the influence of varying internal shear reinforcement on the structural shear behavior of reinforced ordinary geopolymer concrete beams. Investigate the possibility of replacing internal shear reinforcement with glass fibers in reinforced geopolymer concrete beams subjected to shear.
Outline and Organization
Carry out an analytical study aimed at correlating the shear performance results of the beams thus produced to previously developed equations. It also includes an analytical study aimed at utilizing previously developed equations to predict the shear capacity.
Literature Review
- Overview
- Environmental Impact of Conventional Cement
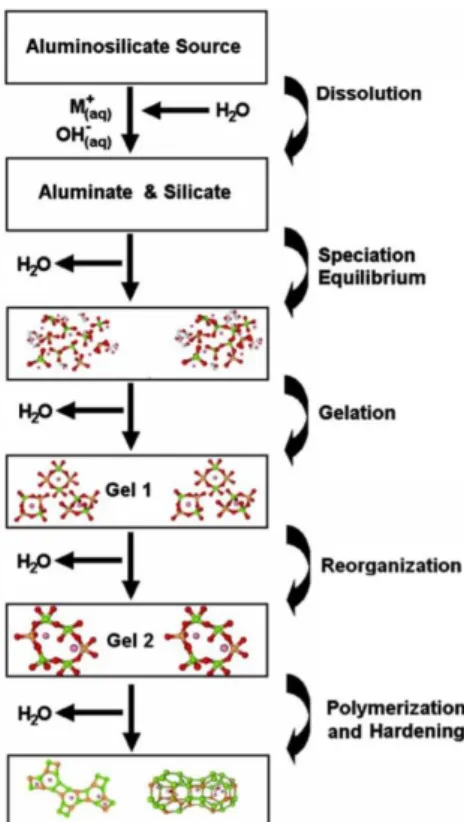
- Background on Geopolymers
- Geopolymer Concrete Composites
- Alkaline Activators
- Additional Water Content
- Glass Fiber-Reinforced Concrete
- Shear Behavior of Geopolymer Concrete
- Research Significance
Literature works [60]-[63] have investigated the effect of water content in fly ash-based geopolymer concrete. 71] investigated the effect of glass fiber addition up to 1.2% of the volume fraction in a fly ash-based geopolymer concrete.
Experimental Program
Overview
Testing Program
- Phase II – Shear Behavior of Reinforced Geopolymer Concrete Beams
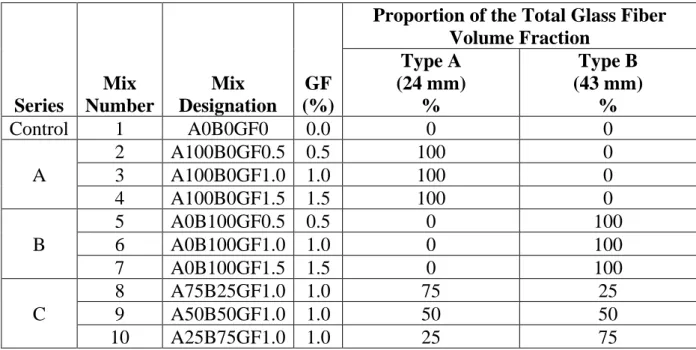
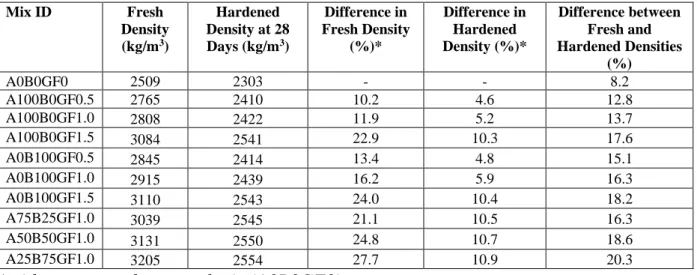
The first phase of the experimental test program aims to evaluate the fresh, mechanical and durability properties of slag-fly ash mixed geopolymer concrete containing glass fibers in different volume fractions. For example, a geopolymer concrete mix designated A0B0GF0 denotes the regular control mix, while A100B0GF0.5 denotes the mix comprising 100% Type A (24 mm) glass fibers with a volume fraction of 0.5%.
Material Properties
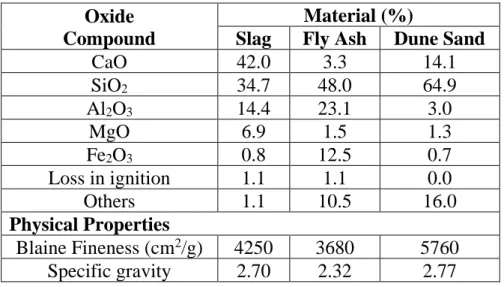
- Precursor Binding Material
- Coarse Aggregates
- Fine Aggregates
- Chemical Activators
- Superplasticizer
- Water Content
- Glass Fibers
- Steel Reinforcement Bars
The coarse aggregates used in the geopolymer concrete mixes consist of 30% 10mm aggregates and 70% 20mm aggregates. As such, a superplasticizer was needed to improve the workability of slag-fly ash mixed geopolymer concrete to achieve the design slump.
Concrete Mixture Proportions
The volume fraction of hybrid mixes was selected at 1% based on test mixes presented in Appendix A. Hybrid geopolymer concrete mixes with 1.0 and 1.5% vf resulted in almost comparable compressive and tensile strengths at a young age.

Specimen Preparation of Phase I
Specimen Preparation of Phase II
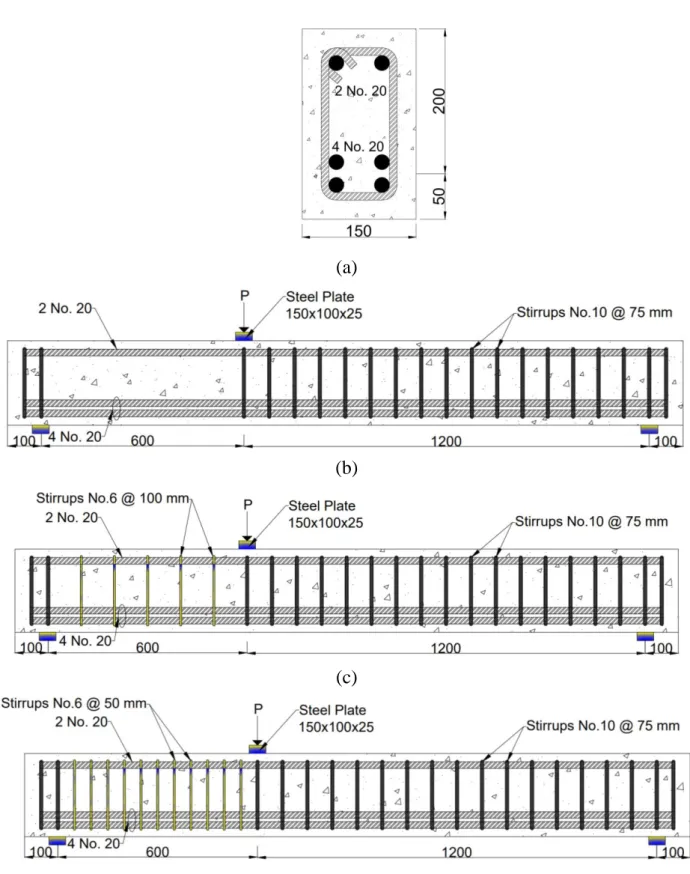
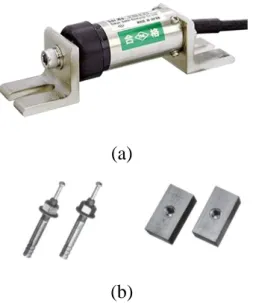
- Reinforcing Cages and Formwork
- Steel Strain Gauges
- Concrete Casting
The stirrups are then bent and attached to the longitudinal steel bars that form the designated steel cage. Strain gauges are bonded to the longitudinal steel located below the point of load application.
Performance Evaluation – Phase I
- Evaluation of Fresh Properties
- Evaluation of Mechanical Properties
- Evaluation of Durability properties
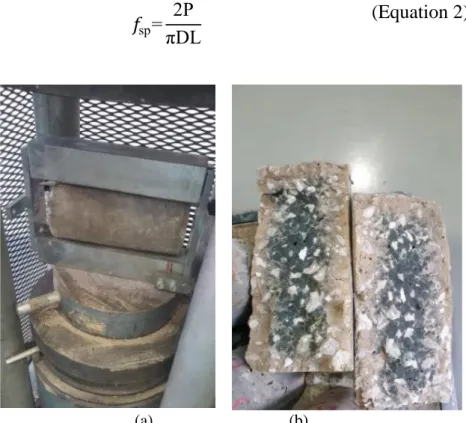
Afterwards, the weight of the cylinder filled with concrete is measured under its own weight. A sheet disc is placed on top of the concrete after the slump form is lifted. The load was applied over the entire length of the specimen at a loading rate of 1 kN/sec.
It gives an indication of the durability performance of the glass fiber reinforced slag fly ash mixed geopolymer concrete.
Phase II: Shear Behavior of Reinforced Geopolymer Concrete Beams
- Instrumentation and Testing
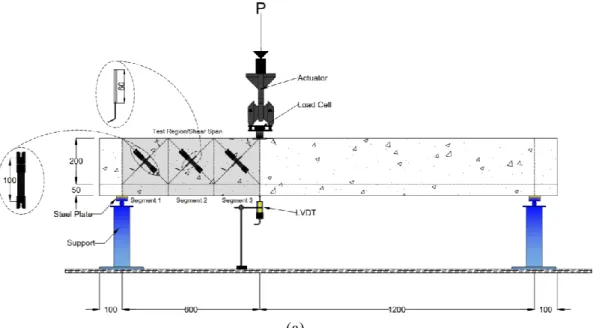
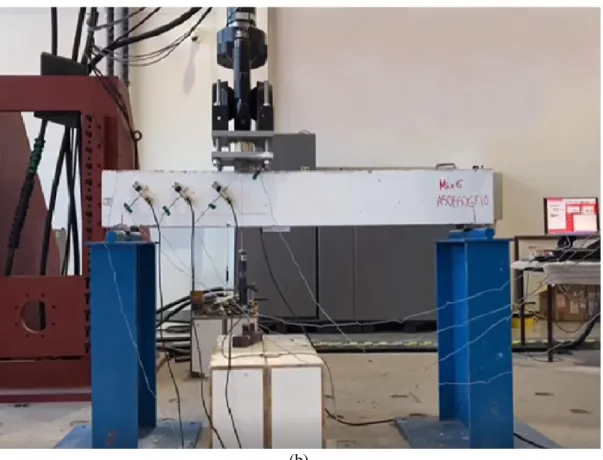
A linear variable differential transformer (LVDT) was placed 600 mm away from the left beam and 1200 mm away from the right beam under the beam to record the deflection. The load cell, LVDT, strain gauges and transducers were connected to a data acquisition system to record readings during load application. Figure 17(a-b) shows the schematic and test setup of a typical reinforced geopolymer concrete beam subjected to shear.
Summary
Characterization
Overview
Fresh Properties
- Slump
- Compaction Factor
- Vebe Time
It is clear that the addition of glass fibers drastically reduced slump values in all mixes. Based on these results, longer glass fibers (Type B) had a more adverse impact on the compactability of geopolymer concrete mixtures than shorter glass fibers (Type A). This is mainly due to the greater likelihood of fiber bonding effect occurring in blends with long glass fibers.
The addition of Type A glass fibers to a volume fraction of 1% had no significant effect on livestock time.
![Figure 18 presents the slump values for series [A] and [B]. For Series [A], geopolymer concrete mixes incorporating type A (24-mm long) glass fibers at 0.5, 1.0, and 1.5% volume fractions exhibited slump reductions of 47, 50, and 69%, resp](https://thumb-ap.123doks.com/thumbv2/azpdfco/10576236.0/80.892.232.662.821.1088/figure-presents-geopolymer-concrete-incorporating-fractions-exhibited-reductions.webp)
Mechanical Properties
- Cube Compressive Strength
- Cylinder Compressive Strength
- Compressive Stress-Strain Response
- Modulus of Elasticity
- Flexural Performance
- Shear Performance
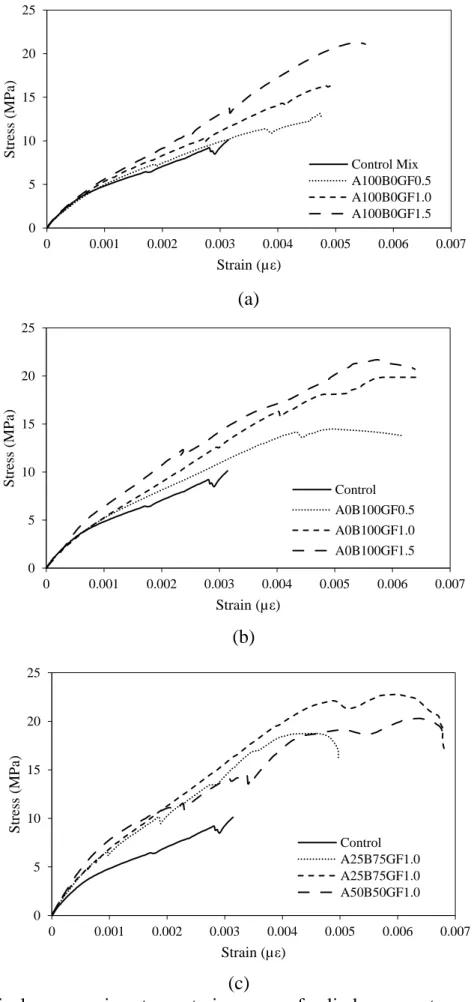
Increasing the proportion of long glass fibers actually resulted in a higher compressive strength after 28 days. The effect of replacing short glass fibers with long glass fibers at a constant volume fraction was investigated. Of the two types of glass fibers, the long glass fibers led to a higher T150 at comparable glass fiber volume fractions.
A significant increase in T150 was observed in blends containing hybrid glass fibers compared to their single type glass fiber counterparts. The addition of short (type A) glass fibers resulted in a fractional increase in peak displacements with increased glass fiber volume fractions. In short, the addition of glass fibers improved the shear performance of geopolymer concrete mixed with slag fly ash.
![Figure 22: Cube compressive strength development for (a) Series [A], (b) Series [B], and Series [C]](https://thumb-ap.123doks.com/thumbv2/azpdfco/10576236.0/85.892.238.674.489.1054/figure-cube-compressive-strength-development-series-series-series.webp)
Physical and Durability Properties
- Fresh and Hardened Density
- Absorption
- Sorptivity
- Abrasion Resistance
- Ultrasonic Pulse Velocity
In contrast, corresponding increases in fresh density of 13, 16 and 24% were observed in geopolymer concrete mixes with long glass fibers at similar volume fractions. Meanwhile, mixtures in the [C] series that replaced short glass fibers with long ones experienced a further increase in the difference between fresh and hardened densities. The replacement of short glass fibers with long ones in the [C] series mixtures is shown in Figure 58.
Figure 59(a) illustrates the curves of capillary sorption capacity of concrete mixes with short (type A) glass fibers.
Cost Analysis
Compared to mixtures reinforced with a single type of fiber (i.e. series [A] and [B]), the unit costs per MPa strengths reduced. In fact, increasing the amount of long (type B) glass fibers in a hybrid combination (i.e., mixing with a 3:1 ratio) resulted in lower unit costs per MPa of compression, tensile strength and shear than other mixtures reinforced with hybrid glass fibers. However, blends with a 1:1 ratio of short and long glass fiber quantities at a 1% volume fraction resulted in a more economical unit price per MPa bending strength.
However, the cost calculations do not take into account the performance improvement after the installation of fiberglass.
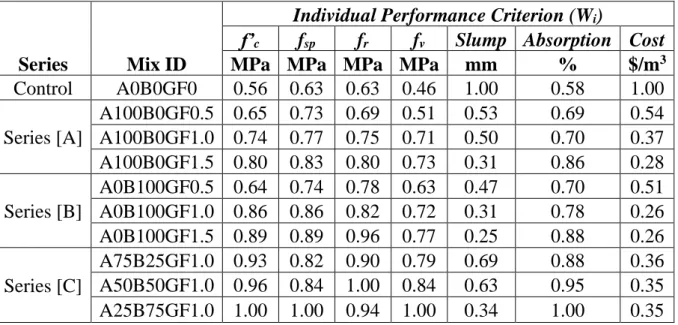
Multifunctional Performance Indexing
Geopolymer concrete mixes reinforced with a hybrid combination of 25% short and 75% long glass fibers at a volume fraction of 1% provided optimal compressive, tensile and shear strength and absorption. A hybrid mix with a similar volume fraction reinforced with short to long glass fibers in a ratio of 1:1 resulted in optimal flexural strength. Thus, it can be concluded that mixtures reinforced with combinations of hybrid glass fibers at 1% volume fraction had better performance than other mixtures.
It is also worth noting that the addition of a single type of glass fibers (either type A or B) to slag-fly ash blended geopolymer concrete was not favorable in any of the multifunctional performance indices.
Summary
It appears that this mixture was superior when slump was not included as a critical parameter, as its slump value was much lower than other hybrid counterparts.
Shear Behavior of Reinforced Geopolymer Concrete Beams
Overview
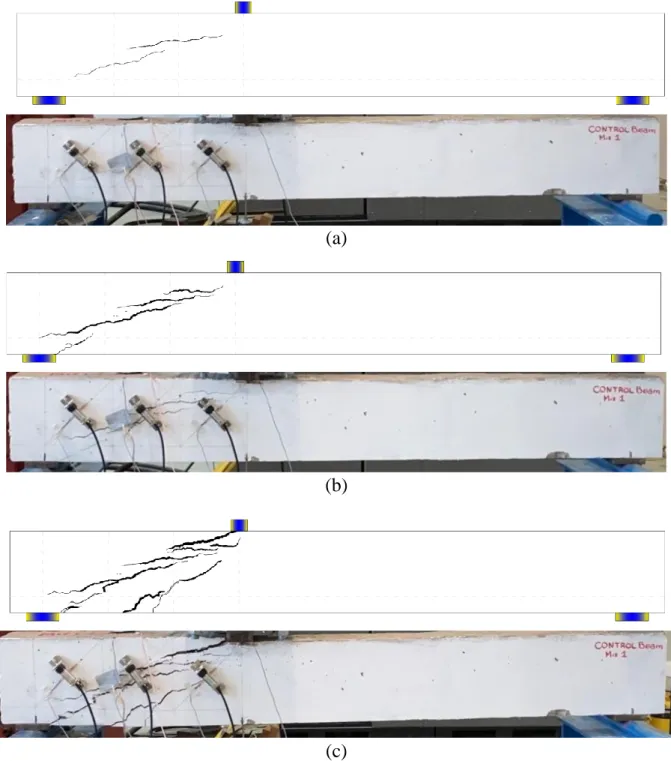
Crack Pattern and Failure Mode
- Specimens of Group I
- Specimens of Group II
- Specimens of Group III
A diagonal shear crack developed at the center of the shear span and then propagated toward the support and load points under loading in all specimens in Group II. The diagonal shear crack was connected to a longitudinal splitting crack developed at the level of the tensile steel in the area close to the support. Figures 70 and 71 show the crack patterns for the RGC beam specimens of Group III reinforced with 24 mm glass fibers and a combination of 24 and 43 mm glass fibers, both at vf of 1%.
Specimens from group III showed a shear crack initiated at the center of the shear span (i.e. segment 2) and then propagated to the left support and load point as the load progressed.
Shear Load-Deflection Response
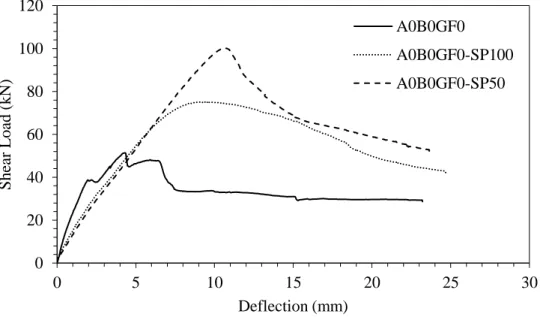
- Specimens of Group I
- Specimens of Group II
- Specimens of Group III
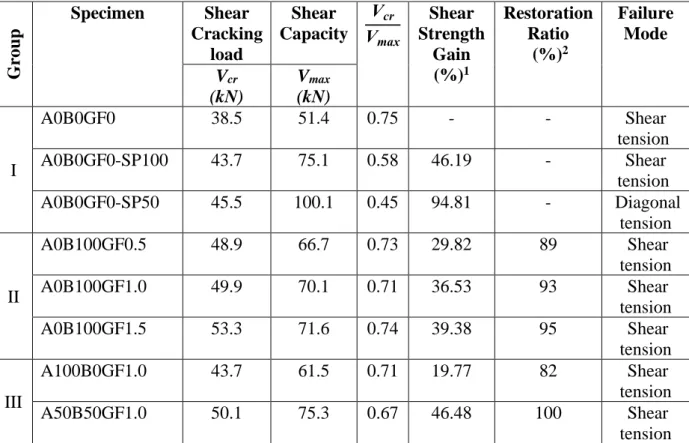
The shear crack load of the samples with glass fibers was on average 30% higher than that of A0B0GF0. The peak load deflection of the glass fiber samples averaged 1.43 times that of the A0B0GF0 benchmark sample. The glass fiber test pieces experienced higher collapse deflection and improved energy absorption than that of the reference test piece A0B0GF0.
The peak load deflection of the samples with glass fibers averaged 1.5 times that of A0B0GF0.
Strain Measurements and Displacement Across Shear Cracks
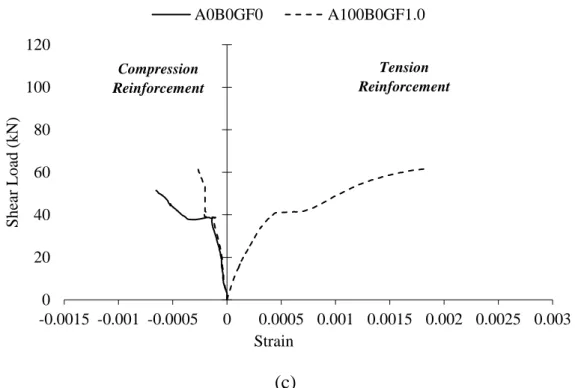
- Longitudinal Steel Strains
- Stirrup Steel Strain
- Concrete Strains
- Diagonal displacement Across Shear Cracks
The rate of increase in the tension steel strain was higher after cracking. After cracking, all specimens, except A0B0GF0-SP50, showed a significant increase in the rate of increase of the longitudinal concrete strain until the shear capacity was reached. The maximum displacement across shear cracks of Group II specimens was on average 27% lower than that of the benchmark specimen.
Figure 82(b) shows that the presence of beams significantly reduced the rate of increase of diagonal displacement across shear cracks developed in segment 2.
Performance Evaluation
The addition of 24mm long glass fibers (type A) at a vf of 1% resulted in a 20% increase in shear strength, which was lower than that of its 43mm long glass fiber counterpart (type B), which showed a shear strength gain of 37%. Using a hybrid combination of glass fibers resulted in a 47% increase in shear strength over that of the benchmark sample, which exceeded the gain obtained by using a single type of glass fiber. As such, the hybrid combination of 24 and 43 mm long fibers with a ratio of 1:1 and a vf of 1% can be used to replace the minimum number of brackets.
2 Gains over the strength of A0B0GF0-SP100 with a minimal amount of steel brackets.
Analytical Procedure
- Overview on Previously Developed Models
- Analytical Evaluation
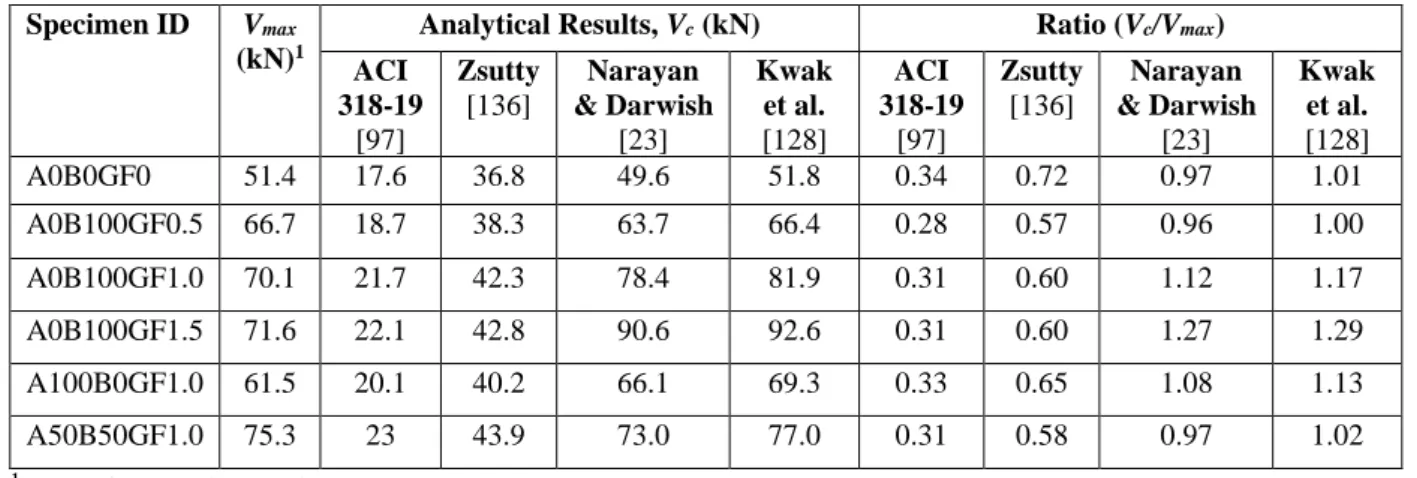
137] gave an accurate prediction of the shear capacity of the beams with no or low vf value of 0.5%. However, the models tended to overestimate the shear capacity of the beams with higher vf values of 1 and 1.5%. 128] models require refinement to provide a reasonable/conservative prediction of the shear capacity of glass fiber reinforced geopolymer concrete beams.
The reduced COV of the improved models relative to the original models further validates their validity for predicting the shear performance of glass fiber reinforced geopolymer concrete beams with reasonable accuracy.
Summary
Further research is certainly needed to produce more experimental data and validate the accuracy of the refined models proposed in the current study. Reasonable improvements to previously developed models for predicting the shear capacity of fiber-reinforced concrete beams were introduced through the presented analytical study. Still, the proposed improvements are limited to the specimens tested in this study, as they tend to better estimate the shear capacity than other previously developed models.
Overview
Limitations
Conclusions
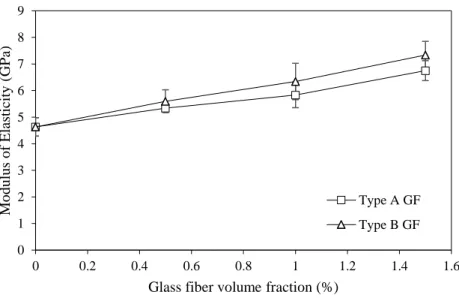
Increasing the glass fiber volume fraction or hybridizing the glass fibers further increased the elastic modulus. The addition of glass fibers played a similar role to the steel braces, but to a lesser extent. The shear strength was increased by 47% with the addition of the hybrid combination of glass fibers.
The addition of fiberglass also increased the difference between Cvr and Vmax, but to a lesser extent.
Recommendations for Future Studies
Niu, "The microstructure and durability of fly ash-based geopolymer concrete: A review," Ceramics International, vol. Lee, "Fresh and cured properties of alkali-activated fly ash/slag paste with superplasticizers," Construction and Building Materials, vol. Salem, "The effect of water addition, plasticizer, and alkaline solution composition on fly ash-based geopolymer concrete performance,” Construction and Building Materials , vol.
Chung, “Mechanical properties of fly ash-based geopolymer concrete with alkaline activator,” Construction and Building Materials, vol.
![Figure 19: Slump values in mm for Series [C] mixes and their counterpart mixes.](https://thumb-ap.123doks.com/thumbv2/azpdfco/10576236.0/81.892.215.681.726.1055/figure-19-slump-values-series-mixes-counterpart-mixes.webp)