This study examines the effect of banking concentration and financial development on economic volatility in member countries of the Organization of Islamic Cooperation (OIC). Based on both linear and nonlinear estimations, we find no significant impact of bank concentration on economic volatility. In particular, this study relies on various bank concentration and financial development measures to address their impact on economic volatility using a sample from OIC countries.
As a result, this study offers an exciting opportunity to improve our knowledge of the relationships between banking concentration and economic volatility by level of financial development. Nevertheless, several authors argue that banking concentration and monopoly power benefit economic growth and general stability (a competitive fragility perspective). Their results show no significant impact of bank concentration on economic volatility, although financial development reduces volatility.
In summary, the effect of financial development and bank concentration on economic volatility depends on the size, structure and level of a country's financial system. It also depends on the proxies used for measures of bank concentration and financial development (Unfortunately, there is generally a paucity of research on this topic focusing on OIC member states. Therefore, this study provides new evidence on this topic using several concentration measures of banks and financial development and focuses on OIC member states.
To see if this impact of bank concentration depends on the level of financial development, we introduce an interaction term in Equation 1 as presented in Equation 3.
Method
4 Empirical Results
- Linear Model
- Non-Linear Bank Market Structure and Economic Volatility Relationships
- Finance, Bank Market Structure, and Economic Volatility Relationships
- Robustness Tests
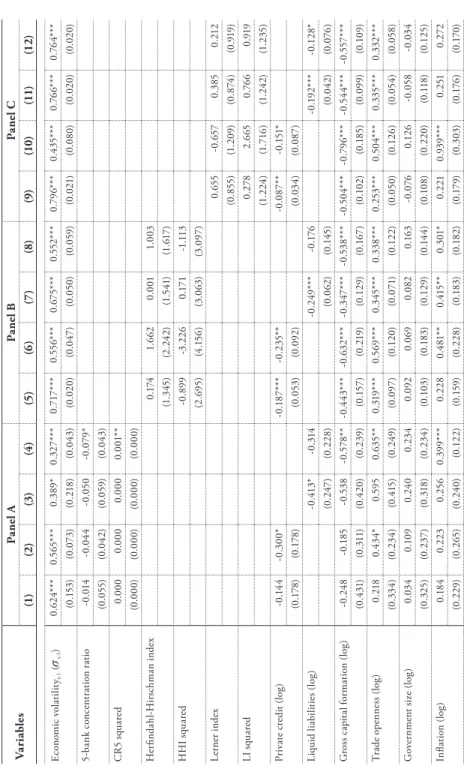
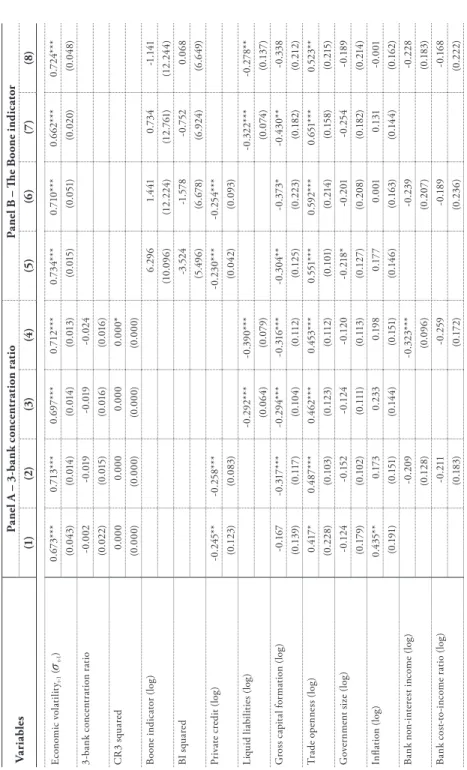
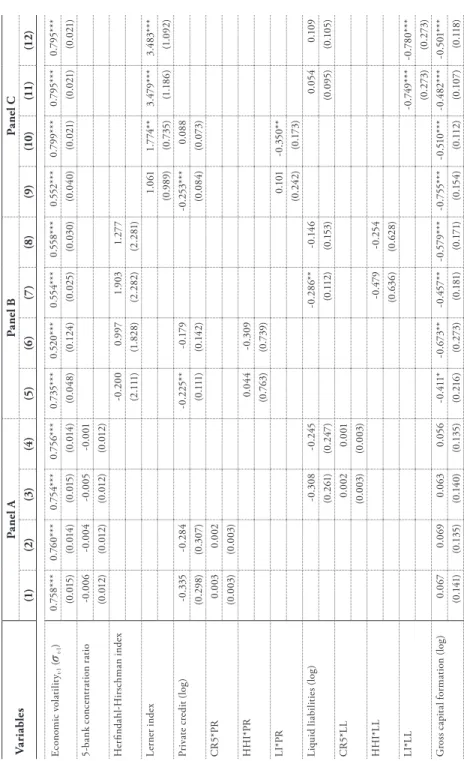
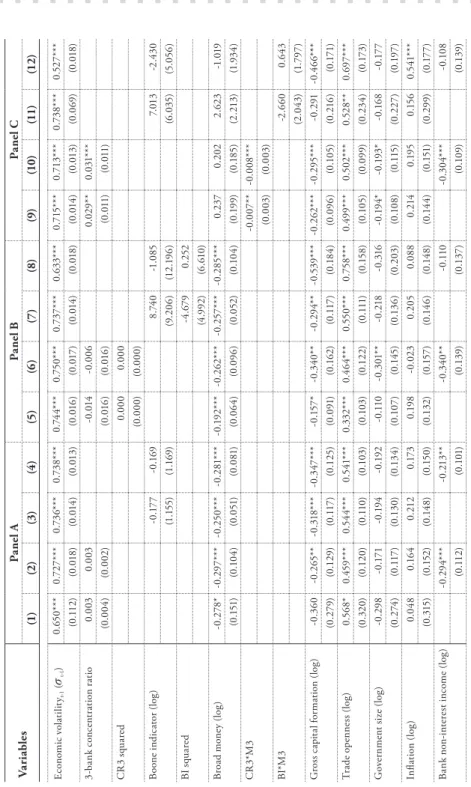
We shift our focus to the possible nonlinear relationship between banking concentration and economic volatility. In particular, we introduce the squared term of the 3-bank concentration ratio (CR3 squared) and the Boone indicator squared term (BI squared). Our focus variables, measures of bank concentration, are still found to have an insignificant impact on economic volatility.
However, the non-linearity of the banking concentration-economic volatility relationship cannot be confirmed as the squared terms (CR3 squared and BI squared) are insignificant, except under model (4). Nevertheless, based on overall results, we can conclude that bank concentration does not affect economic volatility in linear or non-linear ways. Namely, we examine the impact of bank concentration and financial development on economic volatility and their combined effect on volatility.
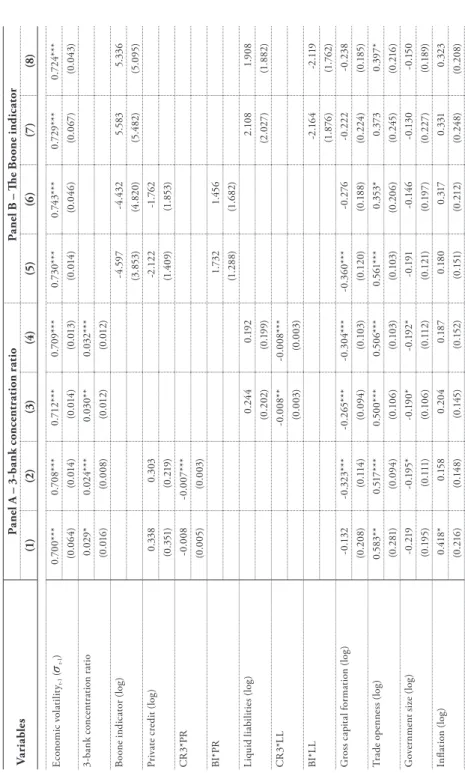
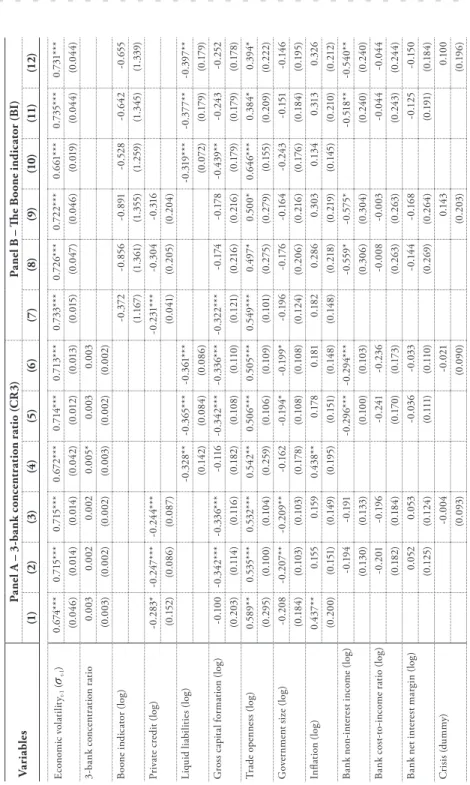
Notably, we interact the 3-bank concentration ratio with retail credit (CR3*PR) and liquid liabilities (CR3*LL) in panel A. However, in this panel, both proxies for financial development (PR and LL) have an insignificant impact on economic volatility. In short, our results suggest that market structure (CR3) has a marginally positive effect on economic volatility.
In essence, the study finds partial evidence that the effect of bank concentration on economic volatility depends on the level of financial development. In this table, CR3*PR is the concentration ratio of 3 banks – private credit interaction term (log). For robustness test purposes, we will report results using three additional measures of bank concentration.
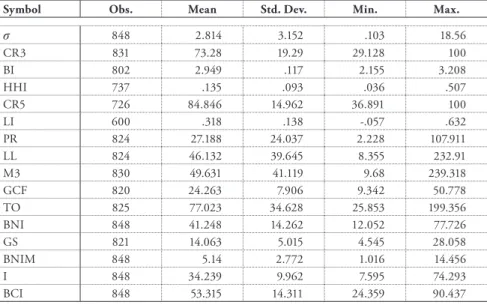
Two of them are measures of market structure – the 5-bank concentration ratio (CR5) and the Herfindahl-Hirschman index (HHI) – and the third is a measure of market strength – the Lerner index (LI). In other words, banking concentration is not significantly attributed to changes in economic volatility in OIC countries. Panel C, on the contrary, indicates that the impact of bank concentration, as given by the measure of market strength (LI) on economic volatility, is positive and significant.
While our main results in Table 5 show that bank concentration reduces economic volatility at low levels of financial development, the same is not the case when CR5 and HHI are used instead of CR3. In other words, some evidence is found for the hypothesis that the effect of bank concentration depends on the level of financial development of OIC countries.
5 Concluding Remarks
At the same time, it has been documented in the literature that different concentration measures can lead to different results, especially in a cross-country analysis (Carbó et al., 2009). Panels A, B and C deal with linear, nonlinear and interaction models, respectively, taking into account our key library concentration variables CR3 and BI. In general, all specifications indicate a high significance of the coefficients of the delayed dependent variables, and they are close to previously reported values.
In addition, banking concentration is not attributed to significant economic volatility, linearly or non-linearly, as per the main results. Similarly, all specifications under panel C, where our second objective is tested, are consistent with our main results. In contrast, financial development measures (individually or together with concentration ratios) contribute to economic stability as they significantly lower volatility.
A small inconsistency in our results can be attributed to different proxies used for the analysis, as they can lead to varying results in cross-country analysis (Carbó et al., 2009; Leon, 2015). Therefore, while a smaller result indicates a positive impact of market structure concentration (CR3) on volatility, it may be offset by increased financial development. In other words, we can reduce economic volatility in the sample countries by either increasing financial development and/or decreasing market structure concentration, ceteris paribus.
Overall, the findings provide some critical insights into the topic from a heterogeneous sample of countries with different levels of banking concentration and financial development. To avoid the possible negative impact on economic stability, they should instead focus on promoting financial development that reduces economic volatility, either directly or through its effect on concentration. Thus, more attention should be paid to improving overall financial development in OIC countries to address the volatility caused by bank concentration.
However, careful attention must be paid to proxies used for the analysis, as the use of different proxies can lead to different and sometimes contradictory results.
Literature
The impact of the financial system on economic growth in the context of the global crisis: Empirical evidence for EU and OECD countries. The Impact of Bank Concentration and Financial Development on Economic Growth and Income Volatility: Evidence from the OIC Countries (Doctoral Dissertation). The impact of bank concentration and financial development on growth volatility: the case of selected OIC countries.
In this table, CR5*PR is the concentration ratio of 5 banks and private credit (log) interaction. CR5 and CR3 are commonly defined as a measure of the degree of competitiveness in the banking sector, relative to the total assets of the five and three largest commercial banks, respectively, as a proportion of total commercial bank assets. Nevertheless, Bikker and Haaf (2002) state that it is arbitrary to choose a number of banks, k, to be included in the concentration index.
The HHI index would equal one if a market is dominated by a single firm/bank (in a monopolistic environment). In contrast, the HHI index would approach zero in a market where all companies/banks are the same size (in a competitive environment). The HHI index can be influenced by the number of banks in the market and/or the disparity in market shares between different banks.
According to Davies (1979), the greater the number of banks in the market, the less sensitive the index is to changes in the number of banks. When P = MC, the Lerner index equals zero in perfect competition, indicating that a company/bank has no pricing power. As the Lerner index approaches one, it shows an increasing increase in price relative to the marginal cost and thus the market power of a company/bank.
Boone developed a new measure of competition that relates a company's profit or market share to its efficiency. In particular, the Boone indicator is based on the idea that as a market becomes more competitive, efficient firms/banks (i.e. those with lower marginal costs) gain market share and achieve higher profits compared to less efficient firms/banks penalized by lower marginal costs. profits and market shares.