Thus, monitoring and controlling the quality of received sensory data becomes very important to ensure the effectiveness of the services. CrowdPower then validates the quality of the data received, removes outliers and processes the data to generate an incident report that is automatically sent to the data consumer. Empirical evaluation: We discuss the evaluation of the participant selection model (first stage) and the data quality model (second stage).
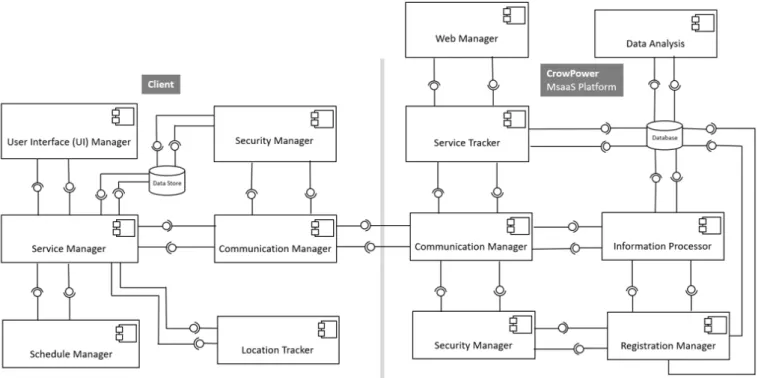
In this section, we first discuss the software requirements and architectural components of the application. The software components of the CrowdPower application are distributed either on the client side (smartphone) or server side (MSaaS server platform), as shown in Figure 2. The software components of the CrowdPower application are distributed either on the client side (smartphone). or the server side (MSaaS server platform), as shown in Figure 2.
Security Manager: This component is responsible for maintaining data security on both the client and server sides of the application.
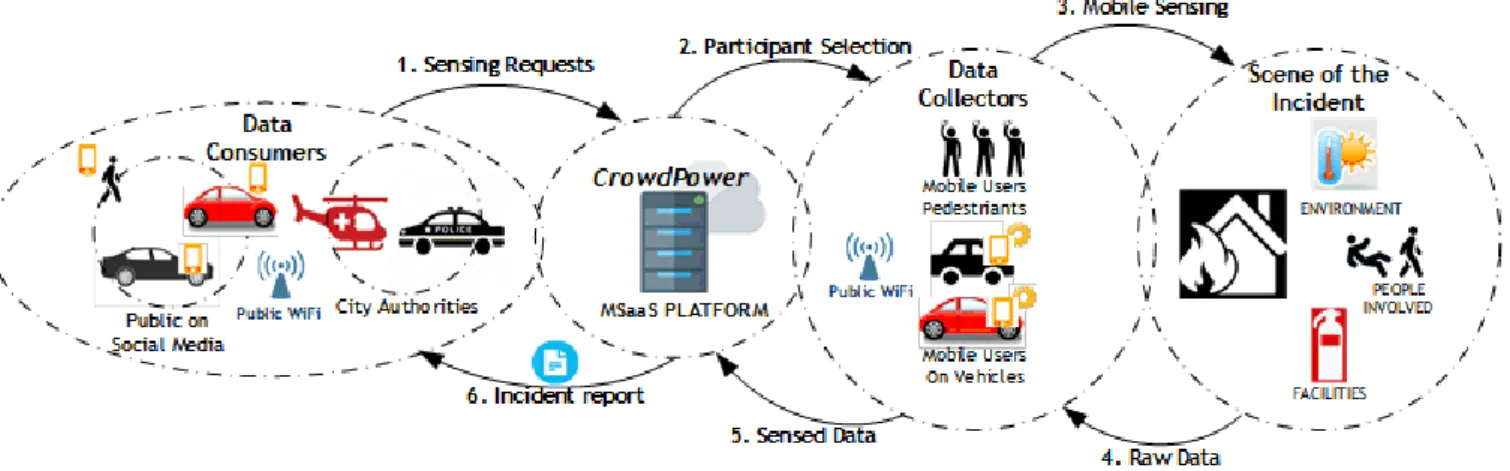
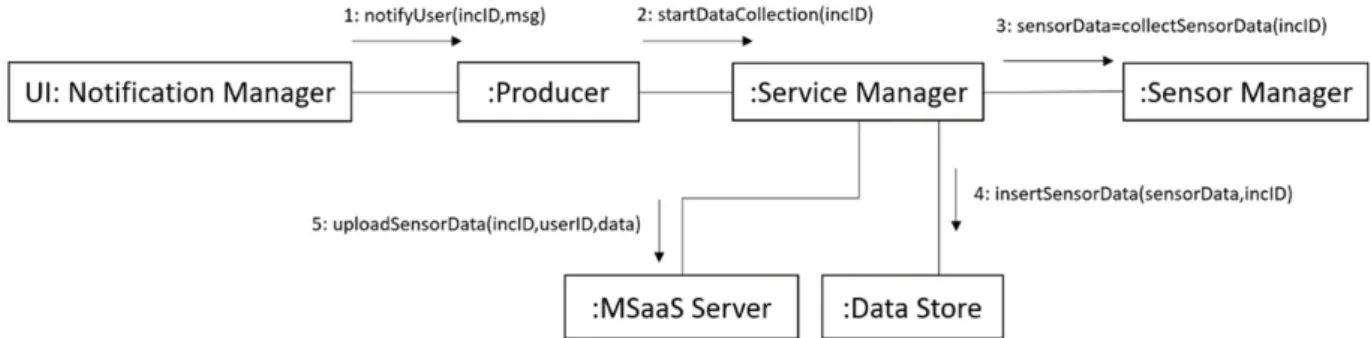
Figure 5. Collaboration diagram: producer uploads sensor data for an incident
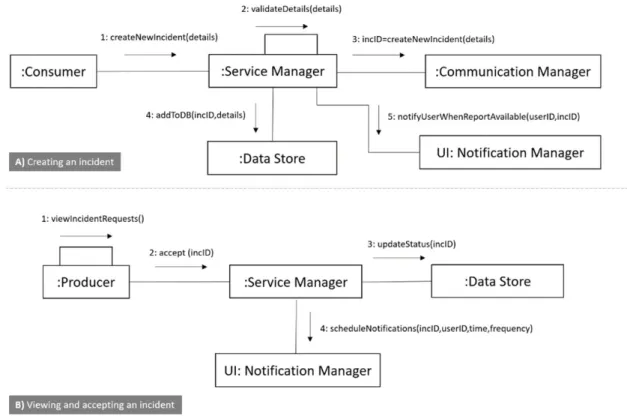
We use message interaction diagrams to depict and explain some of the most important message sequences in the application. Figure 4A shows the createNewIncident message received by the Service Manager from the consumer, where the details of the requested observation incident are validated. The message is passed to the server and then added to the Data Store upon successful validation.
When the results are available, the notification manager sends the appropriate notification to the user. UpdateIncidentStatus is also sent to the back-end server and a scheduleNotifications message with the corresponding user ID, incident ID, duration, and frequency is sent to the notification manager. When the user accepts participation in the incident, the manufacturer responds with a no‐.
The collected sensory data is updated to the database using the insertSensorData message with the appropriate incident ID, sensor ID, and collected data. The Service Manager also sends the addVoluntaryToDB message to the Data Store with relevant de‐. The Notification Manager is also informed to respond with the approval or rejection decision once it is ready.
Figure 6 shows the creation of voluntary registration requests by the producer, where the createVoluntaryRequest message is sent to the Service Manager and the details are updated to the backend server with the createVoluntaryDetails message. The service manager also sends the addVoluntaryToDB message to the data store with relevant details. The notification manager is also informed to respond with the approval or rejection decision when it is ready.
Figure 6. Collaboration diagram: Creation of voluntary sensing request
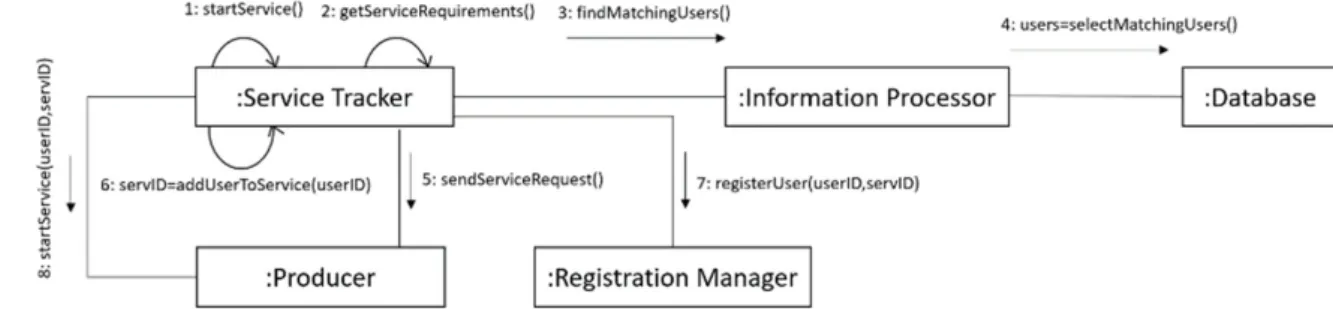
Figure 7. Collaboration diagram: participant selection and service request
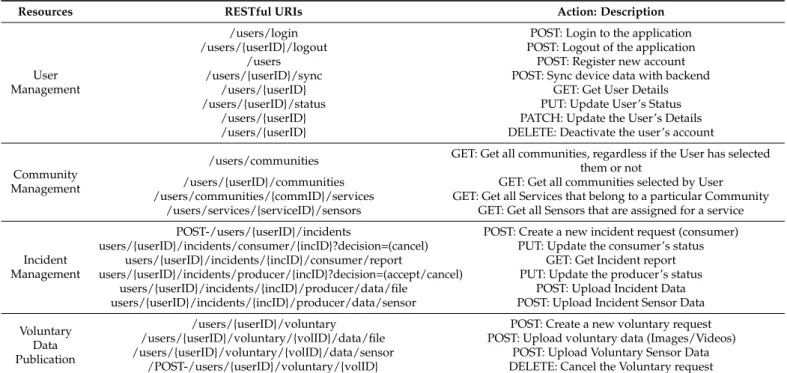
CrowdPower’s Web Service Interfaces
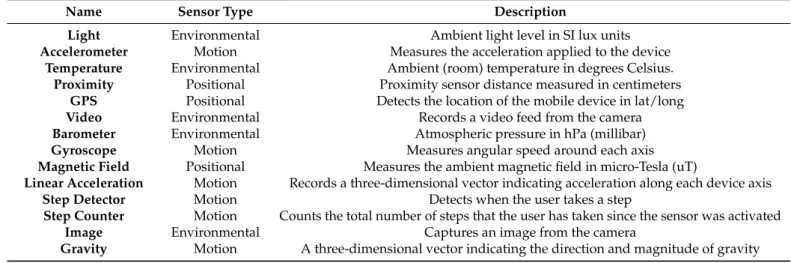
Position sensors: These sensors allow the user to determine the position of the mobile device. The Android operating system provides a sensor API that provides access to the underlying hardware sensors of the mobile device. One is used for 'voluntary request' and the other for 'incidents'. The application converts the sensor data into JSON format.
Smartphone brands are among the most popular smartphones in twenty-one global countries. We used Dxomark [42] and SensMark [39], sensor testing tools to quantify smartphone sensor quality. Based on the results obtained from the testing tools, the algorithm calculates the quality scores of the smartphones.
The Data Analysis component uses an unsupervised learning technique to estimate the data quality of the participants, which is a setQ_k= {q_(1,k). The reputation score is relative to the quality of the data sent by the user in previous time slots of the campaign duration. This is determined by checking whether the distance of the sensor data from the consensus (determined by the centroid of the cluster) exceeds a predetermined threshold.
The centroid is the smallest sum of the weighted squared distance between ck and the participant's data, as shown in Equation (10). The iterative loop in line 3 of the algorithm converges on the quality values for the time slot data. A participant with lower quality data qi,t ≤ 1n should have a higher aging weight and a larger decline in reputation, i.e. the participant's reputation decreases relatively when the data quality decreases, as shown in Equation (12).
Implementation of the MSaaS System
In equation (13), W and X are the lower and upper asymptotes, B is the growth rate, C is the maximum growth rate, and f is the inflection point. This approach to calculating the reputation is proportional to the degree of credibility that is assimilated over time. As introduced earlier, we classify the data sent by participants as either malicious and defective (NkM) or trustworthy (NkT).
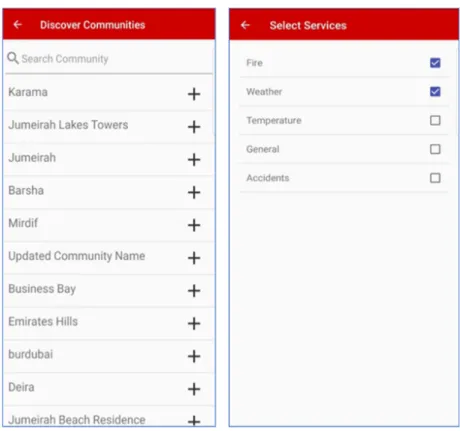
If most of the data items are far from,k, i.e., not in the neighborhood, then ndi,kis is considered malicious. For example, the search box is at the top and the result is updated automatically.
Implementation of the MSaaS System
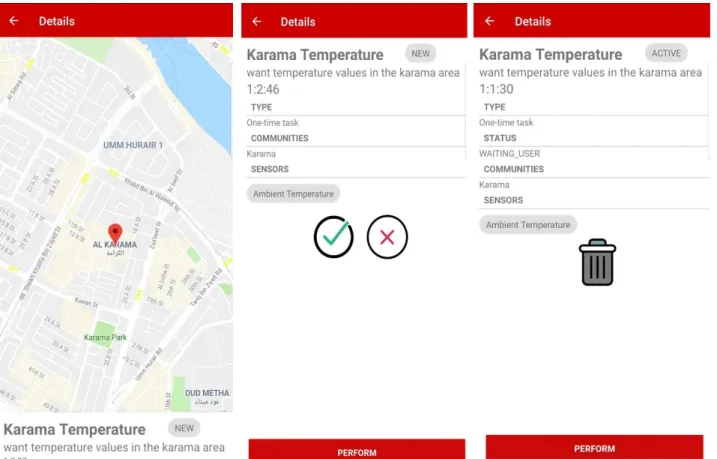
The user can execute the task by pressing the Execute button at the bottom of the screen. The main view of the producer is shown in Figure 13, where a list of all incident requests for which a user has been selected is displayed on the screen. The main view of the producer is shown in Figure 13, where a list of all incident requests for which a user has been selected is displayed on the screen.
The User Dashboard, on the other hand, allows users of the CrowdPower Platform to view generated incident reports that pertain to them. The User Dashboard, on the other hand, allows users of the CrowdPower Platform to view generated incident reports that pertain to them. On the SuperAdmin portal, the user clicks on any community cards, updates information about them and can also enable/disable the communities.
On the Admin portal, the user also sees the information about the service in question, such as the information collected and the communities to which the service belongs. On the SuperAdmin portal, the user can update information about the service, such as the name of the service, the community it belongs to, the status, and the sensors to which they are associated, as shown in Figure 18b. On the Admin portal, the user also sees the information about the service in question, such as the information collected and the communities to which the service belongs.
As shown in Figure 18a, CrowdPower Admins and SuperAdmins see the list of services that are registered in the system as well as their status. Additionally, the user can update information about the service, such as the service name, the community it belongs to, the status, and the sensors it is connected to, as shown in Figure 18b. As shown in Figure 19, the user can view information about generated reports and can approve or reject a report. As shown in Figure 19, the user can view information about generated reports and can approve or reject a report.
Empirical Evaluation
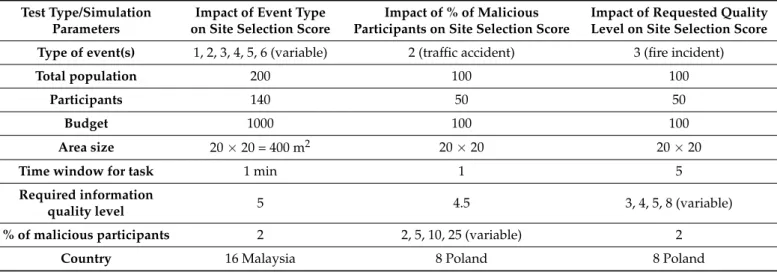
The Admin Portal allows system administrators to view and manage incident reports generated from the Crowdsensing platform. In this section, we summarize some simulation results, namely the impact of event type, percentage of malicious participants, and requested quality levels on the sites' final selection scores. In the second test, the percentage of malicious participants was varied from 2 to 25% of the total number of participants.
The tests we ran concentrated on assessing the effect of this kind of event on the selection scores of locations. We ran other tests that focused on assessing the effect of participants' error processing on the location selection scores. Figure 21 shows the selection of the choices regarding several frequencies of participants abusing the system in the area of interest (AoI).
The first location (site 1) was chosen for situations where one-tenth and one-quarter of participants misused the system, while the third location (site 3) was chosen for situations where two and five percent of participants misused the system. system. In the following tests, we focused on evaluating the effect of the required quality level on the results of site selection. The first location (site 1) was chosen for situations where one-tenth and one-quarter of participants misused the system, while the third location (site 3) was chosen for situations with two and five percent of participants misusing the system. system.
From a visible evaluation of the normalized data in the tables, we see that the values of participants four and five are relatively high, while the values of participants two and seven fluctuate widely. Figure 24 shows the average quality of the temperatures provided by the participants in the sensor campaign. The value of the parameters affects the presentation of reputation values in Figure 25; however, the results will still show the variations in the participants' reputations, which depend on the quality of the data sent by the participants.
Conclusions
Application Science of 41 . Comparing the data in Table 6 and the result of the algorithm to determine the outliers shown in Figure 26, we argue that the data submitted by participants four and five have substantially more chance of being malicious than the data provided by participants two and seven. In Proceedings of the IEEE Conference on Intelligent Transportation Systems, Proceedings, ITSC, Washington, DC, USA, 5–7 October 2011; pp In Proceedings of the 7th ACM Conference on Sensor Systems Embedded in Networks, SenSys 2009, Berkeley, CA, USA, 4–6 November 2009; page
In Proceedings of the 10th International Conference on Mobile Systems, Applications, and Services (MobiSys’12), Low Wood Bay Lake District, VK, 25-29 juni 2012; pp. In Proceedings of the 7th ACM International Conference on Mobile Systems, Applications, and Services (MobiSys’09), Krakau, Polen, 20-25 juni 2009; pp. In Proceedings of the Annual International Conference on Mobile Computing and Networking, MOBICOM, Parijs, Frankrijk, 7–11 september 2011;.
In Proceedings of the Annual International Conference on Mobile Computing and Networking, MOBICOM, Istanbul, Turkey, 22–26 August 2012;. An Overview of Architectures and Challenges for Mobile Crowdsourcing: Towards Crowd-Empowered Internet-of-Things.IEEE Access. In Proceedings of the Conference on Object-Oriented Programming Systems, Languages and Applications, OOPSLA, Orlando, FL, USA, 25–29 October 2009; pp.
In Proceedings of the International Conference on Mobile Applications, Services and Next Generation Technologies, Prague, Czech Republic, 25–27 September 2013;. In Proceedings of the 8th International Conference on Mobile Systems, Applications and Services (MobiSys'10), San Francisco, CA, USA, 15–18 June 2010; p. In Proceedings of the 6th International Conference on Mobile Systems, Applications and Services (MobiSys'08), Breckenridge, CO, USA, 17–20 June 2008; p.