I understand that the British University in Dubai may make a digital copy available in the institutional repository. In the aim also to reveal more details about cryptocurrency price behavior, at the same time examining cryptocurrency relationship with Gold can give us with.
INTRODUCTION
- Overview
- Motivation and Research Problem
- Motivation
- Research Problem
- Aims and Objectives
- Research Questions
- Can we predict 15 days’ cryptocurrencies closing price?
- Can Cryptocurrency provide hedging “safe haven” such as gold?
- Is there (short-long term) relationship between cryptocurrencies and financial
Therefore, there are still many areas of cryptocurrency that are still uncovered that require many research papers to target this new digital financial technology, so in this article we aim to participate in revealing the behavior of cryptocurrency prices compared to economic trends such as stock market indices , oil and gold. Additionally, this study aims to provide 15 days cryptocurrency price prediction by analyzing historical crypto data using time series analysis ARIMA model to provide the future.
LITERATURE REVIEW
Background
- Digital, Virtual, vs Cryptocurrency
- Cryptocurrency
- Cryptocurrency in the Market
- Importance of Cryptocurrency
- Cryptocurrency financial reporting (Accounting View)
- Advantage and Disadvantages of Cryptocurrency
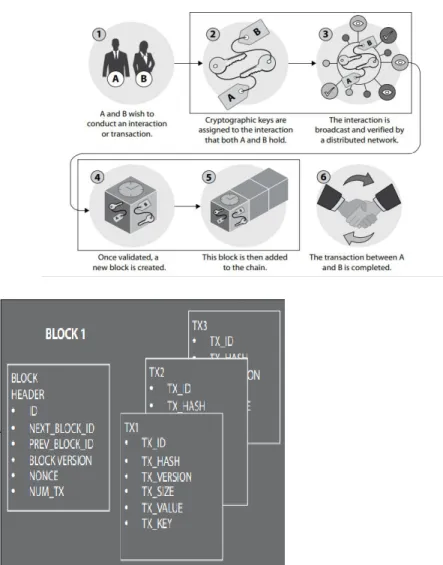
- Blockchain Technology
- Price Determinant of Cryptocurrencies
- Bitcoin And its Functionality
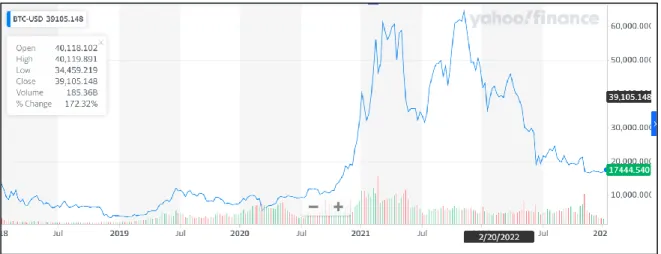
Between May and June 2021, there was a significant decline in the overall market value of cryptocurrencies due to the reduced likelihood of digital coins being used as an investment vehicle. This resulted in a significant drop in the value of the cryptocurrency market, Bitcoin for instance lost 50% of its value. There is an emergence of businesses in the current economy associated with the use of bitcoin and other cryptocurrencies in operations, investments and general transactions. While testing the intangible asset (Crypto in our case) for “impairment loss” once applicable, the intangible asset (Crypto) should not increase its value in case of price increase.
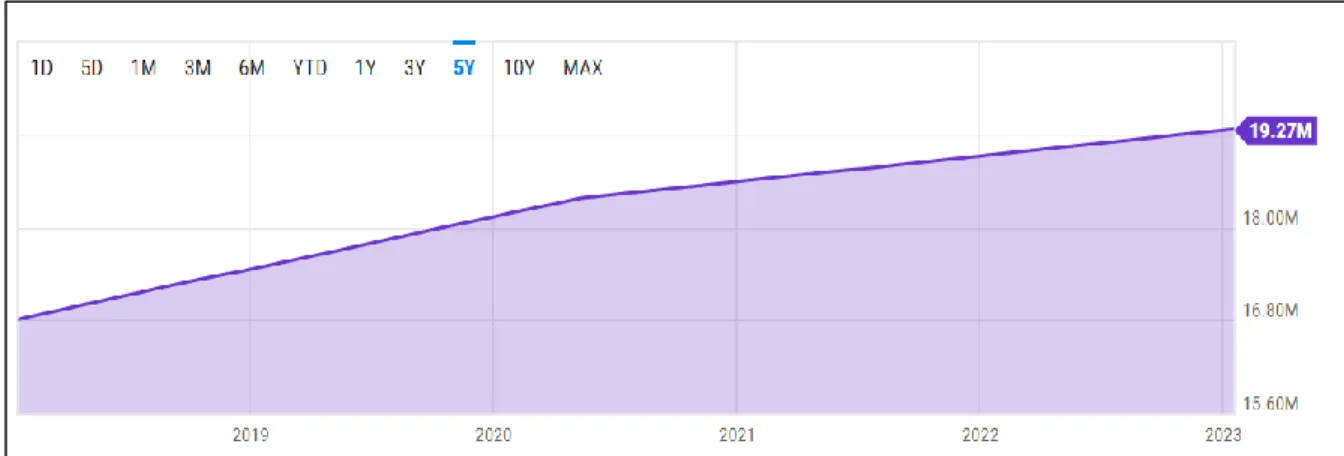
Cryptocurrency market has grown rapidly over the past decade, below are highlights of cryptocurrency pros and cons (Kishor P. Cryptocurrency circulation refers to the number of cryptocurrency available in the market to buy or sell, as some cryptocurrencies have a limit like Bitcoin with 21 million while others have not, Bitcoin mined coins reached 19.27 million as of January 2023 (ycharts.com).
Current State of Related Research
- Cryptocurrency Price Prediction & Determinant
- Cryptocurrency Hedging Capabilities
- Cryptocurrency Bubble and Gambling
Conlon, et al., 2020) took the opportunity during their study to examine the falling stock market due to the Covid-19 pandemic, which they consider to be the first stock market challenge since the rise of cryptocurrency. On the other hand, (Nguyen Phuc Canh, et al.2019) studied the capabilities of 7 largest market caps for cryptocurrencies, including Bitcoin and Litecoin, to hedge against risks arising from five economic factors including oil, gold, interest rates, USD and S&P500. Chemkha, et al. 2021), they examined the hedging capabilities of Bitcoin and gold against four stock markets, including S&P500 &.
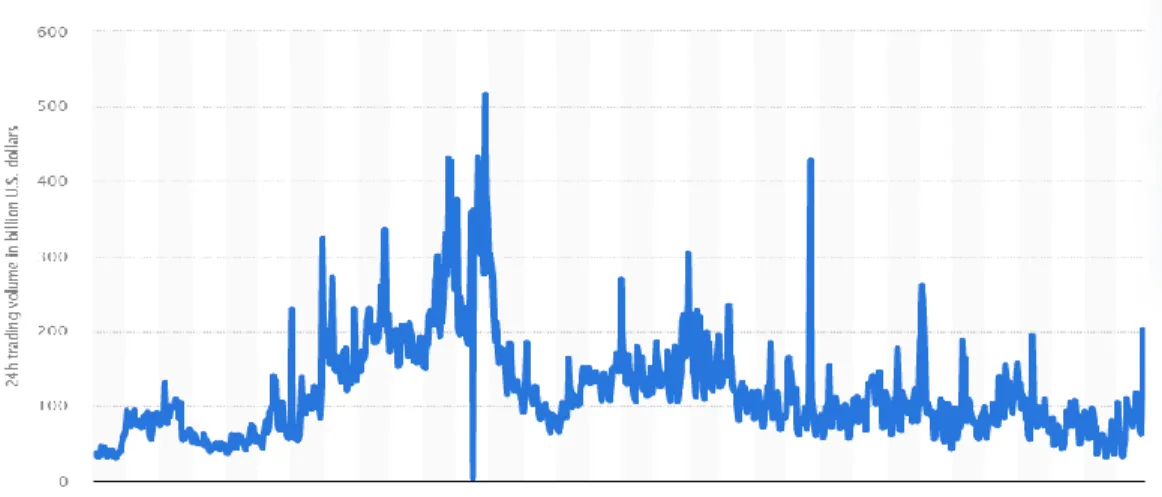
Khurram Shehzad et al.2021) they did a study to compare 'save haven' ability between Bitcoin and gold during Covid-19 turmoil, they used "Morlet Wavelet Approach" they found Gold has better performance as Bitcoin, it partially disagrees (Shehzad). They also found that bubble can be detected during high volume and volatility in crypto trading.
DATA AND METHODOLOGY
- Data Collection
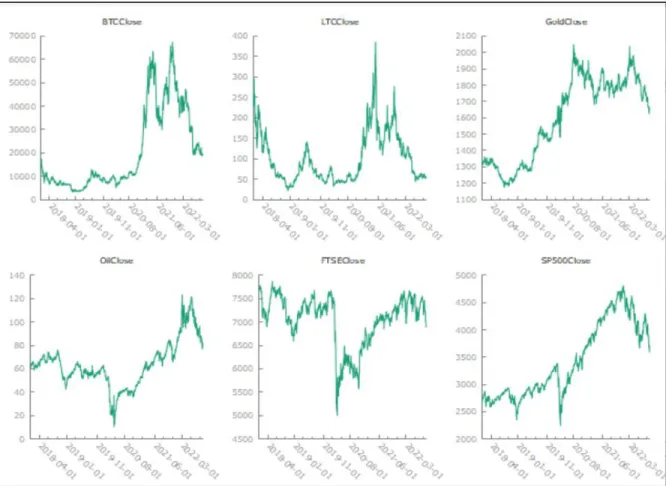
- Variables Selected
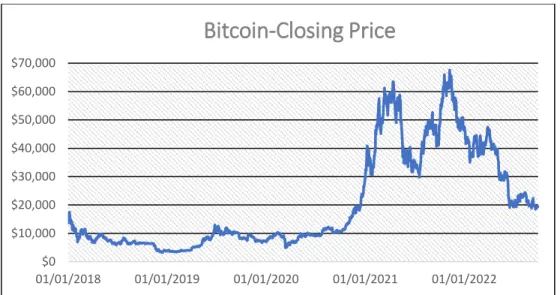
- Bitcoin Closing Price
- Litecoin Closing Price
- S&P500 Index
- FTSE 100 Index
- Gold Price (COMEX)
- Oil Closing Price
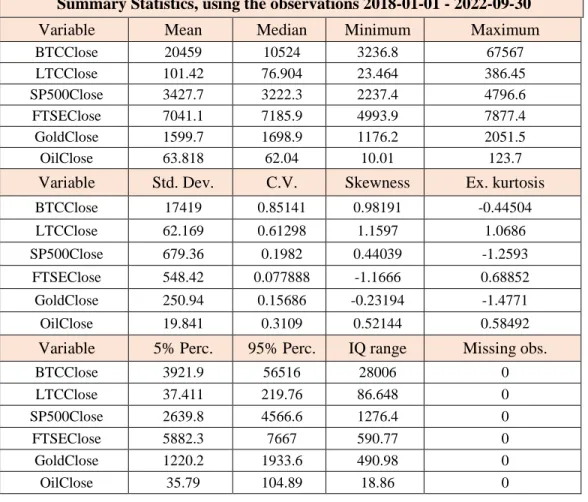
- Statistical Summary
- Methodology
- Granger Causality
- Vector Autoregression (VAR)
- Cointegration &Vector Error Correction Model (VECM)
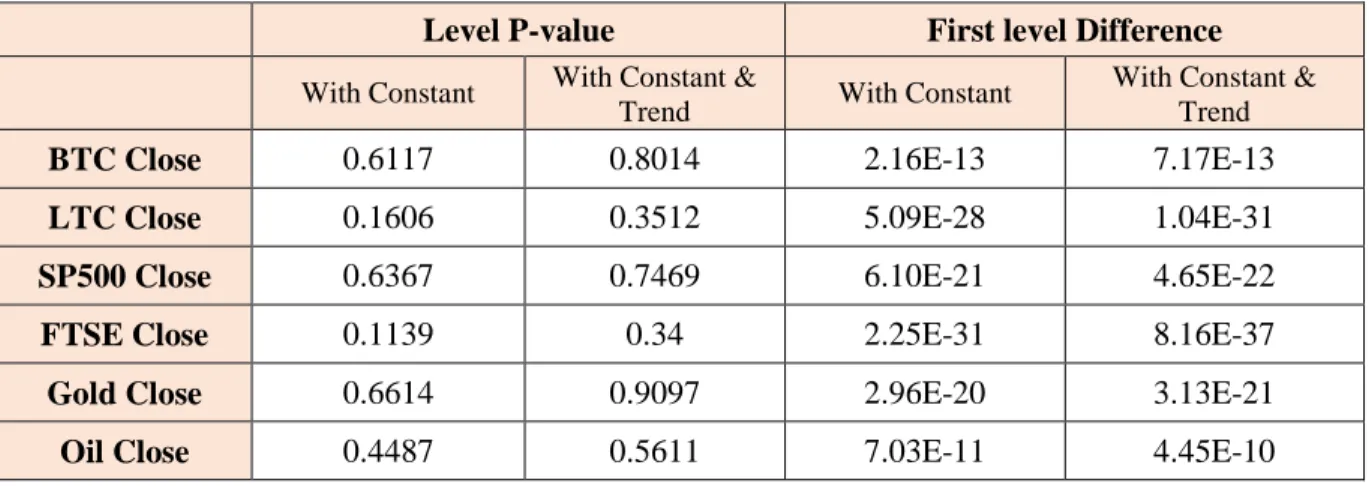
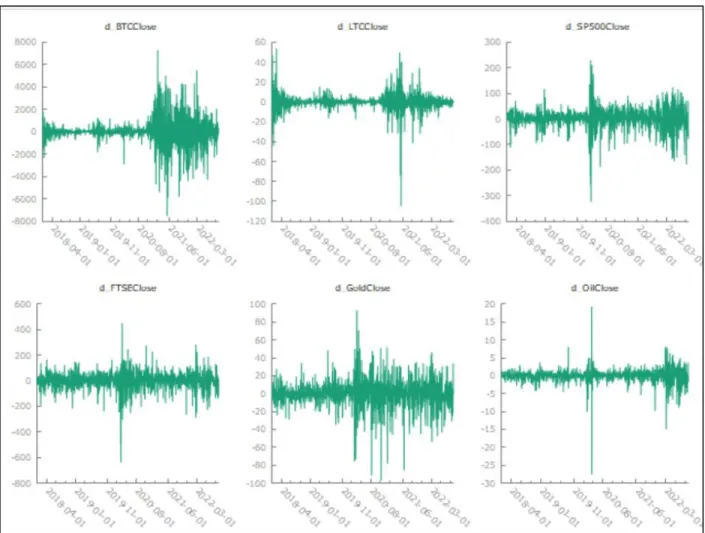
Autoregressive Integrated Moving Average (ARIMA) is a statistical time series model used in forecasting. It looks at the past values and trend to predict future values. It is widely used in many fields, especially in stock price forecasting. ARIMA name refers to the three components used in the model, (AR) Autoregressive where the model uses past values of the variable itself to predict its future value, (I) integrated refers to the level of difference required to transform the raw data to stationary data, but if the raw data turns out to be stationary at level, then the model is changed to ARMA instead of ARIMA, last is (MA) Moving average refers to error terms from the previous point in time that was used to predict future observations (medium.com). Granger Causality is an important tool used in analyzing time series data. It is first proposed in (1969) by Prof. Clive W.J.
Cointegration refers to long-term relationship between time series variables where the same random (stochastic) upward and downward trend affects them jointly, where they are both not stationary at level, but the difference between them is stationary in the long run, this general trend called cointegration (Kilian , Lütkepohl, 2017, Cambridge Press). Vector Error Correction Model (VECM) on the other hand is a multivariate time series it is extended to Vector Autoregression (VAR) where it detects the long term relationship (error correction term) as well as short term, VECM model is widely used in finance and macroeconomics.
RESULT DISCUSSION
Autoregressive integrated moving average (ARIMA)
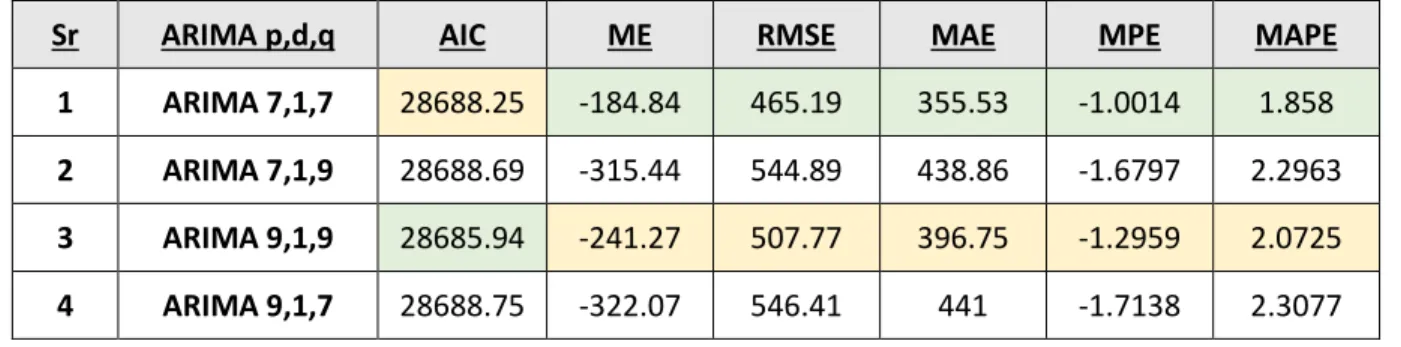
So using Bitcoin difference level correlogram figure (9) above, we can detect the spikes outside the 95% confidence intervals, so the correlogram suggests that we have ARIMA with 25 p,d,q However, the use of Gretl software is limited to a maximum of 10 lags so we are going to consider only 7 and 9 for p and q which provides us with four orders of ARIMA, therefore we have to estimate the best model using Akaike Criterion (AIC), Mean Error (ME), Root Mean Squared Error (RMSE) ), Mean Absolute Error (MAE), Mean Percentage Error (MPE) and Mean Percentage Absolute Error (MAPE), below table No (5) showing the results. The analysis of the results above for Bitcoin forecast showing that ARIMA 9,1,9 provides the lowest AIC, but ARIMA 7,1,7 provides the lowest error statistics especially RMSE with 465.19 and mean percentage error (MPE) with only 1% , hence we will consider ARIMA 7,1,7 is the model that provides the best estimate for Bitcoin 15 days forecast. The below Figure No (10) showing 15 days Bitcoin closing price forecast vs actual values using ARIMA 7,1,7 showing very close forecast to actual value, and Figure No (11) showing the actual vs predicted plot for all Bitcoin data shows being used.
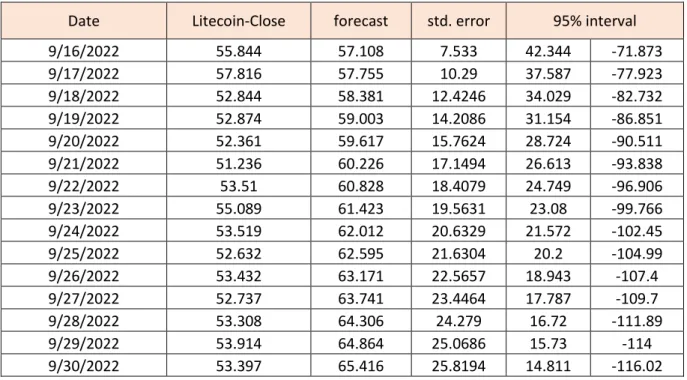
We will repeat the same steps above to test if the ARMA model can provide a significant forecast for Litecoin, since we already know the stationary level of Litecoin as the 1st difference level, so i will be 1, we need to estimate p and q using ACF and PACF from correlogram plot which suggests that 1,4,6,8 and 10 refer to Litecoin Correlogram figure no (12) below. Analyzing the results above for Litecoin forecasts shows that ARIMA 10,1,10 gives the lowest AIC, where ARIMA 8,1,10 ranked 3rd level AIC, but ARIMA 8,1,10 gives the lowest error statistics especially (RMSE ) with 1.8265 and lowest (MAE) with only 1.47%.
Granger Causality Result
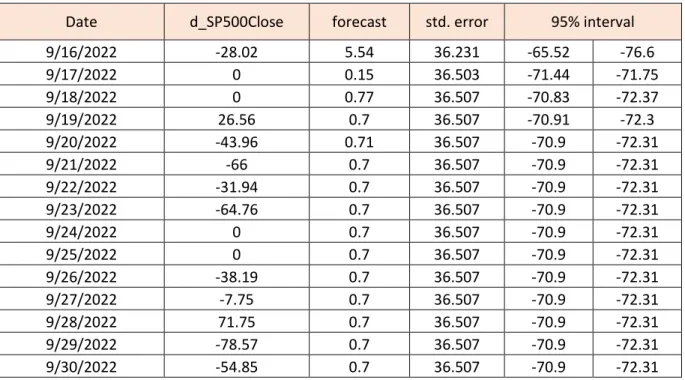
The null hypothesis for Granger causality is "No Granger causality exists" which can be held constant or rejected considering the P-value generated by the VAR model refer to table (7) for the P-value result, Granger causality can be Uni or Bi direction since past values of one variable may help to better predict the other while the opposite may not be true, refer to the results column of table (7) as the direction of causality mentioned there. Considering the results of the Granger causality test on the null Hypothesis remains constant or was not rejected (Granger causality does not exist) for all variables except Bitcoin and Litecoin which have unidirectional Granger causality with the S&P500 that accordingly - up to this point- we can say that the closing price of Bitcoin and Litecoin can improve the S&P500 forecast, so to test how Bitcoin can help to better forecast the S&P500, we tested the model to forecast the S&P500 15 days, but we find the model provides a prediction far from the current reference d-S&P500 below in table no (8) for the results. In light of the above S&P500 forecasting error estimation results, we can ignore the Granger causality result that Bitcoin Price Granger-causes the S&P500 even if the test shows the P-value less than 5%.
Similarly, since d-Litecoin also causes Granger d-S&P500, we will estimate Litecoin's fit to improve or help predict 15 days of S&P500 using the VAR model, see table. To re-evaluate the prediction, we use the error stats previously used to evaluate d-bitcoin, again the error stats results that show large error scores, accordingly we can ignore the Engle Granger causality result that causes the Litecoin closing price Granger- S&P500, even if the test shows a P value of less than 5%.
Cointegration Test & Vector Error Correction Model (VECM) Result
The forecast numbers for Litecoin show high error scores for 15 days despite the RMSE score being 8.4 but once this error compares the average value of Litecoin it is considered high and this is clearly reflected in MAPE with 15%, accordingly we will consider the model is not suitable to predict Litecoin. Nevertheless, we will also test the ability of the VECM model to forecast 15 days of S&P500, as the forecast is presented in Table No. (14) and error evaluation statistics in Table (15) below.
CONCLUSIONS
Main Conclusions
As an implication of this, we consider that cryptocurrency does not follow the market trend in both directions, therefore, crypto investors should avoid investing in crypto based on changes in the economy and stock markets. Safe haven for its investors the same as gold, the empirical findings causality and cointegration in this research show that the behavior of cryptocurrencies (Bitcoin and Litecoin) was found statistically different from gold in the short and long term, hence we can conclude that crypto- currencies cannot be accepted as a 'safe haven' nor able to provide hedging like gold capabilities during recessionary times, considering that Gold is considered one of the best hedging instruments during recessionary times, these study results are not in line with much previous literature. such as (Alhonaita, 2022) (Elie Bouri et al.2019) and (Chemkha, 2021) which support that crypto can provide hedging the same as gold, so this study suggests investors not to include cryptocurrency in their portfolio with the aim of against entrenchment too . The conclusions highlighted above in this study will participate in a better understanding of cryptocurrency price behavior, characteristics and its forecast, as well as its relationship with financial stock markets, especially crypto market has had very high volatility, which can cause billions of dollars to disappear have that affect all economies, this research has contributed to fill the gap of conflicting research results for a better understanding of cryptocurrency price.
Study Limitations
Future Research
Grushack, J. (2014) ken ni. Kuarta a Mangsuksukimat iti Digital a Kripto a Kuarta, Merkado.Cs.Union.Edu, Hunio.https://cs.union.edu/Archives/SeniorProjects/2014/CS.2014/files/grushacj/grushacj_pa kada .pdf. Darko Vuković, Moinak Maiti, Zoran Grubišić, Elena M. Ti merkado ti crypto ket maysa a natalged a pagkamangan. Mas affordable ti balitok ngem ti bitcoin kabayatan ti panagraira ti COVID-19.
Mohil Maheshkumar Patel, Sudeep Tanwar, Rajesh Gupta, Neeraj Kumar, (2020), A Deep Learning Based Cryptocurrency Price Prediction Scheme for Financial Institutions, Elsevier. Livieris, Stavros Stavroyiannis, Theodore Kotsilieris and Panagiotis Pintelas, (2020), Exploring the Cryptocurrency Price Prediction Problem: A Deep Learning Approach.