According to the IMF, global economic growth in 2015, with real GDP falling by 3.1 percent, compared to growth of 3.4 percent in the previous year. Growth in the world's advanced economies remained relatively stable, at a slow but sustainable pace, growing by 1.9 percent.
The Global Economy: Trends, Risks and Growth Outlook
Recent Trends
Real GDP growth in the US slowed to a 1.4 percent annual rate in the fourth quarter of 2015. Growth in India in 2015 appeared to outpace China's, recording a 7.3 percent rate of expansion for the year.
Global Financial Developments and Financial Stability Risks
The decline in the non-fuel sectors has not been as severe with a drop of 17.5 percent. Actual production reacted very slowly to the lower prices; in fact, according to the IEA, non-OPEC production hit a new all-time high in November 2015 before falling by more than a million barrels per day over the next three months.
Global Growth Outlook
With regard to the possibility of the UK leaving the EU, the IMF baseline forecast used in this report assumes that the UK will vote in a referendum on June 23 to remain in the European Union. However, this negative outcome would require a combination of financial policy mismanagement and a deadlock in post-Secession trade talks.
The Saudi Economy: Trends, Risks and Growth Outlook
- Growth and Inflation Trends
- Monetary Developments
- Monetary Aggregates
- Reserve Assets
- Fixed Exchange Rate Policy
- Interest Rates
- Fiscal Developments
- Labor Market Performance
- External Sector Performance
- Saudi Economy Growth Outlook and Risks
The Saudi Economy: Trends, Risks and Growth Prospects and Macro-Financial Linkages in Saudi Finance. The exchange rate of the Saudi riyal against the US dollar remained relatively stable in the spot market.
Banking Sector: Operating Efficiency, Risks and Resilience
- Overview
- Balance Sheet Assessment - Banks Assets
- Bank Credit
- Corporate Lending
- Consumer Lending
- Real Estate Lending
- Maturity Distribution of Bank Credit
- Balance sheet assessment – Banks Liabilities
- Bank Deposits
- Off-Balance Sheet Operations
- Foreign Currency Exposure
- Banking Sector Resilience
- Profitability
- Regulatory Capital and Asset Quality
- Liquidity
- Leverage
- Risk Outlook of Banking Sector
However, the share of foreign assets increased in 2015, representing 14.3 percent of total assets from 11.8 percent in the previous year (Chart 3.3). The weight of credit for the corporate sector in total bank credit increased during 2015, reaching 57.7 percent compared to 56.3 percent in the previous year. The ratio of non-performing loans (NPL) for consumer loans and credit card loans was 0.7 percent in the fourth quarter of 2015.
The decline in the growth of property loans can be traced back to several factors. Although demand deposits have recorded strong growth in recent years, 2015 showed a negative growth of 1.3 percent (graph 3.17). Banks' off-balance sheet operations grew by 4.1 percent in 2015 compared to a growth of more than 22 percent in the previous year.
This conservative approach has helped the banking sector remain resilient to volatility in the global financial system. While non-performing loans in the trade and service sectors continued to decline, accounting for about 8 percent and 5 percent of total credit respectively. The fund, introduced by SAMA, will strengthen confidence and minimize contagion and liquidity risk in the banking sector.
Non-Bank Credit: Recent Trends and Initiatives
Overview
Performance of SCIs
- SCI Assets
- Credit Extended by the SCIs
These ratios are above the average of the previous five years, namely 10.9 percent of total GDP and 19 percent of non-oil GDP (Chart 4.3). When analyzing the percentage share of disbursed loans, it is important to realize that most loans are aimed at real estate and large-scale projects. Total loans from the Real Estate Development Fund amounted to SAR 27.5 billion in 2015, equivalent to 39.4 percent of total loans.
Total loans disbursed by the Saudi Credit and Savings Bank amounted to SAR 13.3 billion in 2015, equal to 19.1 percent of the total. Total loans disbursed by the Public Investment Fund in 2015 amounted to SAR 18.6 billion, which is equal to 26.8 percent of the total amount. Total loans disbursed by the Saudi Industrial Development Fund in 2015 amounted to SAR 9.4 billion, equivalent to 13.5 percent of disbursed loans.
Finally, the total loans disbursed by the Agricultural Development Fund amounted to 842 million in 2015, equivalent to 1.2 percent of disbursed loans (graph 4.4).
Non-Bank Finance Sector
- Finance Company Assets
- Finance Company Credit Extended
- Finance companies Resilience
- Profitability
- Leverage
- Risk Outlook of Finance Companies
- Overview of Policy Measures
SAMA's leverage regulations state that the amount of real estate loan granted to companies cannot exceed five times the company's capital and reserves. On the other hand, the level of financial leverage of real estate companies is stable at 1.7. SAMA has revised the loan-to-value (LTV) ratio for real estate finance companies due to ongoing policy adjustments.
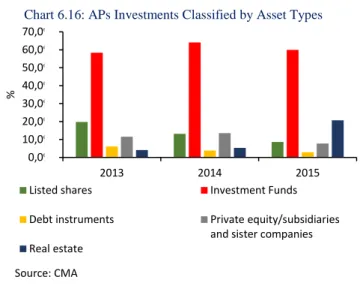
Property companies' leverage must not exceed five times the company's capital and reserves (Could be exceeded upon approval). Non-property companies' leverage may not exceed three times capital and reserves (Can be exceeded . upon approval). According to the PPA's annual statistical report published in 2014, their main investments are in the financial, petrochemical and property development sectors (Figure 1).
GOSI invests in five main categories, namely, financial investments, securities, loans, shares and real estate projects.
Insurance Sector: Performance, Coverage and Resilience
Overview
Health and motor insurance continued to dominate insurance activities, accounting for 81.6 percent of total GWP. Despite the dominance of the top three players, several companies have started to gain additional market share. The current retention ratio of the Saudi insurance industry reflects less reliance on the reinsurance market.
The low reliance on the reinsurance market indicates that most of the market risk has been taken over by insurance companies. While the health and motor insurance businesses that accounted for 81.6 percent of overall GDP ended up with high retention ratios of 96 percent and 91.8 percent respectively, in 2015, retention ratios were significantly lower for the rest of the insurance lines reaching a level as low as 2.0 percent for energy and aviation insurance (Chart 5.7). Health and motor insurance retention ratios are expected to be higher given the demand for these lines of business.
The Saudi insurance industry as a whole has easily met the requirement of a minimum 30.0% retention ratio set by Article 40 of the Insurance Implementation Regulations for the entire insurance sector.
Performance
A downward trend in the loss ratio indicates an improvement in the efficiency of insurance companies' insurance operations. The average claims ratio, which is defined as the ratio of total net claims to net earned premium, improved slightly from 80 percent in 2014 to 79 percent in 2015. However, the improvement is moderate and the ratio remains relatively high, indicating that there is there is scope for further improvements in underwriting standards to manage market risk and reduce net claims (NCI).
On the other hand, the cost ratio, defined as the ratio between total operating costs and net premium income, increased moderately, but remained below 10 percent, which indicates operational efficiency at the industry level (Graph 5.10). Given the dominance of a few large firms, there is a need to restructure small firms. Therefore, it seems highly desirable for these failing companies to scale up through mergers and acquisitions (M&A) or recapitalization.
This was largely due to their preference in choosing the recapitalization route, opting for additional share issues, largely facilitated by the supportive liquidity conditions in the capital market.
Resilience
SAMA's provisioning policy has ensured adequate provisions and further improved resilience of the insurance sector. Most notably, however, the links between the insurance and banking sectors have strengthened significantly, given the large increase in insurance company deposits in the banking sector. In 2015, deposits by the insurance sectors with financial institutions, mainly banks, represented more than 61 percent of total insurance investments (Chart 5.13).
In addition, ten out of the twelve local Saudi banks have significant stakes in insurance companies ranging from 20 percent to 30 percent of these companies' shares. Finally, since all insurance companies are publicly listed, such volatility can lead to valuation issues for the companies' shares in the market. SAMA introduced several new insurance regulations in 2015 as part of its regulatory role to ensure that any regulatory gaps and development of the insurance sector are closed.
The goal of the regulation is to establish high standards of corporate governance in the insurance industry in accordance with recognized international best practices.
Capital Market Stability
- Overview
- Capital Market Activities
- Market Legislation
- Government Energy Policy Reform
- Market Volatility and Risk
- Market Liquidity
- Shadow Banking
- Market Resilience
- Corporate Profitability
- Corporate Leverage
- Authorized Persons
- Capital Adequacy
- Profitability
- Liquidity
- Operational Risks of the Saudi Capital Market
Cases of imbalances have been registered mainly in some of the companies with small capital in the insurance sector. The asset value of public investment funds reached SAR 102.9 billion in 2015, representing almost 4.2 percent of GDP. In line with the sharp fall in oil prices, the overall profitability of the Saudi stock market decreased by only 2.5 percent to SAR 98.7 billion in 2015.
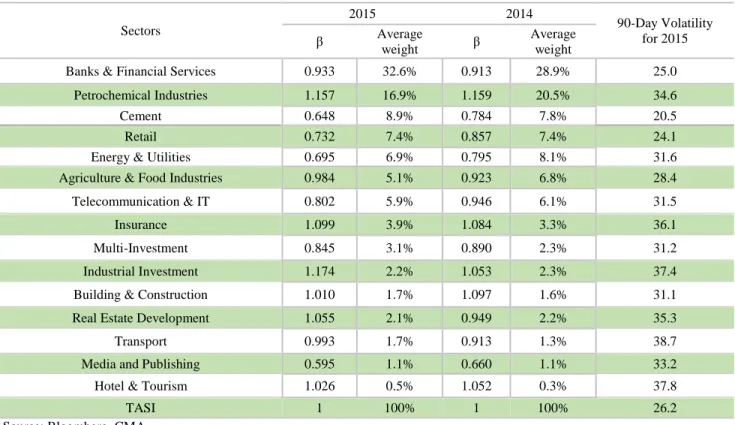
The last 5 years show that the petrochemical sector dominated 36 percent of total debt in the stock market, followed by the energy and utilities sector at 20 percent. The interest expense of the total market debt is covered 9 times by the total market income. The operational risk factors are crucial in determining the overall risk profile of the capital market.
The most important parts of the capital market operational risk are presented by Tadawul's operational risk profile.
Payment System: Recent Initiatives
- SARIE
- MADA
- SADAD Payment System
- Mobile Banking
The SADAD system is unique in terms of design and creativity as it is one of the world's first fully integrated centralized systems for Electronic Bill and Payment Presentation (EBPP) and similar payments in the Kingdom. The system enables a single connection with all domestic banks for the provision of payment services through all their channels (internet, telephone banking, ATMs and branches). This allows any billing entity to connect to all domestic banks and have access to all their customers in the Kingdom when connected to the system.
This allows any customer to pay commercial bills or pay for government and public services through any bank in the Kingdom. The number of billers who have signed up on the system is 146 from various industries, including 50 government agencies, and the number is growing. In the past year, the total number of accounts processed by SADAD was 172.4 million with a value of SAR 210.3 billion.
It was awarded the 2008 United Nations Public Service Award as the best government project in the category of Improving the Delivery of Services for the West Asia Region, due to its role in improving the public service in the Kingdom.