Introduction
Problem Statement
Current works are also lacking in terms of system performance (measured using various metrics, e.g., accuracy) when predicting student academic performance [23]. However, researchers have yet to develop an effective solution that can flag at-risk students (i.e., students at risk of failing or dropping out of a course) at an early stage so that educators can devise appropriate remedial actions and strategies to improve student performance.
Research Objectives
Objective One: To develop a customized rule-based warning system that accurately identifies the performance of students at risk. The system will take into account the various factors that may contribute to a student's poor performance and identify those at risk of failure.
Literature Review
- ML-based Student Performance Prediction
- Enhancing ML-based Student Performance Prediction 13
- Enhancing Students Performance Using
- Literature Summary
Some researchers have used students' demographic characteristics, e-learning system logs, academic data, and admissions information to predict student achievement [ 32 ]. 51] proposed a new stacking ensemble based on a hybrid of Random Forest (RF), Extreme Gradient Boosting (XGBoost), Gradient Boosting (GB) and Feed-forward Neural Networks (FNN) to learn dropout from predicting university classes. 64] analyzed the performance of four classification algorithms – J48, SimpleCart, Rep-tree, neural networks and decision trees – for assessing students' academic performance.
The authors proposed the use of multiple machine learning techniques to supplement the weaknesses of individual frameworks in predicting students' academic performance [64]. Technology-enabled learning platforms offer significant opportunities to analyze and leverage student data with the goal of offering personalized learning to prevent failure.
Research Gaps
This shift in focus highlights the need for a more comprehensive approach to understanding and addressing the challenges that at-risk students face in education systems. Most studies do not examine the effects of data quality and quantity on the overall performance of frameworks proposed for classifying at-risk students. The use of temporal characteristics to classify at-risk students has not been effectively used in existing studies.
Most studies used basic level ML methods to predict whether students are at risk. KGs can provide information about student performance throughout the course, and personalized remedial actions can be developed for at-risk students in a timely manner.
Summary
The next sub-section will explore the technical aspects of the proposed rule-based model for identifying at-risk students. The use of the knowledge graph was extended to the development of student rankings and classification of students at risk to provide a personalized learning-based approach to students at risk. The first research objective was to develop a tailored rule-based approach to classifying at-risk students.
Bag models were also tested for training and validation of the at-risk student classification solution. Zhang, “Identifying at-risk students in massive open online courses,” in Proceedings of the AAAI Conference on Artificial Intelligence, vol.
Methods and Results
Methodology
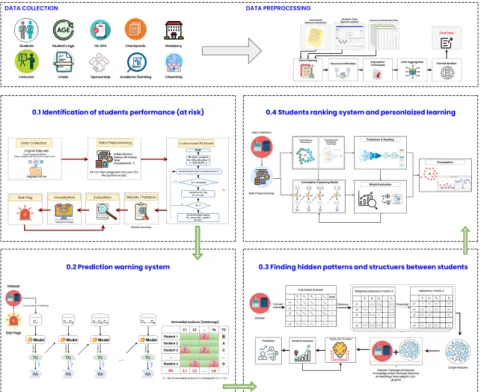
This section presents a method to identify and predict at-risk students using a rule-based model, ML. We developed a custom rule-based warning model that accurately identifies the performance of at-risk students. The model considers various factors that may contribute to a student's poor performance and identifies individuals at risk of failure.
We also built an explanatory ML-based framework capable of predicting the performance of at-risk students in the early stages of their course and identifying factors that influence student performance. Knowledge of these factors can then be used to inform the planning of appropriate remedial actions for at-risk students.
Data Collection
We then combine topological features of knowledge graphs with original data features to improve the prediction accuracy of the proposed student performance. These features can be used to improve the accuracy of the prediction solution and generate personalized learning methods based on knowledge graphs per student performance and abilities. In the current study, this involved adding to the solution developed as part of the previous objectives to rank students based on their performance and then generating personalized learning methods for each student based on their individual performance and abilities.
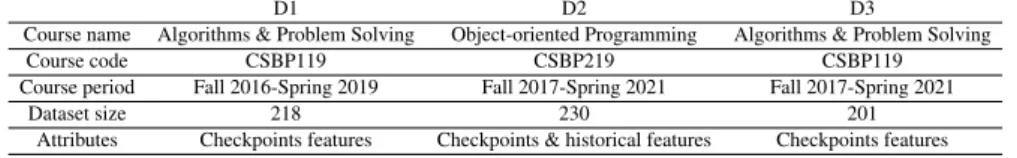
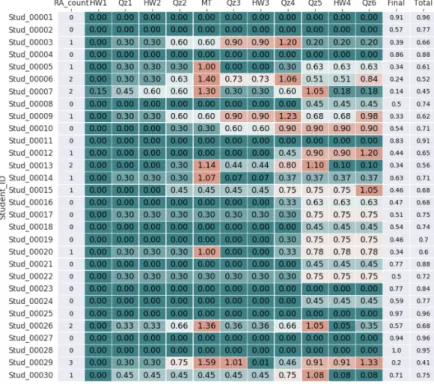
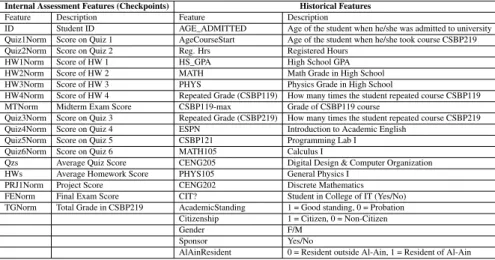
To classify students into high-risk and low-risk categories, data about student performance were collected from homework, quizzes, midterms, and finals. The way in which the data from the three datasets were used differed to some extent.
Data Pre-Processing
ID Student ID AGE_ADMITTED Age of student when admitted to university Quiz1Norm Score on Quiz 1 AgeCourseStart Age of student when taking course CSBP219. HW4Norm Score of HW 4 Repeated Grade (CSBP119) How many times the student repeated the course CSBP119 MTNorm Midterm Exam Score CSBP119-max CSBP119 course grade. Quiz3Norm Score on Quiz 3 Repeated Grade (CSBP219) How many times the student repeated the CSBP219 course.
Because different sections were taught by different instructors, data from some sections had to be varied until they were consistent across all sections to achieve homogeneity. For normalization purposes, all values were converted from categorical to numerical (binary) in the final stage of the data processing phase.
Evaluation Measures
It is a measure of the absolute difference between two continuous variables; it allows a clear understanding of the error between actual and predicted values and is often used for decision making in various communities. Suppose the size of the data set is n, the actual value is y, and the predicted value is ˆy. Pearson's correlation coefficient r, which is a statistical metric that describes the degree of linear correlation between two variables, was used to measure the correlation between models and actual results.
To assess the quality of the classification models, we use sensitivity, specificity, ROC AUC, accuracy and balanced accuracy metrics. Both metrics are important for evaluating the overall performance of a classification model and are often used in combination with other metrics.
Objective One: Identify At-risk Students Using
- Objective One: Method
- Objective One: Results and Discussion
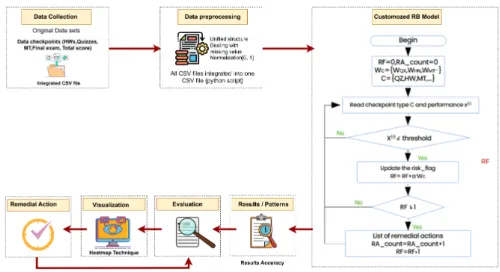
The model's output is a rule-based result that provides a weighted value that adequately determines whether the student falls into the category of at-risk or non-at-risk students. The student is labeled as being at risk if the threshold value falls below 0.7. Using the proposed framework developed for Objective 1, instructors will be able to identify at-risk students early in the semester to implement timely interventions.
In addition to this model, a visualization method based on a heat map was developed, which can effectively visualize the endangered landscape and the necessary remedial measures. Using the proposed model and visualization based on the heat map can allow the instructor to highlight different students who are at risk.
Objective Two: Hybrid Framework Using
- Objective Two: Method
- Objective Two: Results and Discussion
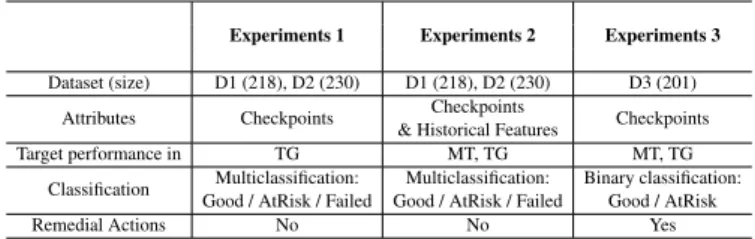
The proposed framework developed for the classification of at-risk learners and the identification of appropriate remedial action is outlined in Figure 2.5. The final output classified the different students into one of three categories: good, risky or failed categories. The data from several checkpoints were cumulatively added to train a hybrid model based on rule-based and explainable ML-based approaches for at-risk student classification.
In addition to creating a classification of those at risk, this approach identified appropriate remedial and intervention strategies at different stages of course progression, particularly addressing the weak. Recent research has reported the development of several models for identifying and categorizing at-risk students.
Objective Three: Graph-Based Deep Neural
- Objective Three: Proposed Method
- Objective Three: Results and Discussion
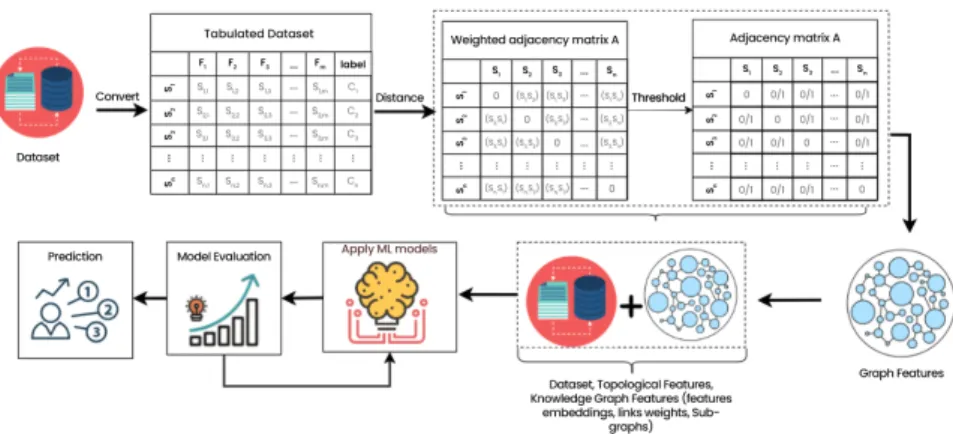
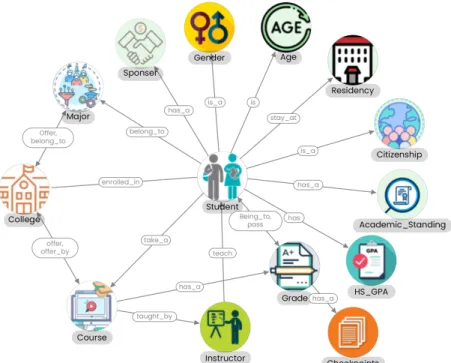
A knowledge graph based on the features of the proposed dataset was used to view the relationships between different features. The performance of different ML-based and GCN approaches was examined and compared with metrics such as accuracy, AUC, true positive rate (TPR) and true negative rate (TNR). The best performance of the ML-based model was provided by the Extra Trees classifier with an accuracy of 95% and an AUC of 99.5%.
In the final stage of the proposed model, the combination of original dataset features and topological features were trained and validated using GCN. Combining graph features with extracted dataset features improved the prediction performance of the ML algorithms.
Objective Four: Students’ Ranking
- Objective Four: Proposed Method
- Objective Four: Results and Discussion
To achieve Objective One, an adapted, rules-based approach was proposed to quickly identify at-risk learners. Personalized learning is also used to provide tailored recommendations to at-risk students to improve their course performance. This step-by-step approach enabled systematic improvement of the at-risk student identification solution.
Finally, Objective Four used cluster-based KGE and ML-based models to classify at-risk students. These insights can serve as additional features for classifying students at risk in addition to student performance.
Research Findings and Discussions
Research Strengths
Therefore, Objective One successfully achieved its goal of developing an at-risk student classification solution. Furthermore, objective Two achieved its goal of identifying at-risk students early in the course and providing personalized remedial strategies to help them improve. The primary goal of Objective Three was to improve the at-risk student prediction solutions developed in Objectives One and Two.
This measure effectively demonstrates the benefits and performance of different approaches to classifying at-risk students. The combination of cluster-based KGE features and ML-based features leads to an improvement in the accuracy of the student ranking approach, resulting in more accurate identification of at-risk students throughout the course.
Research Limitations
Sinha, "Early prediction of student performance using machine learning techniques," International Journal of Computer Applications, vol. Addison, "A Machine Learning Framework to Identify Students at Risk of Adverse Academic Outcomes," in Proceedings of the 21st ACM SIGKDD International Conference on Knowledge Discovery and Data Mining, 2015, pp. Alashwal, "A Systematic Literature Review of Student Performance Prediction Using Machine Learning Techniques," Education Sciences, vol.
Early detection of students at risk - predicting student dropout using administrative student data and machine learning methods," Available at SSRN. Lam, "Predicting at-risk college students in a virtual learning environment via a machine learning algorithm," Computers in Human Behavior, vol.
Conclusion