Islamic banking is a rapidly growing segment of the financial system in Saudi Arabia and has impacts on economic performance of great importance to economic growth. The Islamic banking activities also include investment accounts and other formal structures in the commercial banks of the modern economy. The available studies have mainly concentrated on the role of the Islamic banking system in the global economy.
Therefore, the study aimed to determine the impact of Islamic financial banking on economic growth in K.S.A. The study is of primary importance to ensure that there are better ways to conduct an analysis of the effects of IBF on macroeconomic growth in Saudi Arabia. When there are changes in the performance of a financial institution, the economy of the whole country reacts, with the eventual impact (Choudhry, 2017).
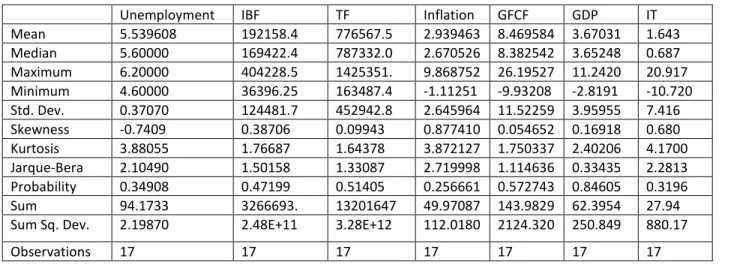
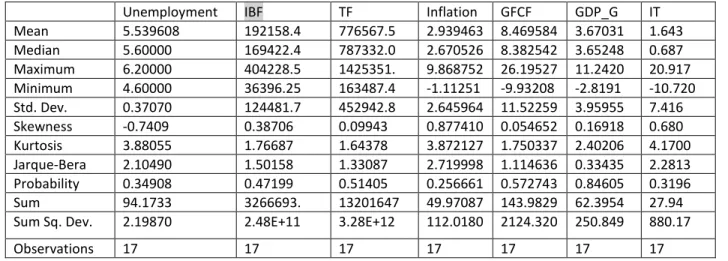
For effective functionality, the corporate sector is highly dependent on the activities of the banking sector. The methodology of the research examines the impact of IBF on the macroeconomic growth in Saudi Arabia. Based on the results of the Augmented Dickey-Fuller test, the data are stationary according to the results presented in Table 2 for (ADF) Level I (I).
The series can be considered as of the form, I (I) variables as suggested by the results presented in Table 2 for (ADF) 1. different I (I) that all data stationary.
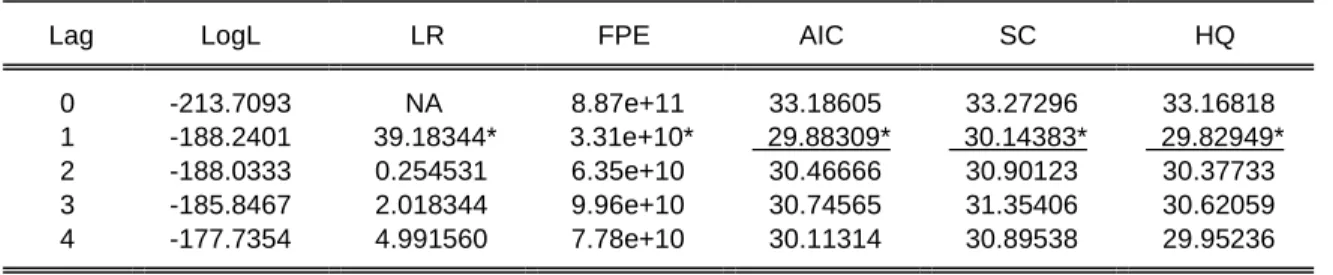
Lag Selection 31
VAR Lag Selection Criteria of GDP growth with TF, and IBF 31
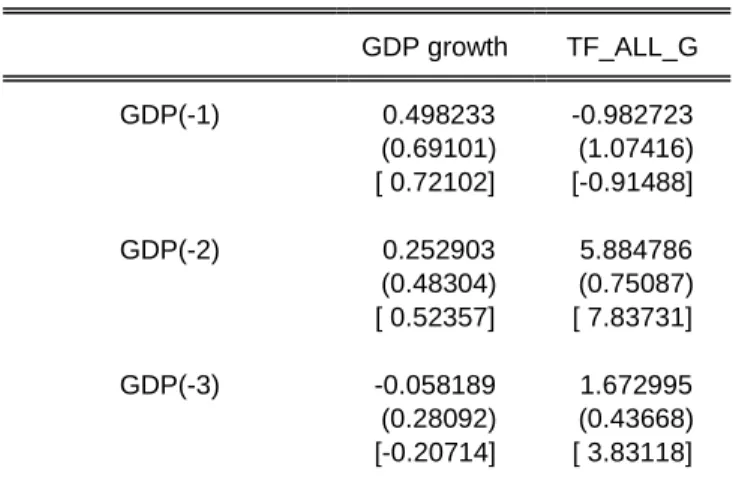
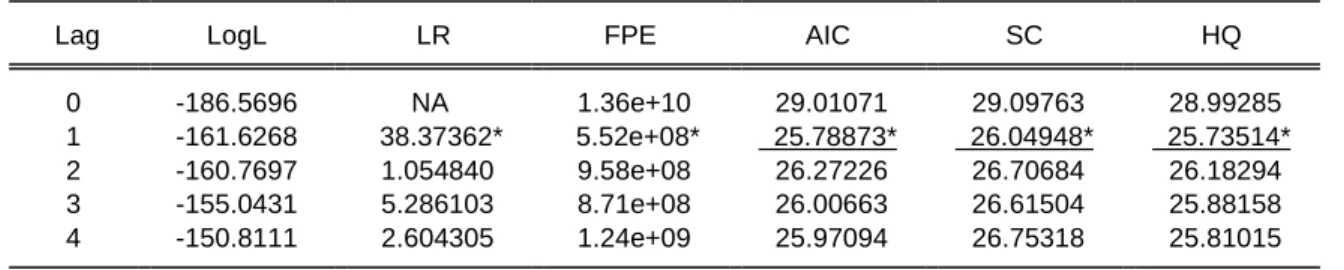
It is clear that the preformed unit root test is very significant, as shown in Table 2, it shows that all the variables used for this study will have rejected the null hypothesis in the process of unit root identification. All variables are stationary in nature because the VAR model requires stationary data to run it. Therefore, the results from the lag selection criterion have advised us to take 4 lags in the VAR model as the optimal lag to estimate GDP growth with TF and IBF as well.
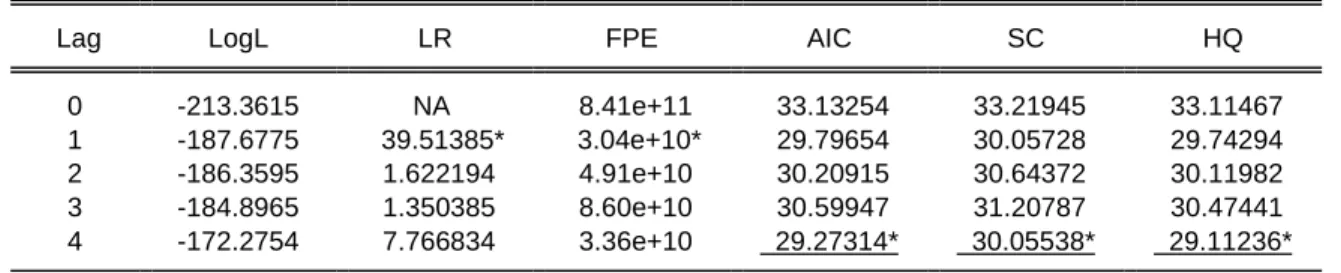
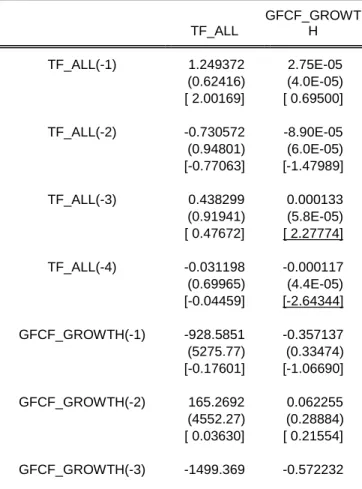
VAR Lag selection criteria of GFCF with TF, and IDF Table 4: The result of VAR Lag selection criteria (GFCF, TF).
VAR Lag Selection Criteria of GFCF with TF, and IBF 32
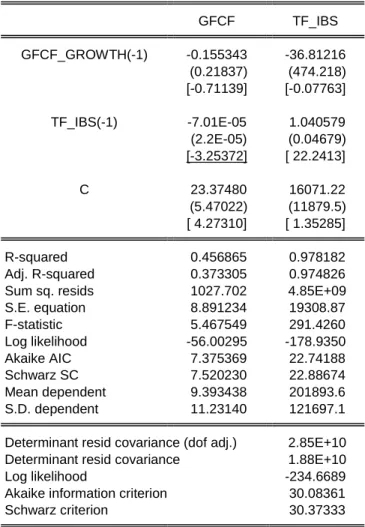
The results show from AIC and HQ for using 4 lags in VAR model from for this particular variable of estimation of GFCF and total financing. To get optional delays, the register structure of my variables is a register structure of one. Therefore, the results from the lag selection criterion have advised us to take a lag in the VAR model as the optimal lag to estimate only GFCF and IBF.
VAR Lag Selection Criteria of Inflation with TF, and IBF 33
The rest of the unemployment variable and the change in TF are significant in the opposite way. In the short run, the variance of IBF explained about 0.74 of the variance in GDP growth. In the short run, the variance of TF is explained by 5.42 in the 3 periods of the variance in GDP growth.
In the period four to ten, the variance of TF moved from 5.3 to about 8.0 percent or less to 7.1 percent of the variance in GDP growth. In the short term, the variance of IBF explained about 3.7 of the variance in IBF. In the period four to ten explained the variance of the IBF respectively. from 5.5 to 17.64 percent of.
In periods 2 and 3, the variance of TF explains from 6.0 to 22.45 percent of the variance in GFCF. In period four to ten the variance of TF explained respectively from 34.9 to 40.3 percent of the variance in GFCF. In the short run, the variance of the IBF explained about 0.3 of the variance of the inflation focus error.
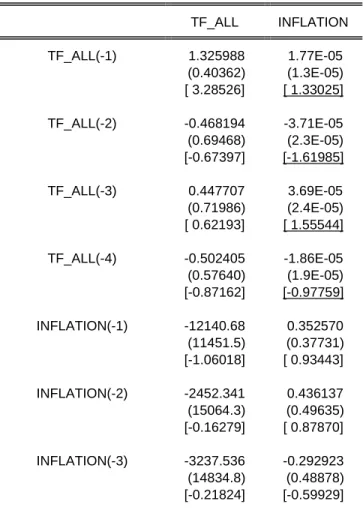
At the end of the short term, the variance of TF clarified about 11.5 percent of the variance in inflation. In periods four through ten, the variance of TF explained from 12.0 to 14.5 percent of the variance in inflation, respectively. In periods 2 and 3, the variance of IBF explained about 41.6 percent of the variance in international trade.
During the period four to ten, the variance of IBF explained around from 54.6 with slow decrease to 47.76 percentages of the variance in the IT. In period 2, the variance of TF is defined from 3.6 percent of the variance in international trade, and period 3 jumps to 12.8 percent. During the period four to ten, the variance of IT is explained by the variance between 10.5 to 8.2 percentages of focus error deviation in the IT.
In the short term, the variance of the IBF explained at the beginning of period 2 about 2.7 percent of the variance of the unemployment rate and in the subsequent period 3 going to 19.08 percent. In the short run, the variance of TF explained about zero of the change in the focus error in the unemployment rate. During period four to ten the variance of IBF explained respectively from 0.32 to 1.9 percent of the variance in the unemployment rate which means that the TF variable in the model has no effect on the unemployment rate.
Finally, the causality test to see the direction impact between the data of the variables in Saudi Arabia.
VAR Lag Selection Criteria of IT with TF, and IBF 34
VAR Lag Selection Criteria of Unemployment with TF, and IBF 35
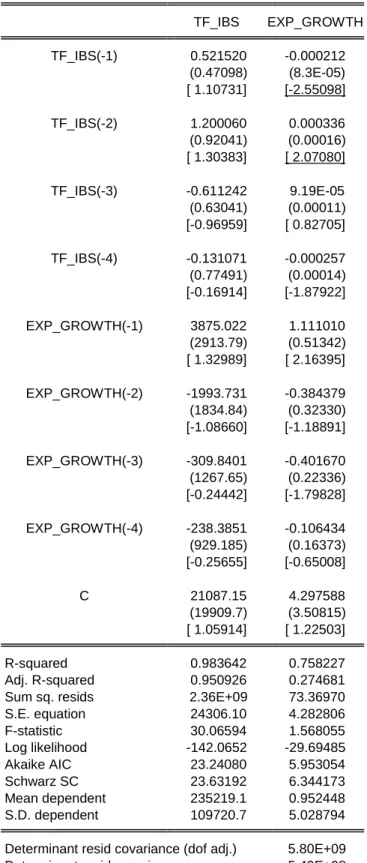
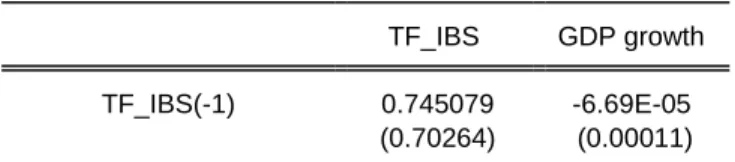
Therefore, the results from the lag selection criterion have advised us to take a lag in the VAR model as the optimal lag to estimate the unemployment rate and only TF. Therefore, the results from the lag selection criterion have advised us to take 4 lags in the VAR model as the optimal lag to estimate the unemployment rate and IBF only. From the above output, the estimates and t-statistic for TF data of the second lagged growth equation is 2.835 which is higher than two in GDP growth which is statistically significant.
This is the value that the dependent variable would take in the absence of interaction with the identified variables. Therefore, the three- and four-period delayed change in the TF has an effect on time changes on the BKF. Therefore, the p-value less than 5%, the one period delayed change in the IT has an influence on time changes in IT only.
These are therefore not necessary to explain the variation in today's changes in IT. Based on the output above, the t-statistics for IBF with resp. 3rd and 4th level significant in the unemployment rate, which are respectively It is time to perform the variance decomposition in the table below and also interpret the result.
It is clear that in the long run the IBF shock can contribute to gradual growth, but it still makes a weak difference in the variance of GDP growth. It is clear that in the long term, we see that the impulse of TF may contribute to growth gradually more than that of IBF. It is clear that in the long run, the TF impulse can contribute to gradual growth, but still there is a weak change in the inflation variance.
It is clear that in the long run the TF shock can still contribute to the weak change in IT variance. In the period from four to ten, the variance of the IBF explained exactly the same percentage, which is 33.0, except that the variance in the unemployment rate decreases slightly between these two periods. Only in this case, when using the 1st TF offset as given in the above table18.
This is because some of the required data may be difficult to find, such as international trade and Islamic banking products, which took time to manually collect and calculate.
VAR Model 36
The Granger Causality Test 61
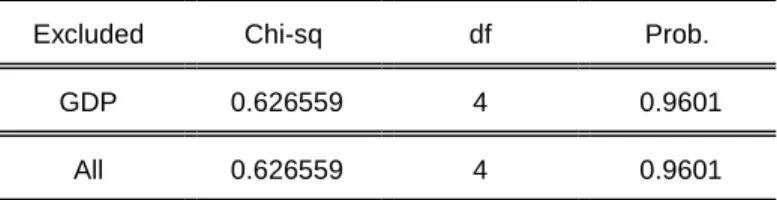
The independent variable does not Granger cause. Dependent variable Ho: GDP growth does not cause TF. Therefore, we reject the null hypothesis at the 10% significance level or it means that TF causes GDP growth. The independent variable does not Granger cause. Dependent variable Ho: GDP growth does not cause IBF.
Therefore, we do not reject the null hypothesis that mean IBF does not cause GDP growth. Therefore, we reject the null hypothesis at the 1% significance level, or it means that IBF causes GFCF. Therefore, we do not sufficiently reject the null hypothesis and conclude that the sample data support the fact that TF does not cause inflation.
Therefore, we do not sufficiently reject the null hypothesis and conclude that the sample data support the fact that IBS does not cause inflation. Therefore, we reject the null hypothesis at the 10% significance level, or it means that IBF causes IT. Therefore, we reject the null hypothesis at the 10% significance level, or it means that TF causes IT.
The independent variable does not Granger cause the dependent variable Ho: Unemployment does not cause IBF to grow. Therefore, we reject the null hypothesis at the 1% level of significance or this means that the IBF data granger the growth equation to cause unemployment rates. The independent variable does not Granger cause. Dependent variable Ho: Unemployment does not cause IBF growth.
Therefore, we reject the null hypothesis at the 5% significance level, or it means that unemployment Granger causes TF. However, the causality does not cause between financing and inflation in all cases with both IF and TF, but this negative result cannot be in the long run based on the review that IBPs lower the inflation rate. However, IF and TF have no impact on inflation because both are not significant in all cases of VAR estimations.
Recommendations 75
The Link Between Islamic Banking and Economic Growth: A VAR Panel Analysis for Organization of Islamic Cooperation Countries. K, (2013); “Role of Islamic Banking in Economic Growth” Journal of Finance Services of Research vol.