The purpose of this work is to study the vapor bubble condensation process and the enhancement technique by influencing the bubble dynamics using a grid structure. The mesh-based structure improvement method is based on breaking the bubbles into several smaller bubbles, thereby achieving a very large contact surface between the bubble and the liquid.
Introduction
- Motivation
- Objectives
- Thesis Methodology
- Thesis Structure
Furthermore, the obtained results have been investigated and compared with the bubble and flow field parameters obtained without the amplification condition. A parametric study is performed to evaluate the bubble behavior under different liquid and bubble initiation conditions.
Literature Review
Background
The cooling efficiency can be improved by increasing the cooling fluid velocity along the heat dissipation section. The two systems increase the heat transfer rate by increasing the surface area of the cooling.
![Figure 1: Heat pipe wick structure [4].](https://thumb-ap.123doks.com/thumbv2/azpdfco/10576100.0/27.918.231.789.513.798/figure-1-heat-pipe-wick-structure-4.webp)
Predictive Methods for Two-Phase Flow and Heat Transfer
In a jet cooling system, the cooling fluid is applied as a bulk fluid to the heat dissipation surface and in the spray system, the nozzle sprays the coolant in droplets [13, 14]. Furthermore, this technique can predict the flow field velocity distribution, pressure differences and overall flow dynamics.
![Figure 2: Simulation of bubble shape for single bubble during flow boiling in comparison with experimental results [20]](https://thumb-ap.123doks.com/thumbv2/azpdfco/10576100.0/30.918.355.626.124.683/figure-simulation-bubble-single-boiling-comparison-experimental-results.webp)
Two-Phase Computational Schemes
- Lagrangian Methods
- Interface-Capturing Methods
- Interface Front-Tracking
The most popular two-phase simulation method is the interface-capturing method, and this method adapts the Eulerian schemes to predict the behavior of the phases. The piecewise constant simple line interface calculation (SLIC) [25] assumes that the interface is oriented with perpendicular axis as shown in Figure 5.
![Figure 3: Lagrangian moving grid method [22].](https://thumb-ap.123doks.com/thumbv2/azpdfco/10576100.0/32.918.361.743.410.614/figure-3-lagrangian-moving-grid-method-22.webp)
Bubble Condensation Phenomena
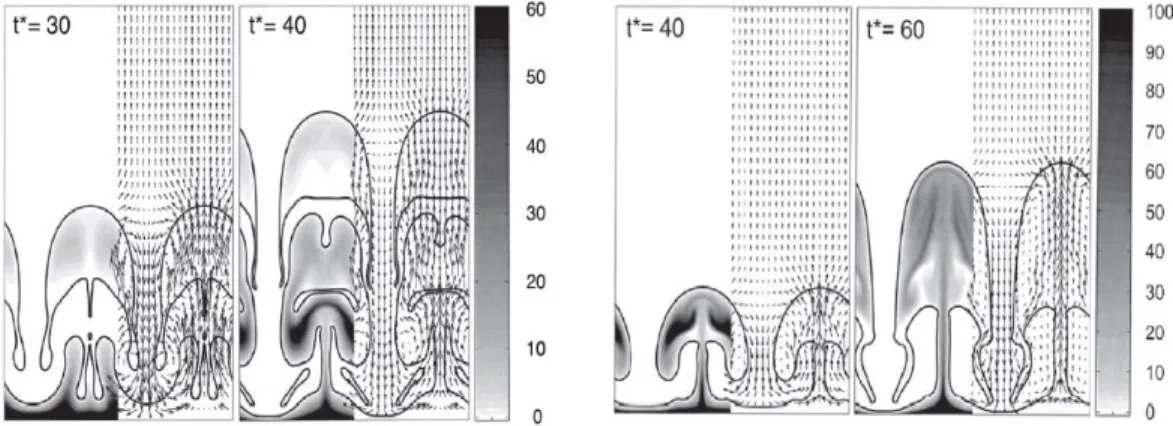
The study reported that system pressure, flow subcooling, and initial bubble size significantly affect bubble deformation. The simulation compares between the initial bubble shapes (circle, horizontal ellipse and vertical ellipse).
![Figure 9: Bubble’s collapse history [42].](https://thumb-ap.123doks.com/thumbv2/azpdfco/10576100.0/40.918.220.755.548.790/figure-9-bubble-s-collapse-history-42.webp)
Mathematical Model
Condensation Concept
Semi-empirical Mathematical Model
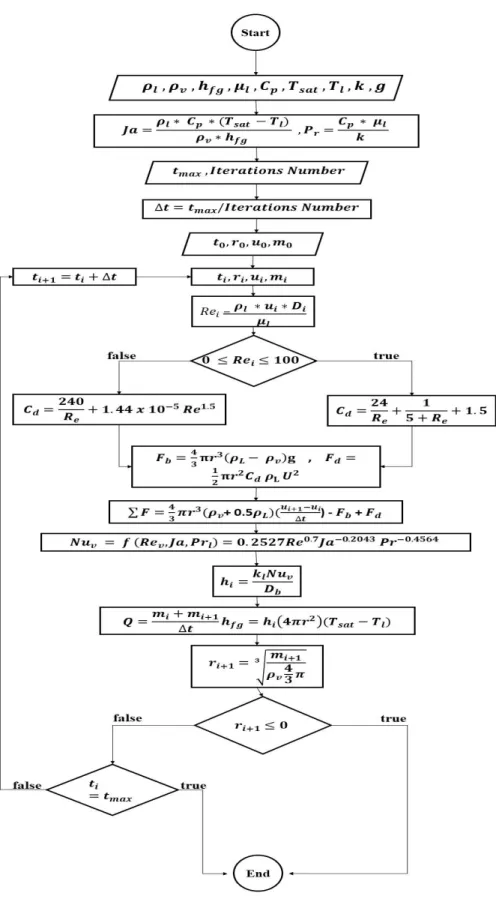
74]; this correlation can be used to calculate the drag coefficient for different range of Reynold numbers as shown in equations (3) and (4). The new speed will be calculated from the force balance based on the pulling force and the driving force.
Numerical CFD Model
- Wet Steam Model
- Euler-Euler Multiphase Models with Condensation
- Governing Equations of The Volume of Fluid Model
- Time-Dependent Heat Transfer Coefficient of Phases Interface in
- Mass and Energy Transfer
- Turbulence Model
In the Euler-Euler approximation, the volume fractions for each phase are introduced and assumed to be continuous functions of space and time. In ANSYS, Fluent introduced three different Euler-Euler multiphase models: the volume fluid model (VOF), the mixture model, and the Eulerian model, which will be described in the following sections. Nevertheless, this model has expensive computational power due to the complexity in capturing the physics of the flow.
The volume of fluid (VOF) model is a surface tracking approach where the interface region between the flow phases is of interest, this model tracks the volume fraction in each cell through the computational domain for all phases. The governing equations in the VOF model are solved based on the volume fraction in each cell along the flow domain. Solving the continuity equation (14) in the VOF model gives the ability to track the interface between the two phases.
𝑁𝑢𝑣 = 𝑓 (𝑅𝑒𝑣, 𝑃𝑟𝑙, 𝐽𝑎, 𝐹𝑜v,initial ) (25) where 𝑅𝑒𝑣's number based on bubble based on time, Reynoud is the Prandtl number of the liquid phase, 𝐽𝑎 is Jakob number and 𝐹𝑜v is initial. the Fourier number for the initial diameter of the bubble.
Semi-Empirical Mathematical Modeling Results
Bubble Configuration and Parameter
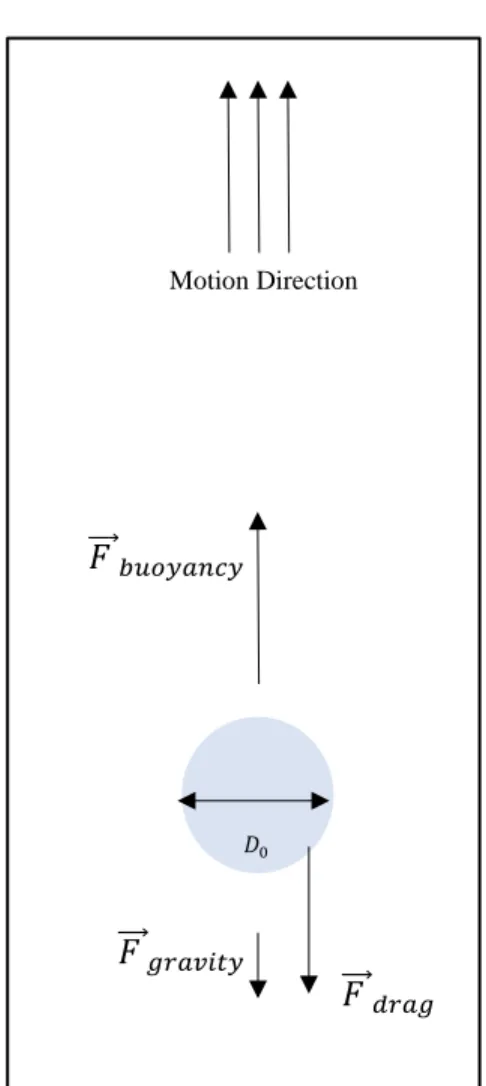
In this section, a spherical shape of a bubble in three-dimensional space domain is considered as an assumption for the analysis. The gravity effect is in the downward direction as shown in Figure 14, which is against the direction of the flow domain and the motion of the bubble. The dimensions of the liquid domain are assumed to be much larger than the size of the bubble.
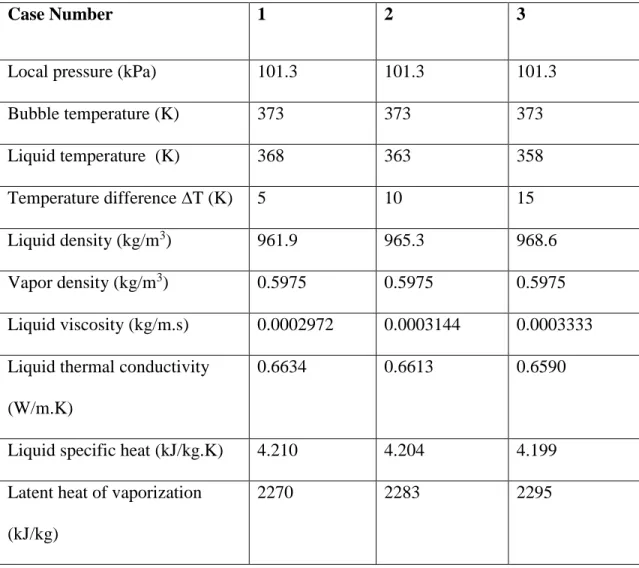
The calculations have been carried out for water-liquid and water vapor with the following conditions; three different temperature differences between the bubble and the surrounding liquid with fixed bubble initial diameter. In addition, the largest temperature difference is determined to perform the analysis for three different initial bubble diameters. The influence of dividing the total volume of a single bubble into smaller bubbles is also analyzed under the same conditions of saturation temperature 𝑇𝑠𝑎𝑡 = 373.2 𝐾 and temperature difference between the bubble and the liquid at ∆𝑇 = 15 𝐾.
Model Validation and Comparison with The Experimental Results
Parametric Study Simulation and Results
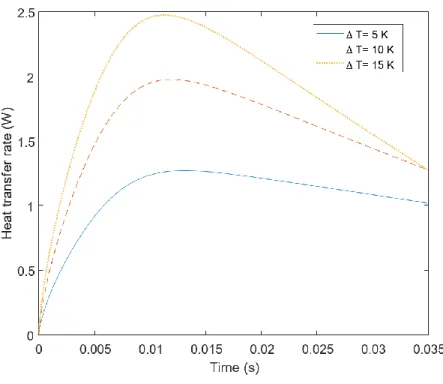
Bubbles with a large temperature difference have a higher heat transfer rate than others. As shown in Figure 19, the heat transfer increases rapidly from the initial time until it reaches the maximum value, and this is due to the increase in the bubble rising rate. Condensation then increases, causing a decrease in bubble volume and bubble surface area, which reduces the rate of heat transfer.
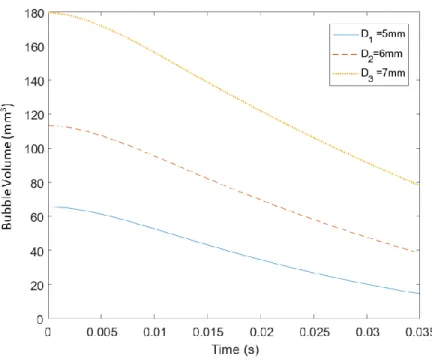
In the largest bubble 𝐷3 = 7 𝑚𝑚, a phenomenon to be noted is that the slope of the bubble volume over time has the highest negative slope, indicating a higher heat transfer rate compared to smaller bubble sizes. During the condensation process, the heat transfer rate of the bubble increases rapidly until it reaches the maximum rate, after which it begins to decrease. This phenomenon can be explained by the decreasing rate of the bubble diameter versus the change in the heat transfer coefficient.
Therefore, the decrease in Reynolds number decreases the heat transfer coefficient, while the bubble diameter continues at the same decreasing rate.
Effects of Bubble Break Up on Condensation Heat Transfer Rate
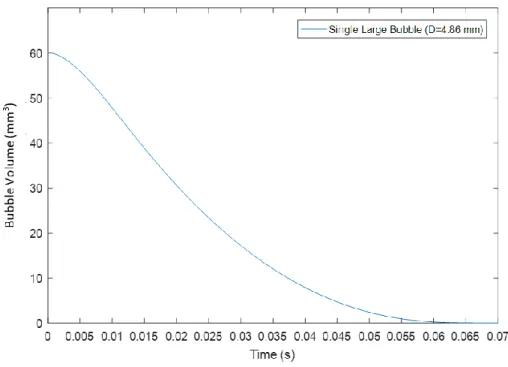
The original bubble has an initial volume of 𝑉0 = 60 mm3 and is divided into smaller bubbles that have a total volume equal to the original bubble (60 mm3). Case A Case B Case C Figure 25: Three cases where the original bubble is broken up into smaller bubbles. In Figure 26 (A), the smaller bubble has completely condensed and reached the liquid phase during 𝑡𝑡𝑜𝑡𝑎𝑙 = 0.045 s, while the original bubble is still in a vapor phase.
Breaking up the original bubble into half its original volume can reduce the total condensation time from 𝑡𝑡𝑜𝑡𝑎𝑙 = 0.065 s to 𝑡𝑡𝑜𝑡𝑎𝑙 = 0.045 s, which is a reduction of 33.8% of the original bubble Lifetime of bubbles and the amount of reduction in the total condensation time due to the original bubble rupture given in Table 3. As a result, the consequences of collapsing the original bubble into subbubbles improve the total heat transfer rate by about 35% in case (A) at peak time as shown in Figure 28 (A).
This is due to the increase in the total interfacial area between the vapor phase and the liquid phase, the original bubble has a diameter of 𝐷0 = 4.86 𝑚𝑚, which corresponds to a surface area of 74.11 mm2, but the two bubbles in case (A) have a total surface area of 93.38 mm2 in.
Numerical CFD Simulation Results
Geometry and Meshing
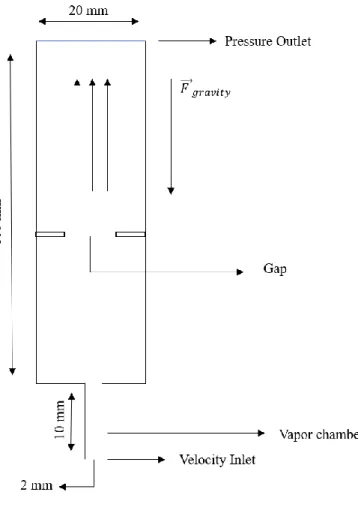
A two-dimensional (2D) planer computer domain is created to include vapor chamber, flow path and mesh gap as shown in Figure 33. The flow is the fluid domain that contains water fluid and has a dimension of 100 mm by 20 mm. Furthermore, the vapor chamber is placed at the bottom of the flow domain with a dimension of 10 mm by 2 mm and contains water vapor.
In general, to analyze the effect of grid resolution in the simulation of an adiabatic bubble, it has been reported that 16 CPD (Cells per bubble diameter) is suitable to simulate the behavior of the bubble with the VOF model [ 68 , 69 ]. However, 16 CPD cannot be maintained as the bubble diameter may change during bubble deformation within the mesh gap. To ensure that the mesh size is less than 1/16 of the bubble diameter, the cell size is chosen to be Quadrilateral and less than 1/16 of the gap width in each simulation.
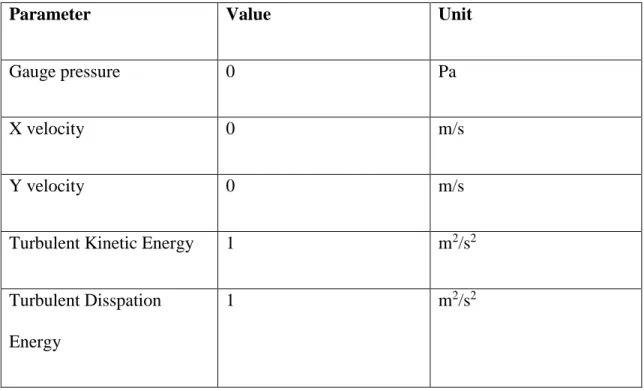
Boundary Conditions and Solver Settings
The multiphase VOF and the 𝑘 − 𝜀 equation were included in the conditions described above to accommodate the different volume fractions for the liquid and vapor phases and to solve the velocity distribution, pressure equations, and turbulence model equations in the domain. Although the fluid regime is initially laminar, the 𝑘 − 𝜀 model with the option of improved wall treatment gave better results in simulating bubble motion and deformation, as a high inlet velocity of 3 m/s will create turbulent eddies through the flow domain. The time step used in the simulations was determined by the Courant number, which determines the speed of information propagation on the domain grid.
For this simulation, a time step size of 6 × 10⁻⁵ was used to keep the course number below 1.
Simulation and Results
- Single Gap Geometry
- Multi Gaps Geometry
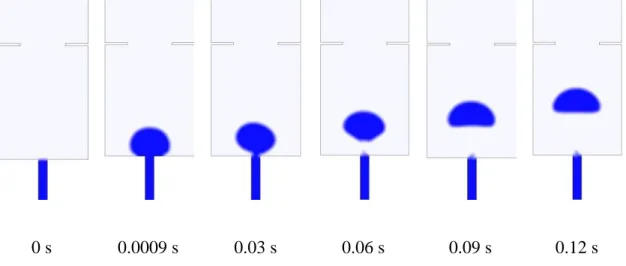
As the bubble crosses the mesh gap, the surface tension will deform the bubble and adjust the width of the gap. The hydrodynamic force exerting the bubble motion inside the gap, which deformed the bubble in the axial direction. Surface tension and adhesion reduced the rising speed of the bubble through the gap while the bubble accommodates the gap width.
Furthermore, Figure 38 (K and L) shows that the bubble has started to accelerate due to the influence of hydrodynamic force as it exits the gap. Consequently, higher deformation occurs on the bubble shape to adjust the width of the gap. The bubble in 6 𝑚𝑚 gap size behaved differently compared to the other sizes, as shown in Figure 43.
This section numerically demonstrates the interaction between the bubble and the holes through the mesh.
Conclusion and Recommendations
Conclusion
Furthermore, the effect of different initial diameters (5 mm, 6 mm and 7 mm) on the bubble condensation rate was analyzed. A numerical study performed using the CFD code in ANSYS Fluent to simulate the dynamic behavior of the bubble under different geometric modifications. A grid-based structure is introduced as a geometric modification of the flow structure to achieve bubble separation.
Two bubble trajectory scenarios were investigated, where the bubble could pass the mesh-based structure of the center of the mesh's gap or the bubble could collide with the walls between the gaps. The bubble dynamic results showed a strong relationship between the gap size and the bubble behavior in terms of bubble deformation, bubble velocity and bubble position through the flow domain. A 6 mm gap did not allow the bubble to pass through the gap due to the gap's size.
For the second scenario, where the bubble will collide with the center walls between the gaps, the simulation was performed for a modified flow geometry, including 2 gaps and 4 gaps.
Recommendations for Future Studies
Mudawwar, “Local evaporative heat transfer coefficient in free-falling turbulent liquid films,” International Journal of Heat and Mass Transfer, vol. Mudawar, “Critical heat flux for subcooled flow boiling in micro-channel heat sinks,” International Journal of Heat and Mass Transfer , vol. Mudawar, “Theoretical Model for Annular Flow Condensation in Rectangular Micro-Channels,” International Journal of Heat and Mass Transfer, vol.
Mudawar, “Review of computational studies on boiling and condensation”, International Journal of Heat and Mass Transfer, vol. Isikan, “Condensation of spherical bubbles”, International Journal of Heat and Mass Transfer, vol. Kalman, “Condensation of bubbles in miscible liquids”, International journal of heat and mass transfer, vol.
Dhir, "Interfacial heat transfer during subcooled flow boiling," International Journal of Heat and Mass Transfer, vol. Park, "Interfacial heat transfer of condensing bubble in subcooled boiling flow at low pressure," International Journal of Heat and Mass Transfer, vol. Volume of Liquid numerical modeling of condensation heat transfer and fluid flow characteristics in microchannels,” International Journal of Heat and Mass Transfer , vol.
![Figure 7: A flow-chart of Coupled Level-set/Volume of Fluid (CLSVOF) method [34]](https://thumb-ap.123doks.com/thumbv2/azpdfco/10576100.0/37.918.345.638.519.935/figure-chart-coupled-level-volume-fluid-clsvof-method.webp)
![Figure 12: Simulations of predicted condensation flow along micro-channel using VOF scheme [57]](https://thumb-ap.123doks.com/thumbv2/azpdfco/10576100.0/45.918.341.694.615.999/figure-simulations-predicted-condensation-micro-channel-using-scheme.webp)
![Figure 17: Model predicted and experimentally measured bubble volume over time [52]](https://thumb-ap.123doks.com/thumbv2/azpdfco/10576100.0/71.918.260.752.134.524/figure-model-predicted-experimentally-measured-bubble-volume-time.webp)