Online prediction of the Li-ion battery remaining useful life for Smart Grid using event-driven approach. These features are used for training the proposed event-driven remaining useful life (RUL) predictor using robust ML classifiers namely k-Nearest Neighbor (kNN), Artificial Neural Network (ANN), Linear Regression (LR), Random Tree (RT) , and Random Forest (RF).
CHAPTER 1 INTRODUCTION
- Overview
- Problem Statement
- Importance and Motivation
- Aim and Objectives
- Outline
Due to the Li-ion battery's beneficial properties, many investments have already been made to improve its stability and reliability. Here we can realize the importance of this thesis topic: Li-ion battery RUL prediction.
CHAPTER 2 BACKGROUND AND LITERATURE REVIEW
- Lithium-Ion (Li-Ion) Batteries
- Battery Management System (BMS)
- State of Charge (SoC) Estimation
- State of Health (SoH) Estimation
- Remaining Useful Life (RUL) Estimation
It also takes, as an input, the current flowing into or out of the battery pack, i.e. the battery pack charging/discharging and at what magnitude. Moreover, the authors [40] proposed a new prediction method based on the Gaussian process mixture (GPM) for Li-ion batteries' RUL prediction.
![Figure 2.1: Li-ion battery cost breakdown with a special focus on the anode composition [23]](https://thumb-ap.123doks.com/thumbv2/azpdfco/10319353.0/28.892.136.756.746.1113/figure-battery-cost-breakdown-special-focus-anode-composition.webp)
CHAPTER 3 RESEARCH METHODOLOGY
System's Block Diagram
The Dataset
For example, it can be used to develop prognostic algorithms, since it is data from a large number of run-to-failing time series. Due to differences in depth of discharge (DoD), duration of quiescent periods and intrinsic change, no two cells have the same state of life (SoL) in the same period. That prognostic algorithms aim to achieve this uncertainty management indicating actual use and making accurate RUL predictions in both the end of discharge (EoD) and end of life (EoL) contexts.
Battery Parameters Sensing
- Classical Sensing
- Reconstruction and Event-Driven Sensing (EDS)
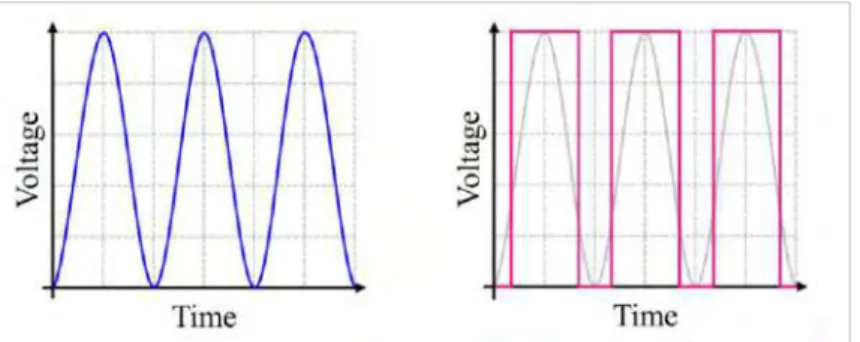
PCM is the most common method, in which three processes are applied, as shown in Figure 3.4: sampling of the analog signal, quantization of the sampled signal, and encoding of the quantized signal in the form of bitstreams [44]. Sampling or pulse amplitude modulation (PAM) (as it is sometimes referred to) is the first analog-to-digital conversion process. In the sampling process, the analog signal is sampled every 𝑇𝑠 seconds (sampling intervals) to determine the waveform.
As shown in Figure 3.5 and equation (2), to get the ideal sample version of an analog (continuous-time) signal, 𝑥(𝑡), we multiply it by the sampling function, 𝑠(𝑡), so we get 𝑥𝑠 ( 𝑡), where 𝑠(𝑡) is a series of impulses (𝛿), as shown in equation (3). As shown in Figure 3-9, the final step in the analog-to-digital conversion process is encoding, where we assign a unique digital code to each value/state in the . One of the essential components in the BMSs is the analog-to-digital converter (ADC), the classical type of which samples based on Nyquist's theory; thus, it does not show good performance in the case of non-uniform signals, such as battery cell parameters (voltages and currents for example) [46]-[49].
Where 𝑁 is the number of bits per sample in the converter that determines the resolution of the converter. In the case of EDADC, the sampling frequency is adjusted according to changes in the analog signals, 𝑥̃(𝑡). Where 𝑡𝑛 is the current sampling instant, which is 𝑑𝑡𝑛 moments later than the previous one, 𝑡𝑛−1, as shown in Figure 3.11.
Feature Extraction
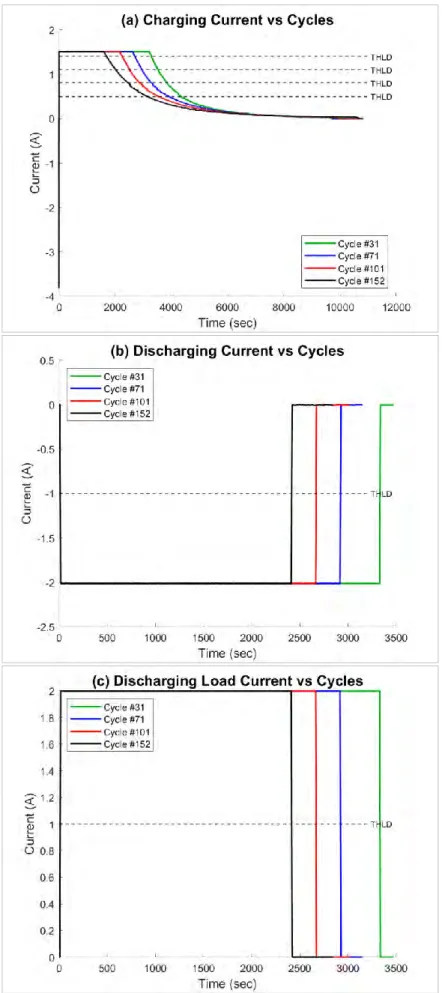
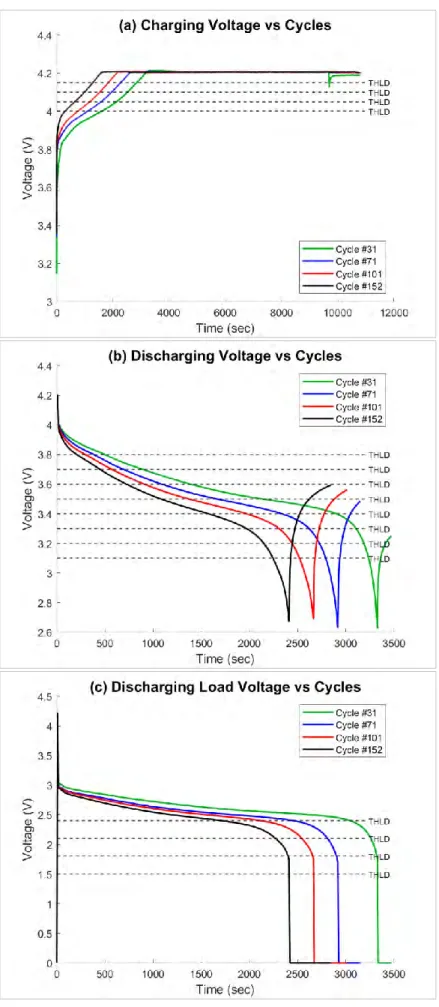
Furthermore, the EDADC reduces preprocessing activity and improves system processing and power consumption efficiency. 𝑀 (11) Where, 𝑡𝐸𝐷𝑘 is the 𝑘𝑡ℎ moment when the battery terminal voltage reaches the predetermined threshold, 𝑇𝐻𝑏, 𝑏 is the threshold index, 𝑏 charging cycles, and 𝑀 is the total number of cycles considered. The same approach is followed for the discharge cycles; the cell terminal voltage characteristics for the 𝑘𝑡ℎ discharge cycle can be extracted using Equation (12).
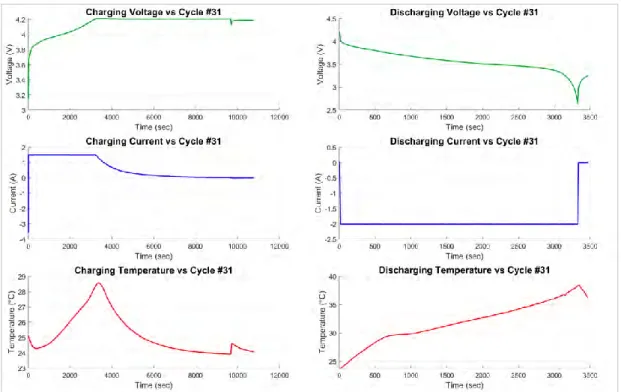
The predicted battery cell characteristics for each charge/discharge cycle of voltage, current and temperature waveforms are extracted based on the same principle.
Machine Learning-Based Remaining Useful Life (RUL) Predictors
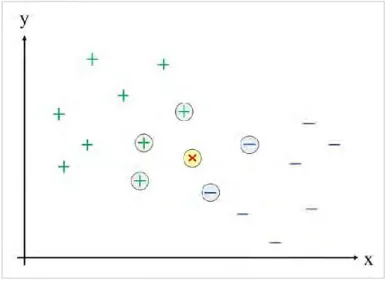
- K-Nearest Neighbor (kNN)
- Artificial Neural Network (ANN)
- Linear Regression (LR)
- Random Tree (RT)
- Random Forest (RF)
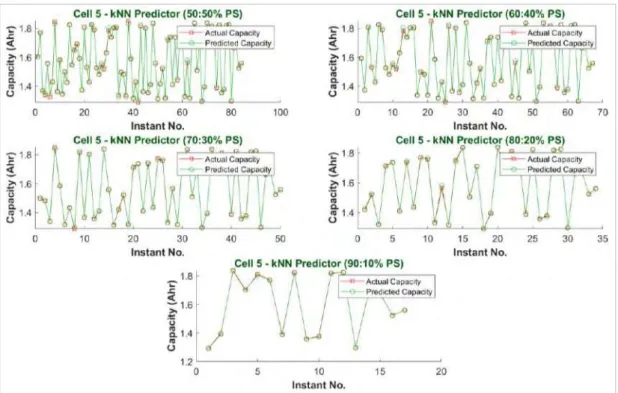
In this work, by running weka.classifiers.lazy.IBk for tuning the kNN model configurations in Weka, it has been found that the best parameters that give the highest performance are setting k=3 and choosing the Euclidean distance metric for finding nearest neighbors. The Artificial Neural Network (ANN) is one of the most robust and efficient algorithms for predicting complex data, in which linear classification algorithms cannot succeed. ANNs simulate the biological brain, and the general architecture of each of them consists of neurons representing processing units on three layers, as shown in Figure 3-14, where the hidden layer is used to continue the nonlinear classification.
It has been found that the best parameter that gives the highest performance is to set the value of the complexity parameter, which controls the degree of shrinkage to 0.5. It creates many decision branches on different nodes; each end sheet produces a random classification of the input data samples; being random indicates that all branches have equal chances of being sampled. In this work, by running weka.classifiers.trees.RandomTree for the tuning of the RT model configurations in Weka, it was found that the best parameter that gives the highest performance is setting the depth of the tree to 15.
Further, partition entropy is calculated as the weighted average entropy of child nodes. Each tree in RF produces a random classification of the sample data input; RF collects these decisions and gives the result that had the highest vote decision [57]. In this work, running weka.classifiers.trees.RandomForest for tuning RF model configurations in Weka, it is found that the best parameters that give the highest performance are setting the number of trees to 50, each with 10 branches.
Models' Evaluation Techniques
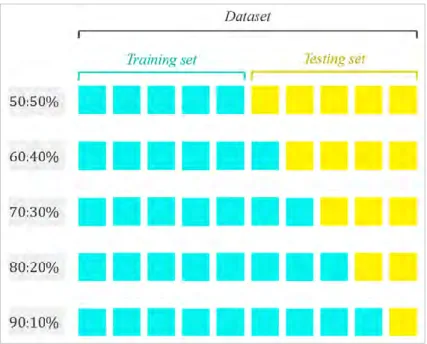
- The Percentage Split (PS)
- The Cross-Validation (CV)
It is used for various purposes such as accuracy assessment, parameter settings and feature selection. CV can also be used to adjust model parameters such as the optimal number of nearest neighbors in a kNN classification approach. Data are generally divided into two subsets in the CV, namely the training (calibration) set and the testing (validation) set.
On the other hand, the test set is of size 𝑣 and is used to estimate the predicted variance. The procedure is repeated for all possible subdivisions of the data set with suitable sizes. Moreover, k-fold CV is one of the techniques commonly used to estimate the classification error.
In this technique, the data set is divided into k-folds, where the training phase of the classifier is performed using 𝑘 − 1 folds. Then, the error value in the test phase is obtained based on the residual fold. The mean value of the errors in each fold represents the k-fold CV error estimate.
Performance Evaluation Metrics
- Compression Ratio ( 𝑹 𝑪𝒐𝒎𝒑 )
- Prediction Accuracy
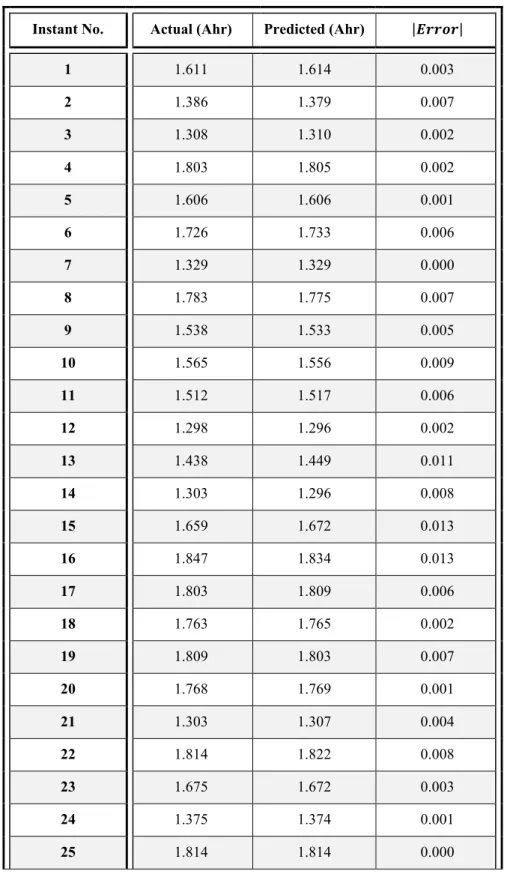
The CV principle is then obtained directly as the average of projected predicted differences over these replicates. Where, 𝑁 denotes the number of samples obtained in the classical counterpart, and 𝑁𝐸𝐷 denotes the number of samples obtained in the proposed model. The accuracy of considered Li-ion battery capacity prediction, thus RUL prediction, is calculated in terms of the correlation coefficient (𝑟), the mean absolute error (MAE), root mean square error (RMSE), relative absolute error (RAE), and root relative squared error (RRSE).
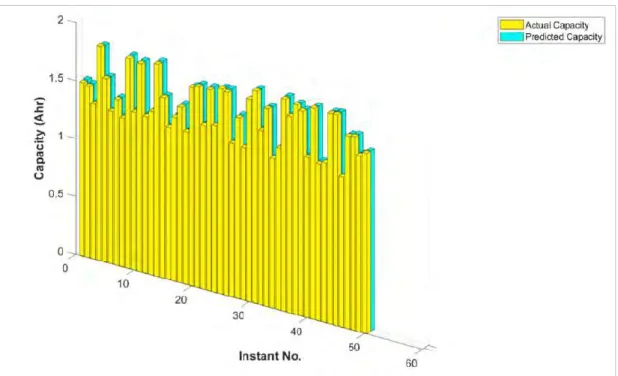
The measure of correlation coefficient (𝒓) shows how strong the relationship is between two series of variables, for example, actual and forecasted capacities. The correlation coefficient, 𝑟, can be calculated automatically using the CORREL function of Microsoft Excel, or manually as shown in equation (14) [61]. MAE estimates the mean error, while RMSE estimates the standard deviation of the random component in the data.
The closer their values are to 0, the smaller the error value, and so the fit is more favorable to the prediction. Both the MAE and RMSE help compare models in terms of accuracy if their errors are in similar units. Therefore, they help compare models in terms of accuracy, even if their errors are not in similar units, unlike the MAE and RMSE, which do not apply if the error units are different [62].
CHAPTER 4 RESULTS AND DISCUSSIONS
Feature Extraction and Data Compression
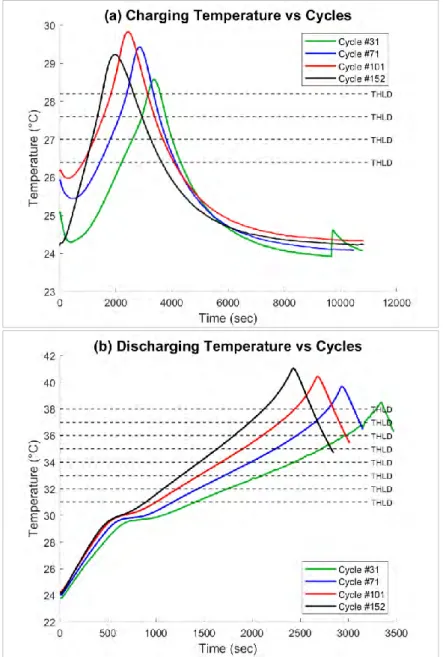
The feature extraction principle is clear from Figure 4.1 to Figure 4.3, demonstrating Table 4.1 the corresponding voltage, current and charge/discharge temperature curves, respectively, for the considered cycle samples with predetermined thresholds. In the case studied and in the context of data compression, each moment consists of three 3500 second long waveforms. The compression ratio is calculated using equation (13), showing that the average compression gain of the suggested solution is 437.5-fold.
Capacity Prediction
- K-Nearest Neighbor (kNN)
- Artificial Neural Network (ANN)
- Linear Regression (LR)
- Random Tree (RT)
- Random Forest (RF)
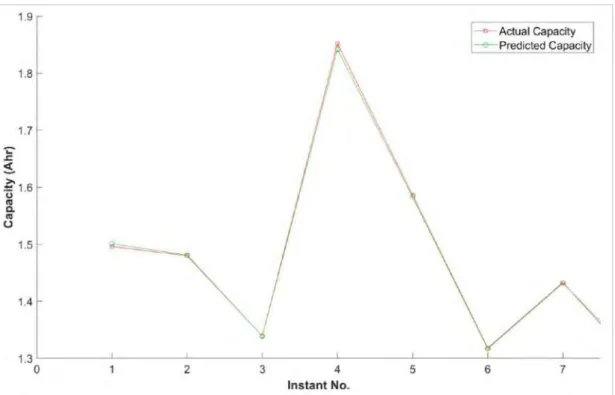
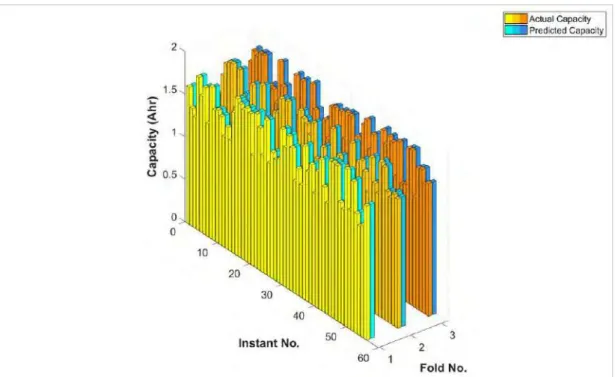
Prediction Accuracy
In addition, the 5-fold CV confirms the results of the PS ratio of 70:30%, with minor differences in the values. It should be noted that even the lower accuracy values achieved by some of the algorithms used are still considered good values as long as the correlation coefficient is extremely close to 1 and the errors are less than 5%; however, it depends on the application, how much accuracy it needs. In addition, these algorithms may be more suitable for cases other than the one studied.
Finally, to compare the results of this work with the most important previous studies mentioned in the literature review, we can rely on the RMSE values as it is. Thus, it outperformed the previously mentioned counterparts and achieved smaller RMSE values than each of them.
CHAPTER 5 CONCLUSION AND RECOMMENDATIONS
Mohamed, “An overview of lithium-ion battery state-of-charge assessment and management system in electric vehicle applications: Challenges and recommendations,” Renew. Liu, “An improved odorless particle filter approach for predicting the remaining useful life of lithium-ion battery,” Microelectron. Pecht, “Prediction of remaining lithium-ion battery useful life with odorless particle filter technique,” Microelectron.
Tsui, “A naïve Bayesian model for robust prediction of the remaining useful life of a lithium-ion battery,” Appl. Zhang, “Remaining useful life prediction for lithium-ion battery: a deep learning approach,” IEEE Access , vol. Pecht, “A recurrent long-term memory neural network for predicting the remaining useful life of lithium-ion batteries,” IEEE Trans.
Pecht, "Quantitative analysis of lithium-ion battery capacity prediction via adaptive bath-shaped function," Energies, vol. Si, “Remaining useful life prediction of lithium-ion batteries based on the Wiener process with measurement error,” Energies, vol. Xie, “Remaining useful life prediction for lithium-ion batteries based on mixture of Gaussian processes,” PloS One , vol.
![Figure 3.8: (a) Uniform quantization and non-uniform quantization: (b1) Lloyd max quantization and (b2) μ law quantization [45]](https://thumb-ap.123doks.com/thumbv2/azpdfco/10319353.0/48.892.137.766.645.968/figure-uniform-quantization-uniform-quantization-lloyd-quantization-quantization.webp)