I hereby declare that this thesis entitled "The Potential for Harvesting Wave Energy Offshore NEOM Region, Northern Red Sea" is based on my original work with the exception of quotations and citations which have been duly acknowledged. Based on preliminary information about the NEOM region, potential environmental and social challenges were also identified in this study for the viability of wave energy utilization.
Introduction
- Overview
- Problem Statement
- Objective
- Importance and Motivation
- Contribution
- Outline of the Thesis
The expected results of this study were the possibility to identify the best converter system to harvest wave energy in the Red Sea, site-specific screening for the installation of a WEC unit and understanding the impact of wave energy production on the sustainability of social and environmental factors. For Saudi Arabia, wave energy can be another renewable energy source, especially for the desalination plants located near the coastlines of the Red Sea coast.
Background and Literature Review
- Overview of Ocean Wave Energy
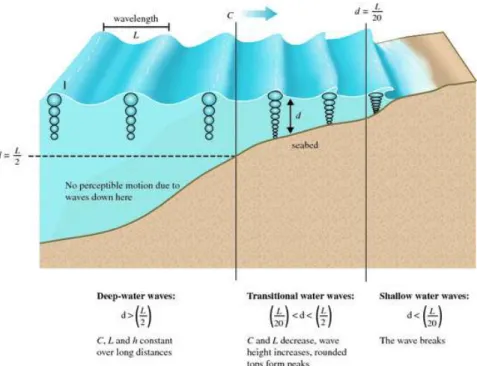
- Characteristics of Waves
- Representation of Waves
- Previous Studies
In the Red Sea region, few studies have investigated wave energy estimation. In the wave energy converter (WEC) research activities, the first WEC patent was developed in France and issued in 1799 [32].
Wind and Wave Characteristics of the Red Sea Region
Wind and Wave Characteristics and Patterns
- Wind Characteristics
- Wave Characteristics
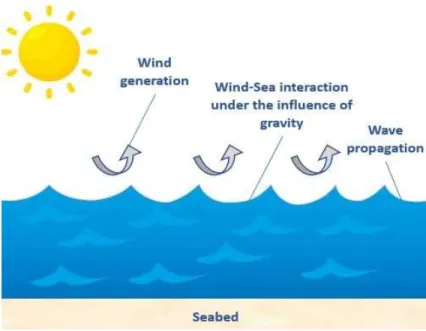
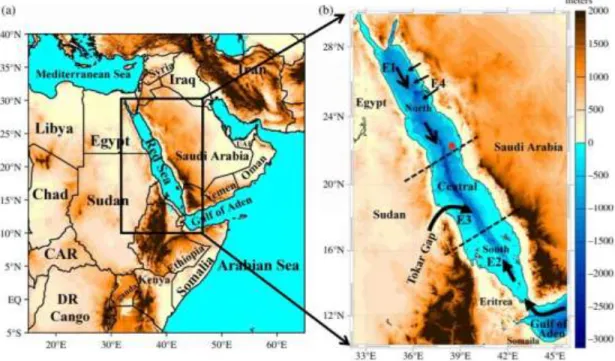
The main difference between summer and winter is the presence of high waves in the southern part of the Red Sea. This wind generates the highest waves in the Red Sea (up to and above 5 m), especially if they interact with the E1 system.
Meteo-Oceanographic Analysis in NEOM Region
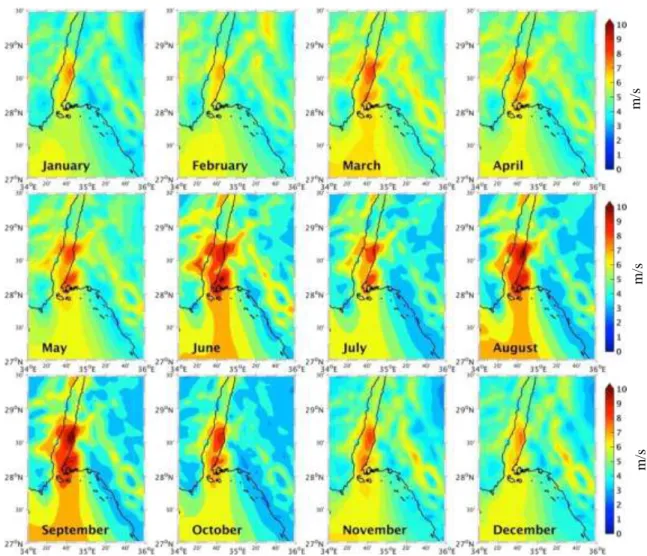
- Wind Analysis
- Wave Analysis
21 the Arabian Peninsula also creates short-lived and less energetic waves in the northern Red Sea (marked as E4). The waves that exist in the Red Sea are more dominant in the North, but the waves are less dominant in the central and southern part of the Red Sea.
Wave Energy Converters
Definition of a Wave Energy Converter
Classification of Wave Energy Converters
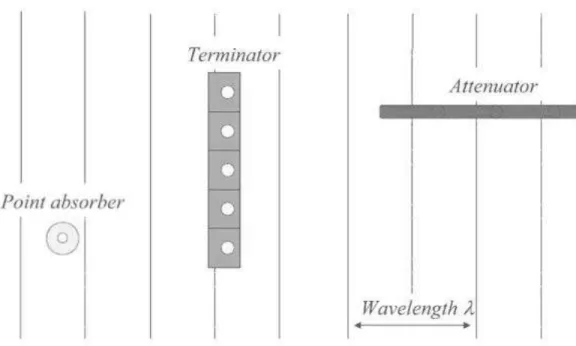
28 Figure 4.3 Classification of wave energy converters according to the wavelength and their orientation according to the main propagation direction. An attenuator is a floating device that runs parallel to the golf course and efficiently rides the waves.
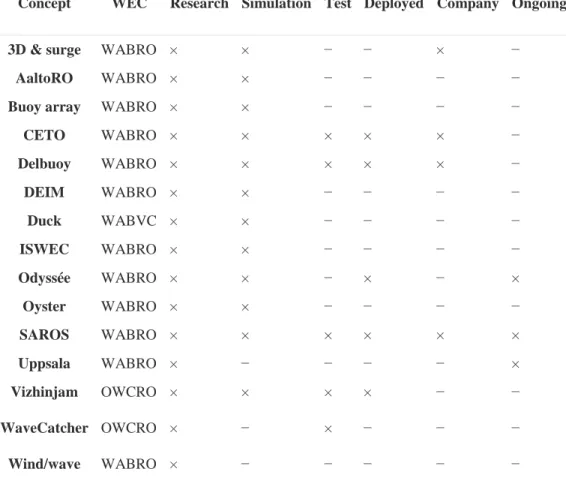
Testing and Commercialization
- DEIM
35 DEIM is able to convert wave energy into electrical energy without the use of other devices such as gears, fluids under pressure (oil or water), transmission belts, etc. An interesting study of this Power Take-Off for a wave energy technology is presented in [70] , which is referenced to the Archimedes Wave Swing (AWS) generating system. At various heights, an intermittent red light is mounted on top of the buoy, making the conversion system visible up to several nautical miles away.
A hemispherical weight (red part) is installed in the lower part of the inner buoy, which ensures the correct vertical position and gives it greater inertia. These linear generators have a working stroke of 4 m to take advantage of the wave energy contained in the most energetic state of the sea. There are two springs in the upper and lower part of the inner casing, which prevent damage to the inner buoy due to bad weather.
In order to reduce scouring and disturbance phenomena in the seabed, the connection of the systems to the network will be achieved using submarine cables [71]. The high performance of the linear generators that make up the power take-off (PTO) and the high resistance of the construction materials, which make the device useful for about 20 years.
![Figure 4.10 (a) External and (b) internal views DEIM [67].](https://thumb-ap.123doks.com/thumbv2/azpdfco/10320311.0/54.918.326.716.480.1015/figure-external-b-internal-views-deim.webp)
Research Methodology
Methodology of Wave Energy Modeling
Selection of Study Points
NEOM, located in southwestern Saudi Arabia in the Tabuk province, stretches along the Gulf of Aqaba. Based on the previous study and observations from Figures 3.5 and 3.6, the Gulf of Aqaba was considered a suitable preliminary location for WEC, as the average wave height is 1.5 m near the coast and the wind speed is almost 8 m/s above the Gulf from Aqaba, which is stronger than above NEOM Bay. The hindcast-selected credits were generated for wave height and peak wave period using the WAVEWATCH III model based on 30 years at 10 km resolution, power calculated from a 12 year grid at 1 km resolution of NEOM Bay and part of the Gulf of Aqaba, forced by the surface winds of the Red Sea over 12 years, as shown in Figures 5.4 and 5.5, respectively.
It can be observed that the wave height along the Gulf of Aqaba is 0.78 m and close to the shore, while the average in NEOM Bay is about 0.58 m and far from the shoreline. The peak wave period in the Gulf of Aqaba is 4 seconds, while in NEOM Gulf it is lower. In the power flow diagram, the mean peak wave period factor should be greater than 4 s, since the mean peak wave period in the selected region varies from 1.7 to almost 4 s near the coast, for the period 2007 to in 2018 as shown in Figure 5.5.
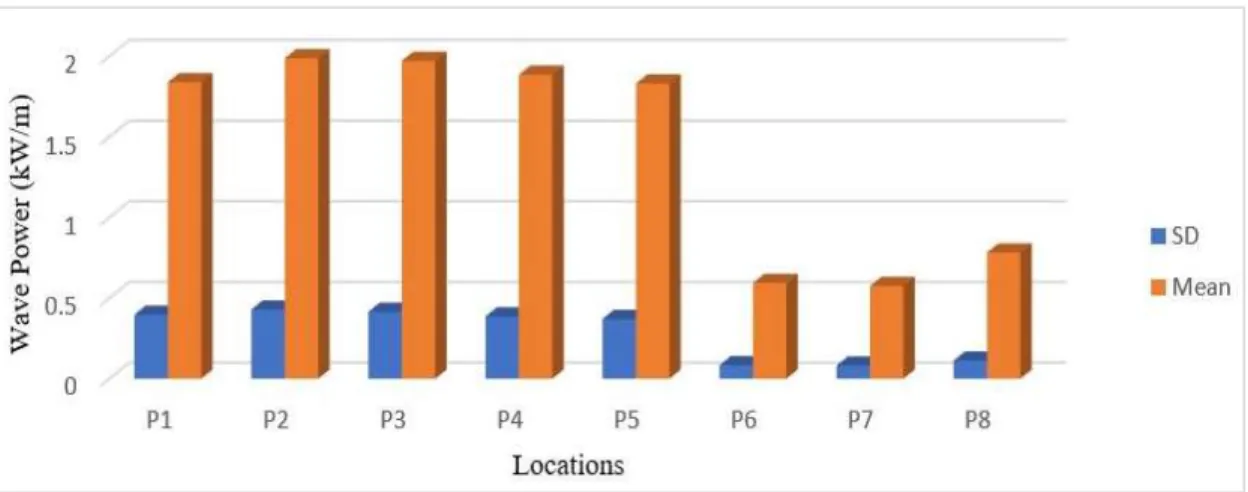
Sites with a depth range between 20-80 m were considered based on the specifications of most wave energy converters. The distribution of survey points is shown in Figure 5.6 (denoted as P1 to P8), and their geographical coordinates, water distances and distance to land are given in Table 8.

Wave Energy Modeling
46 The wave power (𝑘𝑊/𝑚) transmitted by an ordinary wave per unit crest at a given location is then approximated by the following ratio [77, 78]. In deep water, energy is transmitted only at half the speed of the wave speed. Where α is a coefficient, it depends on the shape of the wave spectrum; a conservative value of 𝑇𝑒 = 0.9 𝑇𝑝 was used to estimate the wave energy source [83].
During the selection of a site for wave energy converter (WEC), another critical aspect that should be considered besides the amount of wave power and potentially available energy is its temporal variation on different time scales, namely: daily, monthly and seasonal. Among the coefficients proposed to assess the temporal variability in wave power at a particular location, as suggested by Cornett et al. Where 𝑃𝑆1 is the average wave power of the season with the highest energy (winter) and 𝑃𝑆4 is the average wave power of the lowest energy season (summer) and Pyear is the average wave power over the year.
𝑃𝑦𝑒𝑎𝑟 (5.17) PM1 is the mean wave power of the month with the highest energy, and PM12 is the mean wave power of the month with the lowest energy. Where pij is the energy percentage corresponding to the bin defined by row i and column j and Pij is the electrical power corresponding to the same energy bin for the WEC (the power matrix is provided by each WEC manufacturer on a trial basis or they are designed using numerical models).
Results and Discussion
Mean Significant Wave Height, Energy Period, and Mean Wave Power
This indicates that the average wave power during autumn is stronger in the Gulf of Aqaba. From the results, P2 is the highest average wave power at Aqaba Gulf and the lowest survey point is P5. Finally, P2 is the best study point at Aqaba Bay and P8 has the highest mean wave power from the selected study points at NEOM Bay.
The average wave power at (P1 to P5) in the Gulf of Aqab follows the same pattern in all months. It has the lowest average wave power in February (up to 1.2 kW/m), and the lowest wave height is 0.6 m. From the graphs, we can see that the average wave power values fluctuate around all months.
At P8 in NEOM Bay, the highest average wave power is obtained in December and January (up to 0.95 kW/m). The average wave power and wave heights at the selected study points located in NEOM Bay are significantly low in all months.
WEC Systems
WEC Output and Performance
- DEIM Farm
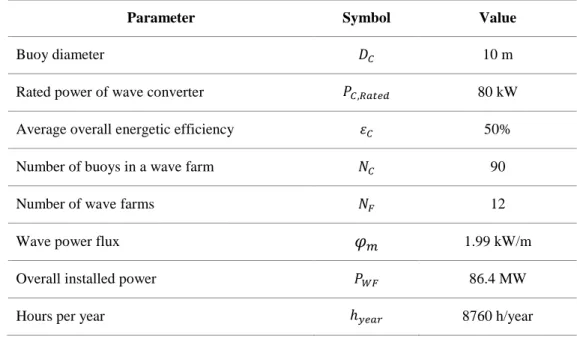
Where PC, Rated is the rated power of a single point absorber, NC is the number of WEC installed in a single wave farm and NF is the number of wave farms. 𝑁𝐹 total number of units installed, 𝜀𝐶 total efficiency, and finally ℎ𝑦𝑒𝑎𝑟 the number of hours per year. The solar system could be installed in the upper part of the wave inverter, increasing the electrical output of the unit.
The annual solar radiation, according to these data Iyear in Tabuk, is equal to 75.77 kWh/m2 [86]. Where 𝐼𝑃𝑉,𝑆𝑡𝑑 is standard solar radiation, 𝑆𝑃𝑉 is the surface of solar panels installed on a single wave inverter, 𝑁𝐶. 𝑁𝐹 is the total number of wave inverters and 𝜀𝑃𝑉 is the electrical efficiency of solar panels [85].
In order to increase renewable energy output in the same region, this technology can be properly combined with other conversion devices, such as the offshore photovoltaic one, making wave farms much more efficient. The electric energy production of DEIM wave energy converter by installing 95.96 MW will generate about 94.860 MWh/year as shown in Table 16, which represents the annual energy consumption of 10 villas powered by WEC in Tabuk city as in Figure 6.11 .
Discussion
- Cost Analysis
- Environmental Challenges
- Social Challenges
- Constraints and Limitations
- Operation and Maintenance
- Design and Development
- Performance Improvement
- Cost Reduction
- Adverse Environmental Conditions
92], noted that technical and social impacts were found to be decisive factors for the sustainability of wave energy utilization. A detailed overview of the most common environmental impacts of wave energy equipment is given in Figure 6.13. For some animals, especially larger whales, most offshore wave energy equipment is anchored directly to the seabed, and mooring lines can pose a threat of entanglement.
However, this is a location-specific problem as the NIMBY syndrome is based on the public perception of wave energy in different markets. Wave energy converters are located several miles offshore and have a low profile above water (like an iceberg, most of the equipment is submerged). Building and operating wave power plants will have major positive economic impacts on coastal states.
The operation and maintenance phases of wave energy converter projects refer to their performance and survivability. One of the most complex problems in extracting wave energy is the conversion of the irregular waves into a smooth electrical output, applicable to the power grid, which requires some kind of energy storage device.
Conclusions and Recommendations
Conclusions
Recommendations
Hoteit, "Een beoordeling met hoge resolutie van wind- en golfenergiepotentieel in de Rode Zee", Applied Energy, vol. Heath, "The Development and Installation of the Limpet Wave Energy Converter", World Renewable Energy Congress VI, pp. Onea, "Estimation of the wave energy conversion efficiency in the Atlantic Ocean close to the European Islands," Renewable Energy, vol.
The aim is to find the best site for a wave energy converter (WEC) in the Red Sea region. As the name suggests, wave energy is wave energy collected and converted into useful energy. Simulation of a SEAREV wave energy converter with bypass control of its hydraulic power take-off.
Integration of Marine Wave Energy Converters in Seaports: A Case Study in the Port of Valencia. To the best of the authors' knowledge, no research has been conducted on the potential of wave energy in the NEOM region. As for the research activities of wave energy converters (WECs), the first WEC patent issued in 1799 was developed in France [27].
Long-term assessment of wind and wave energy resources in the South China Sea based on 30-year historical data.
![Table 18. Daily total GHI data Wh/m2 for 44 stations across the country [86] .](https://thumb-ap.123doks.com/thumbv2/azpdfco/10320311.0/127.918.163.816.175.1057/table-daily-total-ghi-data-wh-stations-country.webp)
![Figure 3.4 Mean and maximum significant wave heights distribution in the Red Sea (1985-2015) [30]](https://thumb-ap.123doks.com/thumbv2/azpdfco/10320311.0/37.918.186.753.386.737/figure-mean-maximum-significant-wave-heights-distribution-red.webp)
![Figure 3.5 Statistical distribution of the significant wave heights in the three areas [30]](https://thumb-ap.123doks.com/thumbv2/azpdfco/10320311.0/38.918.173.787.312.570/figure-statistical-distribution-significant-wave-heights-areas.webp)
![Figure 3.9 Annual mean power densities of (a) wind and (b) waves in the Red Sea [44].](https://thumb-ap.123doks.com/thumbv2/azpdfco/10320311.0/43.918.292.710.388.766/figure-annual-mean-power-densities-wind-waves-red.webp)
![Figure 4.5 Point Absorber: OPT power (left) [53], L10 (top right) [52], Archimedes Buoy (bottom right) [55]](https://thumb-ap.123doks.com/thumbv2/azpdfco/10320311.0/49.918.225.802.485.873/figure-point-absorber-power-right-archimedes-buoy-right.webp)

