Inquiries regarding the use of the book should be addressed to the Rights and Permissions Department of INTECHOPEN LIMITED ([email protected]). The publisher assumes no responsibility for any damage or injury to persons or property arising from the use of the materials, instructions, methods or ideas contained in the book.
Introduction
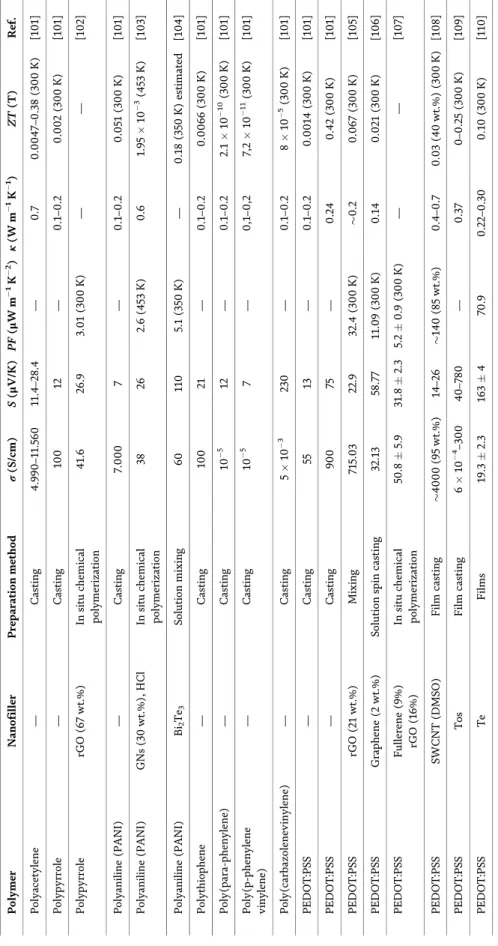
SWCNT polycarbonate (PC)/SWCNT nanocomposites prepared by solvent mixing showed that with increasing SWCNT content (up to 30 wt%), the electrical conductivity increases to about 1000 S/m, and the Seebeck coefficient reaches 60 μV/K with only a slight dependence on SWCNT content. Acid-base control of thermoelectric properties of poly (3,4-ethylenedioxythiophene)tosylate (PEDOT-Tos) thin films.
Experimental
Among the IV-VI-based chalcogenides, lead telluride is one of the most widely used thermoelectric materials, but the maximum ZT achieved is only ~0.8 [3] which is still insufficient for converters in wide industrial use. One of the main methods for optimizing the electronic properties of these materials is the addition of doping elements to the melt, while the most well-known universal lead telluride dopant is bismuth; it allows obtaining such carrier concentrations that can provide applicable values of thermoelectric conversion efficiency. The thermoelectric properties of compounds in the system have been investigated, the processes that occur with increasing dopant concentration have also been studied, but such research has mainly focused on compounds within the solid solution up to the theoretical limit of solubility [4, 5].
Furthermore, to the best of our knowledge, most previous studies have not investigated the individual electronic contributions of the matrix-embedded secondary phases involved on the effective thermoelectric transport properties. The generalized effective medium (GEM) approach [6] allows the estimation of transport properties based on the experimentally measured properties of each of the phases involved. Since the approach takes into account geometric considerations, it can be used to maximize the thermoelectric value of composite materials by artificially aligning the embedded secondary phase in the composite.
Results and discussion
The crystal structure of the alloys was analyzed by X-ray powder diffraction (Rigaku DMAX 2100 powder diffractometer). BSE-SEM micrographs of the investigated (a) i, (b) iii, and (c) iv alloys showing in the inset the compositional modulations. Temperature dependence of (a) Seebeck coefficient, (b) electrical resistivity, (c) thermal conductivity, and (d) the thermoelectric figure of merit for the investigated i, ii, iii and iv alloys.
This behavior supports the theory above and is attributed to the increased metal contribution from the precipitates. Temperature dependence of the (a) electronic contribution and (b) lattice contribution to the thermal conductivity of the investigated alloys. In order to further investigate the electronic contribution of the secondary phase due to the geometrical morphology and quantity, the generalized effective media (GEM) approach was applied [6].
Conclusions
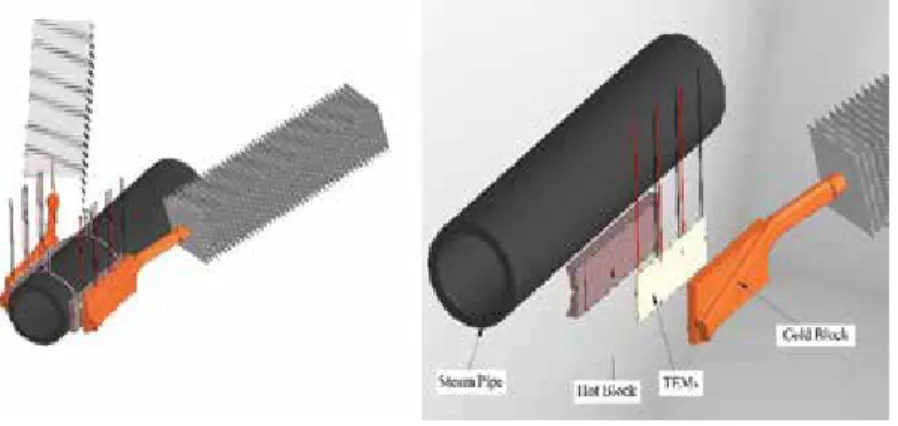
The nominal dimensions of the pipe diameters used by the authors range from 1 to 3.5 inches. 3D CAD models of the thermoelectric generator assembled as a mirrored unit of two generators (left) and a schematic (right). The thermal resistance associated with bonding the heat pipe to the aluminum foils is also minimal due to the minimal interface area.
This connects to the hot block, another thermal paste interface, and then to the hot side of the TEM. That is, the thermal resistance added with the hot block is comparable to the inherent thermal resistance of the existing pipe. A simplified model of the cold block can be represented by a system of essentially parallel resistors.
Methodology
Experimental apparatus
The top of the p-n junction is heated, and the bottom of the set is cooled; in this way a temperature gradient is generated. The free electrons of the n-type doped elements and the interstices of the p-type elements begin to move to the cold part, i.e. the lower part of the system. In Figure 2(b), the heating and cooling system of the thermoelectric generator and the data acquisition system to acquire generated power by the thermoelectric generator TEG are shown in detail.
An illustration of the generator and also its main specifications can be seen in Figure 3 and Table 1 respectively. To measure the temperatures of the thermoelectric generator, K-type thermocouples with mineral insulation Omega Engineering™, fixed within machined channels in the heater block and the water-cooled heat exchanger, of the ultra-thermostatized bath were used. The thermocouples were positioned to obtain the temperatures of the heated and cooled surface of the generator (Thermocouple 1 and Thermocouple 2—Figure 4), which resulted in obtaining the temperature difference between these surfaces.
Experimental procedure
To conduct the experimental trials, the ambient temperature was maintained at 16°C ± 1°C by the Carrier™ thermal conditioning system, and the water temperature in the ultrathermostatized bath was also maintained at 16°C ± 1°C. Water is fed from an ultrathermostatized bath at a flow rate of 1 L/min, passes through channels to exchange heat with the upper surface of the TEG, and returns to the ultrathermostatized bath. The heating system consists of an aluminum block located inside the base of the experimental apparatus, point (4) in Figure 2(b).
The block contains two cartridge resistors associated in parallel, which are responsible for heating the block and, consequently, dissipating the heat to the TEG. The temperature data of the hot and cold surfaces of the TEG were recorded every 10 seconds using the two thermocouples and the data acquisition system, which is stored by the Agilent™ Benchlink Data Logger 3 software. This system was activated only when the state of the thermal system reached the quasi-permanent state.
Experimental uncertainties
Results and discussions
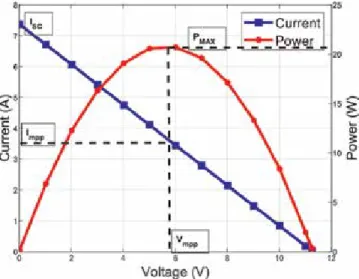
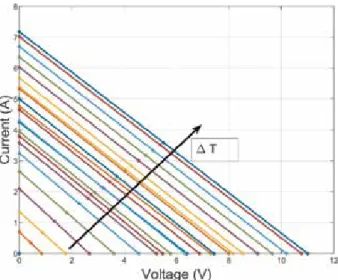
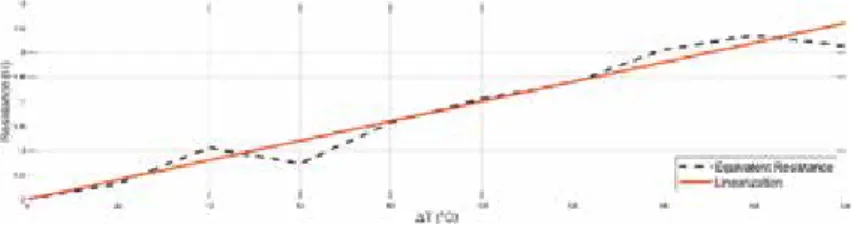
It can be observed that the output current and voltage increase according to the temperature difference between the sides of the thermoelectric generator. The value of the internal resistance of the generator as a function of the temperature difference (∆T) between the sides of the thermoelectric generator can be defined by. Open and closed circuit voltages increase linearly with increasing temperature difference.
Uopn ≅ 21.664∆T where ∆T is the temperature difference between the heated and cooled surfaces of the thermoelectric generator and Uopn is the no-load voltage of the generator. Thus, Table 4 shows the power generated by the area of the thermoelectric generator as a function of the temperature gradient. It can be noted that with the increase in the temperature difference between the surfaces of the thermoelectric generator, the generated power increases in quadratic form.
Efficiency droop and optical performance of UV-LEDs The optical performance of the UV-LED devices has been studied by
Thermal stress and lifetime performance
Efficiency drop and UV-LED optical performance The optical performance of UV-LED devices was studied.
LED package and junction temperature
Wall plug efficiency and temperature dynamics
Newton’s law of cooling
Efficiency drop and UV-LED optical performance. He studied the optical performance of UV-LED devices. He studied the optical performance of UV-LED devices. Excessive self-heating of UV-C LEDs reduces device lifetime, optical performance and spectral shift of radiation efficiency. Heat extraction is one of the challenges for improving the efficiency of LED devices [10].
The wall plug efficiency (WPE) is defined as the ratio between electrical power consumption PLED and optical output power of the UV-C LED device denoted by PLIGHT. The thermal performance of the UV-LED device shows that the soldering temperature dynamics TS (t) can be modeled with Newton's law of cooling, where TEST. The value of the cooling temperature constant K will be able to model the thermal performance of the system.
Experimental setup
Taking into account that the cooling process begins at ambient temperature TAMB, usually in the range of 19-25°C, to finally achieve the steady state of temperature TEST. The determination of the constant K for Newton's law of cooling is important and must be determined experimentally for each LED device (including thermoelectric cooling system).
Thermal performance and empirical modeling 1 Thermal resistance
Thermal performance
To obtain the stationary temperature of the system TEST and its relationship with TEC voltage, we apply a pre-cooling of the LED. It is possible to reach the stationary temperatures in the system making the cooling process with the TEC before turning on the LED. T EST ( VTEC , T AMB ) = T AMB − mV TEC (8) If TAMB is constant, it is possible to obtain the value of slope m, relating the empirical recording of the cooler process dynamics, for different values of VTEC.
The value of m is a thermal property of any system, within a specific temperature range. For example, the data presented in Figure 3 allows confirmation of the linear relationship established in Eq.
Temperature control using TEC and PID controller
Results
The difference between first and last stationary temperatures is given by ΔT. 1), the soldering point temperature can be obtained by knowing the junction temperature. The block diagram displayed in Figure 4 is implemented with the MATLAB Simulink software, taking into account the empirical values of the time constant, the ambient temperature TAMB, the increment ∆T, the linear relationship between VTEC and TEST. Using these gain parameters for the PID controller applied to our system, we can fit the simulations of the temperature dynamics for three different steady-state operations.
When the UV-C LED is turned on, the control of the system increases the TEC voltages to restore the initial temperature conditions as shown in Figure 6. One of the major advantages of the temperature control is the improvement of the optical output power. The plotted data shows that reducing the junction temperature TJ from 59 to 44°C increases the UV radiation by 6%.
Conclusions
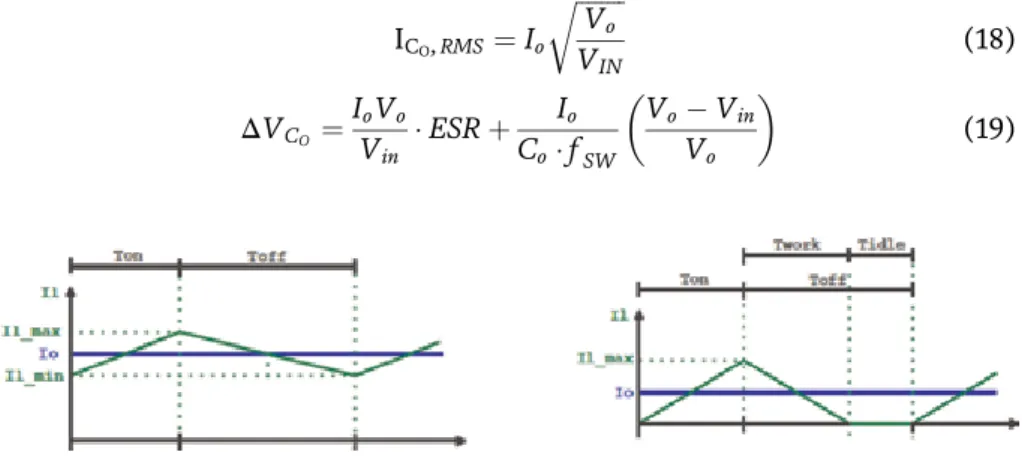
Simulation results of the control algorithms are presented and experimental data are shown to validate the design steps. In the next section, design steps and loss estimation of the NIBB topology are presented. Conduction losses are given in Eq. 25).Rdsonis the equivalent resistance of the MOSFET when it is closed.
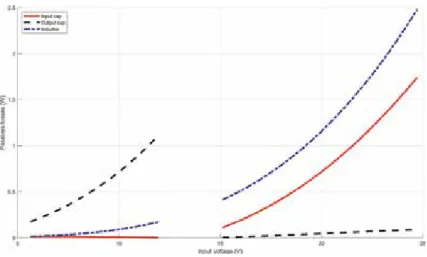
While output current is an application limitation, switching frequency is a degree of freedom that can be used to reduce switching losses (Figures 17 and 18): . Using a nested operating system, the output perturbation of the MPPT algorithm is used as a reference for the internal control loops described in the next subsection. The average current of the inductor is related to the output current and the steady state relationship between input and output current is reported in Eq.