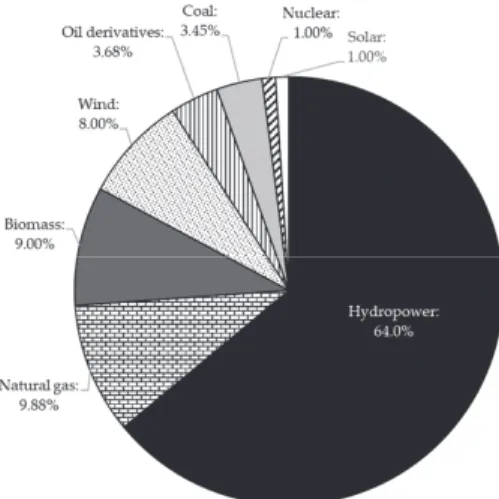
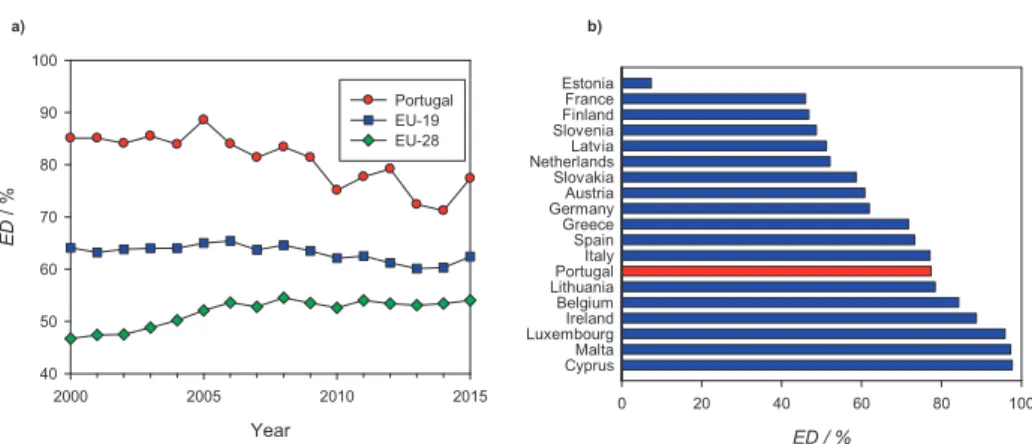
Therefore, this work aims to contribute to the current state of the art by providing a background image of the Portuguese energy sector (Section 2), presenting the main facts and figures such as the evolution of the country's energy dependence over time (Section 2.1), fossil fuel consumption (Section 2.2) and renewable energy production (Section 2.3). More than half of the renewable energy produced in Portugal comes from biomass, although this share has decreased from 82%.
Conclusions
Despite the predicted underground storage potential, which still needs to be explored, the prospects for the introduction of PtG in Portugal would be even more promising with the construction of the third planned connection with Spain in the natural gas network and the planned connections connecting the Iberian Peninsula with France. Regulation of wind energy production: The contribution of electric vehicles and other energy storage systems.
Comparison of Technologies for CO 2 Capture from Cement Production—Part 1: Technical Evaluation
Introduction
In literature, several CO2 capture technologies have been evaluated for use in the cement industry. This article presents a consistent technical evaluation of CO2 capture technologies for retrofitting in the cement industry.
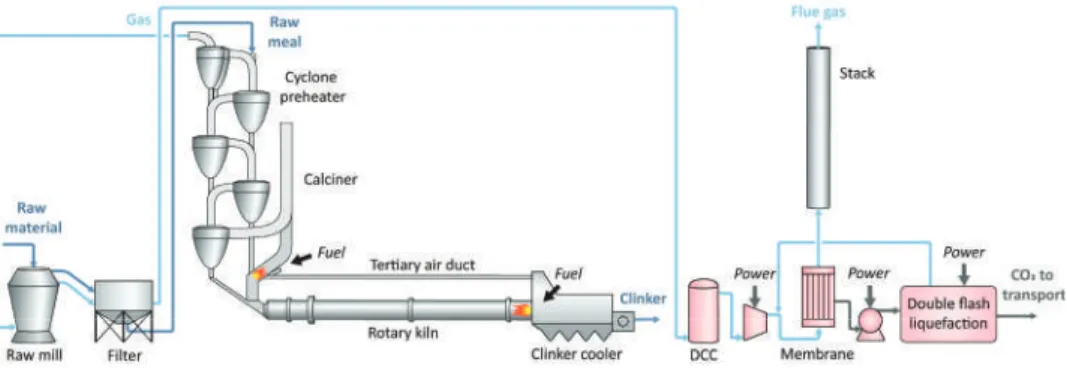
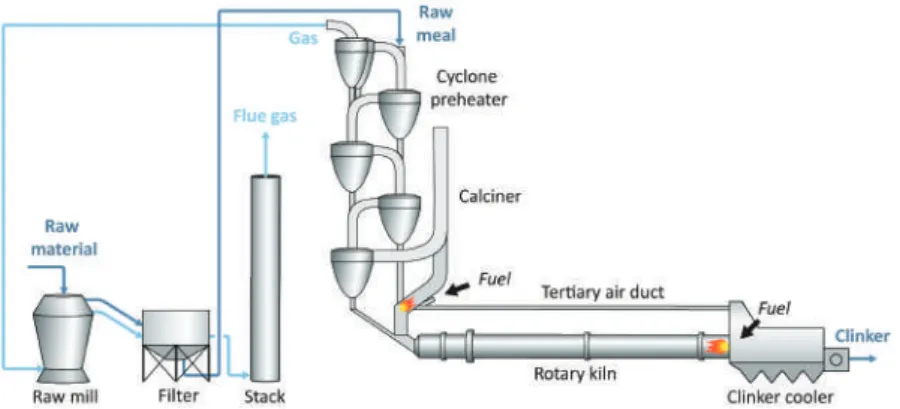
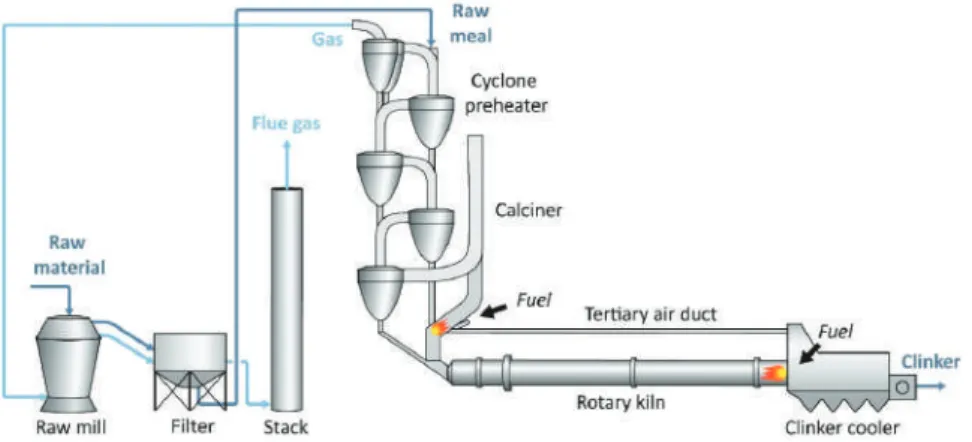
The vaporized MEA is recovered from the purified flue gas in the water scrubbing section at the top of the absorber. The gas atmosphere in the clinker cooler, rotary kiln, calciner and preheater is changed and some flue gases are recycled.
Methodology
Other technologies are simulated using the flue gas from the VDZ simulation of the reference furnace as process feed. CO2 avoided from flue gases estimates the direct reduction of CO2 emissions from cement kiln flue gases.
Process Modeling and Key Process Data
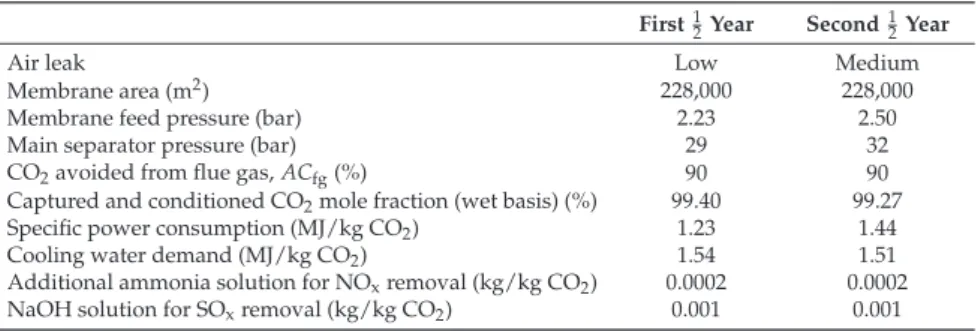
A system process flow sheet is shown in Figure 12 and the resulting process key data is shown in Table 10. A system process flow sheet is shown in Figure 13 and the resulting process key data is shown in Table 12.

Comparative Technical Evaluation of the CO 2 Capture Technologies 1. Emission Abatement
The specific primary energy consumption for the CO2 avoided by the technologies is shown in figure 15 and table 16. For the chilled ammonia process, the steam consumption constitutes the largest part of the primary energy consumption and reduction in equivalent CO2 avoided.

Conclusions
Directive 2010/75/EU of the European Parliament and of the Council of 24 November 2010 on industrial emissions (comprehensive pollution prevention and control). Available online: https://www.sintef.no/globalassets/project/cemcap/d-6.1-optimized-oxyfuel-operation.pdf.pdf (accessed 8 January 2019). Available online: https://www.sintef.no/globalassets/project/cemcap/presentasjoner/d7.2-burner-tests_revision1.pdf (accessed 12 January 2019).
Available online: https://www.sintef.no/globalassets/project/cemcap/cemcap-d-8-2-ustutt_nal.pdf (accessed 12 January 2019).
Comparison of Technologies for CO 2 Capture from Cement Production—Part 2: Cost Analysis
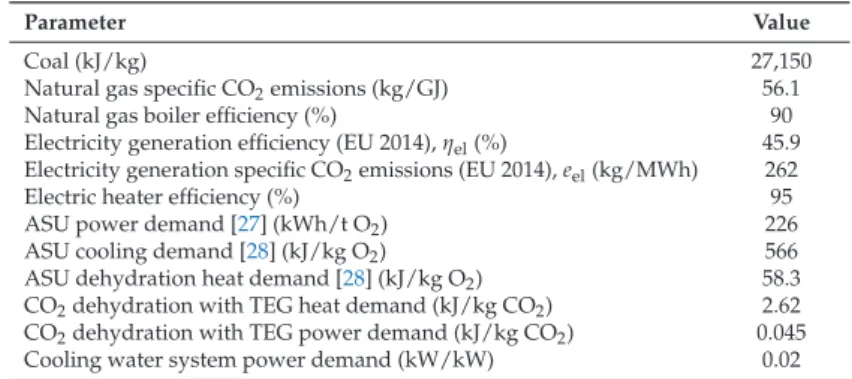
A more detailed description of the reference cement plant can be found in Part 1 of this study and in the CEMCAP framework [19]. The material use and consumption of the reference cement plant (based on the process modeling presented in Part 1) are summarized in Table 1. Waste heat from the cement plant can be used to cover part of the heating demand.
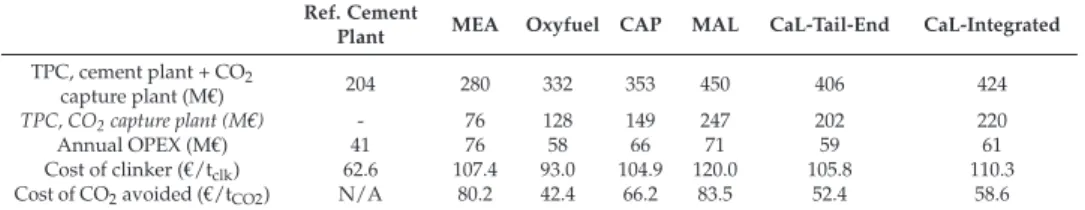
The retrofit cost analysis of CO2 capture considers 90% CO2 captured from stack flue gas in the reference cement plant as a baseline scenario.
Results and Discussion
Figures 4 and 5 show the breakdown of the costs of clinker and of avoided CO2 in the most important cost factors. In the case of the reference technology MEA, steam contributes the most to the cost of avoided CO2. In the integrated configuration, CAPEX together with the capital-related fixed OPEX account for almost 80% of the cost of avoided CO2.
Sensitivity of the cost of avoided CO2 to (a) coal price, (b) cost of steam, (c) cost of electricity and (d) a change in CAPEX, and (e) sensitivity of the cost of clinker to a carbon tax.
Conclusions
Supplementary Material: The following is available online at http://www.mdpi.com s1, Tables S1–S15: Equipment Lists for CO2 Capture Technologies. Available online: https://www.sintef.no/globalassets/project/cemcap deliverables/d11.2-experimental-co2-liquefaction.pdf (accessed 8 January 2019). Available online: https://www.sintef.no/globalassets/project/cemcap deliverables/d4.4-cost-of-critical-components-in-co2-capture-processes.pdf (accessed 8 January 2019).
Available online: https://www.sintef.no/globalassets/project/cemcap deliverables/d4.6-cemcap-comparative-techno-economic-analysis-of-co2-capture-in-cement-plants.pdf (accessed 8 January 2019).
A Study on the Evolution of Carbon Capture and Storage Technology Based on Knowledge Mapping
Methodology
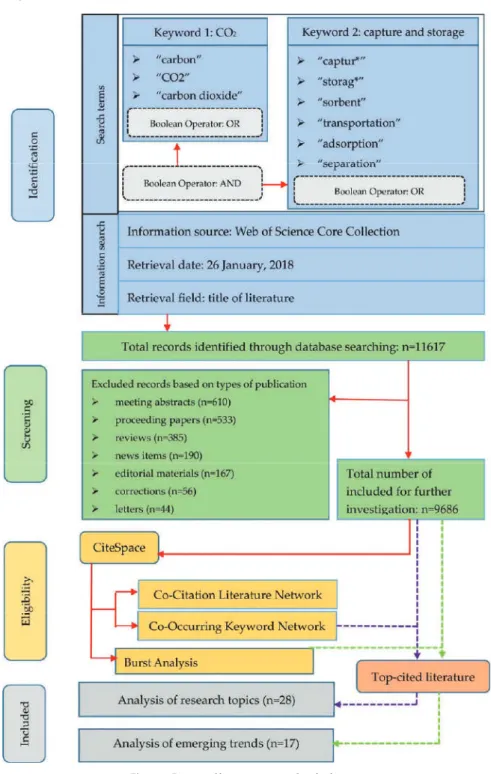
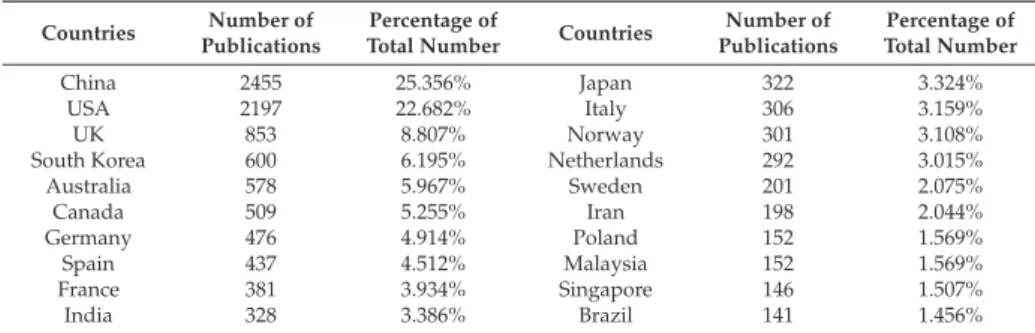
In this article, CiteSpace was used as a useful tool to obtain information about CCS technology knowledge mapping. In addition, some special analysis functions related to CiteSpace concepts of centrality, such as burst detection analysis and intermediate centrality analysis [22], will be used to visualize knowledge mapping of CCS technology, including analyzing document distribution, identifying the research boundaries, detecting emerging trends and abrupt changes, and more. The main objective of this article is to examine the evolution of CCS technology from the perspective of mapping CCS research knowledge.
Duration was "all years", database was "Web of Science Core Collection", subject was "Carbon Capture and Storage Technology".
Analyses and Results
A co-citation network of literature in the research field of CCS technology can be developed with the help of CiteSpace, which is shown in Figure 4. This means that these keywords represent research topics in the field of CCS technology. Therefore, these keywords can represent research foci in the research field of CCS technology.
In addition, the most productive institutions in the research area of CCS technology were identified in this study.
Research Limitations
Performance analysis of cold energy recovery from CO2 injection in ship-based carbon capture and storage (CCS).Energies. Development of specific rules for the implementation of life cycle assessment in carbon capture and storage. Energies. Exergy and economic analyzes of indirect coal-to-liquid technology linking carbon capture and storage.J.
Public perception of climate engineering and carbon capture and storage in Germany: Survey evidence. Climate.
Effect of the Implementation of Carbon Capture
Systems on the Environmental, Energy and Economic Performance of the Brazilian Electricity Matrix
Material and Methods
The average molar composition of the fuel used in the simulation is given in Table 3 below [39]. The basic process parameters used for the simulation of the CaL system coupled with coal and natural gas power plants are shown in Table 4[33,40-42]. In the case of the natural gas power plant, the fuel addition rate is 23.0 m3/s.
This is because S4 accumulates the effects, which, for GWP, are positive, of implementing the CaL process in coal and natural gas power plants.
Analysis of Carbon Storage and Its Contributing Factors—A Case Study in the Loess Plateau (China)
Materials and Methods 1. Study Area
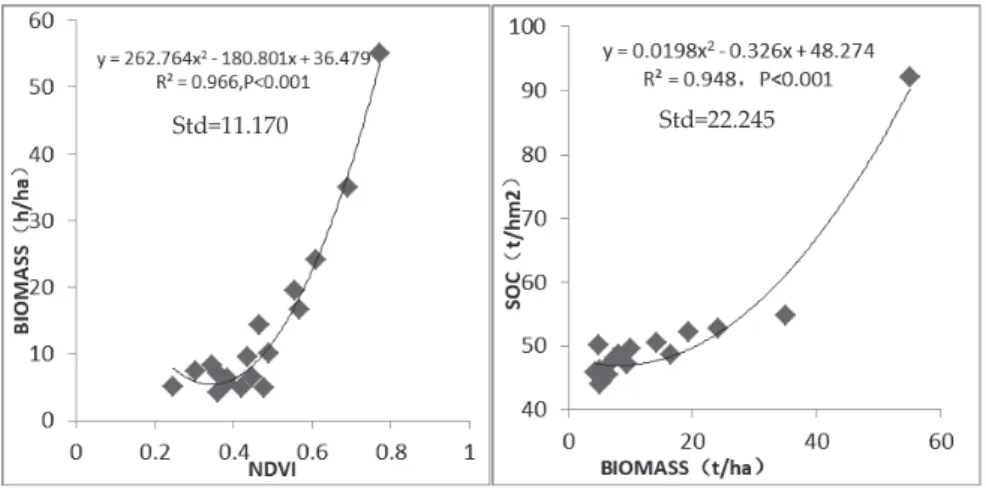
- NDVI
Then the land cover and carbon density parameters were entered into Integrated Valuation of Ecosystem Services and Trade (InVEST) to determine the carbon storage in 2005 and 2010 in the Loess Plateau. 1) The key carbon library parameter inversion. From 2011 to 2015, the average monthly temperature was 10.7◦C; the average monthly rainfall was 45.6 mm, which was also mostly concentrated from July to September, accounting for more than 60% of the annual rainfall;. The SOC was measured by potassium dichromate oxidation spectrophotometry (HJ Calculation of the carbon density of the forest.
In addition, grassland carbon was calculated in the same way as the carbon of the underground plants and the carbon-containing herb turnover [19].
Results
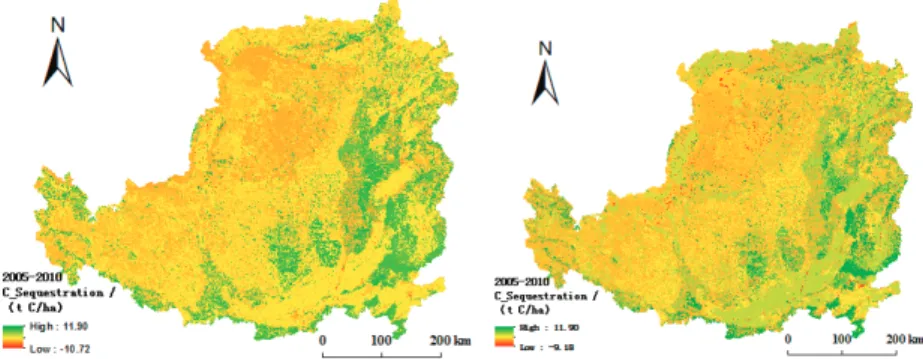
From 2000 to 2010, carbon storage in the Loess Plateau decreased by 0.3 million tonnes, accounting for -1% of carbon storage dynamics (Figure 5). Carbon density in the saline-alkali soil first increased and then decreased, and the overall trend was an increase. Assuming no soil conversion, the carbon storage changes due to the changes in carbon density only were considered.
Loess Plateau carbon storage increased by 26.2 million tonnes, accounting for 100.1% of carbon storage dynamics (Figure 6).
Discussion
The spatial resolution of the simulated data in the Löss Plateau was 1 km, which is low, leading to uncertainty in the accuracy of the simulation result. The increases in carbon density in cultivated land and grassland were the most prominent. Storage and allocation of carbon and nitrogen in Robinia pseudoacacia plantation of different ages in the hilly loess area, China. Chin.
Environmental driving factors affecting plant biomass in natural grassland in the Loess Plateau, China. Ecol.
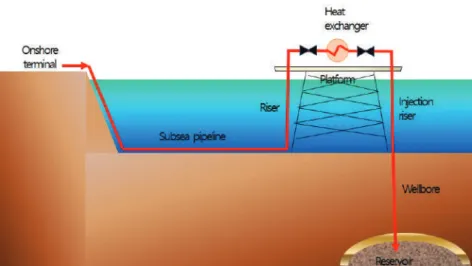
Instability Analysis of Supercritical CO 2 during Transportation and Injection in Carbon Capture and
Method of Numerical Analysis 1. CCS Chain Configuration
Along the pseudocritical line in the unstable region, the density of CO2 changes significantly depending on pressure and temperature. In this section, the cause of the above-mentioned flow instability in the unstable region is analyzed. Figure 12 shows that the trend in the flow instability of supercritical CO2 is clearly different at the boundary of the previously obtained unstable region.
The initial pressure and temperature in the pipeline were all outside the unstable region of the pipeline.
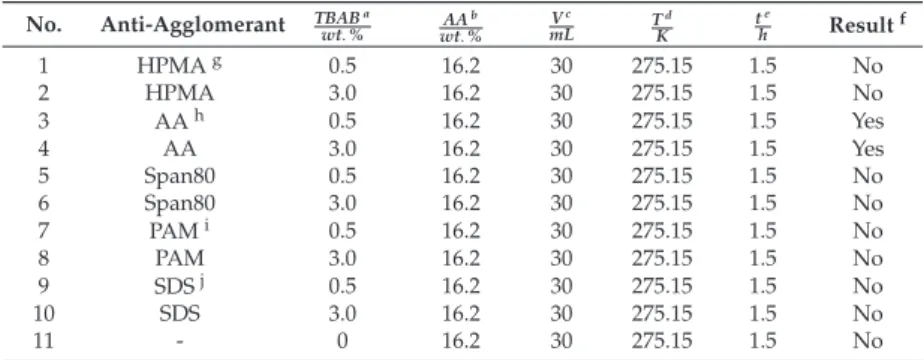
Anti-Agglomerator of Tetra-n-Butyl Ammonium Bromide Hydrate and Its Effect on Hydrate-Based
Results and Discussion 1. Anti-Agglomerant Screening
The photographs of TBAB hydrate with different amounts of AA addition are shown in Figure 2. Figure 4b shows the morphology of hydrate formation in the TBAB/AA system; it can be seen that the small size TBAB hydrate particles are dispersed in the solution. This is because the amount of TBAB hydrate cages generated in the solution increased with the TBAB concentration in the pure TBAB system, allowing more CO2 gas to enter.
Therefore, after reaching phase equilibrium, the gas storage capacity was approximately the same in three different TBAB/AA binary systems, even though the TBAB hydrate particles were dispersed in the solution.
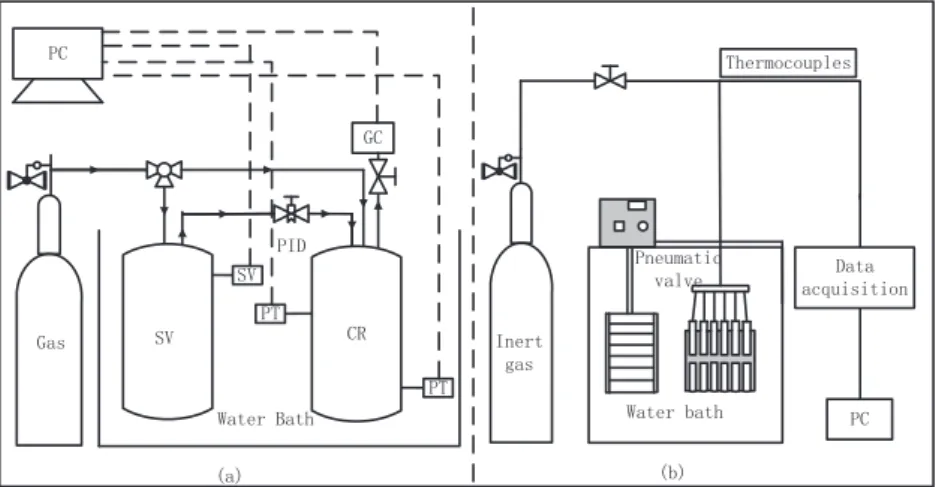
Materials and Methods 1. Apparatus
The CO2spilt fraction of the TBAB/AA system obtained in this work increased by 49.6% compared to the highest value reported in the literature [22]. The composition of residual gas in CR after hydrate formation and dissociation was analyzed by gas chromatography (GC522, Shanghai Wufeng Scientific Instrument Co., Ltd., Shanghai, China). According to the law of conservation of mass, the total amount of gas is composed of the gas dissolved in the water, the gas trapped in the hydrate and the gas remaining in the residual gas phase.
The amount of gas consumed during hydrate formation (ΔnH) includes the gas dissolved in the water and the gas trapped in the hydrate, which can be calculated as follows [5]:. 2) where is the compressibility factor calculated by Pitzer's correlation [26], subscript refers to time, subscript 0 refers to the initial time, subscript refers to the gas phase in CR.
![Figure 8. Wind power installed capacity, generation, and annual equivalent hours at full capacity (HFC) for the year 2015 (data taken from [3]).](https://thumb-ap.123doks.com/thumbv2/1libvncom/9200916.0/18.751.236.516.109.497/figure-wind-installed-capacity-generation-annual-equivalent-capacity.webp)
![Figure 13. Portugal natural gas storage and transportation infrastructure (reprinted from [36] with permission from REN).](https://thumb-ap.123doks.com/thumbv2/1libvncom/9200916.0/23.751.223.526.107.507/figure-portugal-natural-storage-transportation-infrastructure-reprinted-permission.webp)